 MetaTrader 5
 Experts
 지표
지표
 라이브러리
라이브러리
 유틸리티
유틸리티
 위젯
위젯
 규칙
규칙
MetaTrader 5용 새 기술 지표 - 90
 기술 지표의 시그널은 주식 및 외환 시장에서 거래를 개시 및 종료하는 데 중요한 역할을 합니다. 지표의 본질은 미래의 가격 변화를 예측하기 위한 금융 시그널 값의 수학적 변형입니다.
기술 지표를 테스트하여 시장 행동과 그로 인한 이익을 더 잘 예측할 수 있습니다.
기술 지표의 시그널은 주식 및 외환 시장에서 거래를 개시 및 종료하는 데 중요한 역할을 합니다. 지표의 본질은 미래의 가격 변화를 예측하기 위한 금융 시그널 값의 수학적 변형입니다.
기술 지표를 테스트하여 시장 행동과 그로 인한 이익을 더 잘 예측할 수 있습니다. 
SideZone: Trend Intensity Oscillator – Filter the Noise, Ride the Trend Overview
SideZone is a specialized oscillator engineered to solve a common trader's dilemma: distinguishing between a true trend and a ranging market. By clearly visualizing trend direction and sideways consolidation, SideZone helps you stay on the right side of the move while avoiding the whipsaw of low-volatility environments. Its core function is to provide a clear, color-coded visual representation of market sentiment

Представлен принципиально новый индикатор ZigZag, который отличается от стандартного абсолютной легкостью, быстродействием расчетов и очень высокой точностью. В основе индикатора заложен принцип цикличности рынка с совокупностью анализа количества текущих баров и их основных ценовых уровней. Чем меньше баров для определения расчетов, тем более агрессивная постройка линий индикатора. Как и в стандартном индикаторе перерисовывается только последняя линия, при изменении достигнутого экстремума.
П

The Advance Sideways Detector is a specialized technical indicator designed for the MetaTrader 5 platform with a single, focused purpose to accurately identify and filter out sideways range-bound markets. By isolating periods of low volatility and price consolidation, this tool helps traders avoid the whipsaws and false signals that often lead to losses, allowing them to focus on capturing strong directional moves. Unlike traditional oscillators that provide buy or sell signals, this detector ac

Hybrid FATL-LRMA : Digital Precision Meets Statistical Certainty
The Ultimate Trend-Momentum Convergence System with clear action protocols.
Why Hybrid FATL-LRMA? The Edge some Traders Miss Are you tired of lagging indicators that signal entries after the move has already happened? Frustrated by noisy oscillators that keep you in chop while trends pass you by?
The Hybrid FATL-LRMA is a dual-engine trading system that bridges the gap between high-frequency digital signal processing and stat

Professional Smart Money Dashboard for Serious Traders The Forex Institutional Dashboard is a powerful smart money dashboard indicator for MetaTrader 5 designed to give traders a complete multi timeframe view of the forex market in one professional interface. Instead of switching between multiple charts and indicators, this forex dashboard indicator combines smart money concepts, multi timeframe trend analysis, price action structure, and volume signals into a single intelligent trading dashboar

O OM Water Mark é um indicador de marca d´agua único e com vai muito além de uma simples marca d´agua, nele vc vê além das informações do Ativo e timeframe, conta com um timer do candle, além de volume em tempo real. Você nunca viu nada igual. Principais recursos
- Marca d’água central com o nome do ativo + timeframe (ex.: “EURUSD H1”). - Timer do candle: mostra, abaixo do texto principal, o tempo restante para fechar a vela atual (contagem regressiva). - Atualização automática a cada 1 segund
FREE

Multichart V and H Line Sync Overview Multichart V and H Line Sync is the essential tool for multi-timeframe traders. It instantly synchronizes your Horizontal Support/Resistance Lines and Vertical Time Lines across all open charts of the same symbol. Stop drawing the same levels on M5, H1, and D1 charts manually. With this tool, draw a line once, and it automatically replicates on every other timeframe. Perfect for keeping your technical analysis consistent and your workspace clean. Key Feature
FREE

PERFECT.... Based on the professional MQL5 code you've provided, here are the top 10 reasons why your implementation is superior to standard trading scripts: High-Performance UI Throttling : By using GetTickCount() to limit UI updates to 200ms in OnTick , you prevent the terminal from freezing during high-volatility news events. Bulletproof Order Closing : Your HandleCloseAll uses a reverse loop ( i = PositionsTotal() - 1 ). This is the industry standard for ensuring no positions are skip
FREE

An indicator to calculate daily the liquidity zones of a currency. Works with XAUUSD. It calculates zones dynamically based on Previous Day High/Low and quarterly levels. LZ_PDH or LZ_PDH_XAUUSD : Previous Day's High . The EA uses this as the upper boundary of the Sell Zone. LZ_PDL or LZ_PDL_XAUUSD : Previous Day's Low . The EA uses this as the lower boundary of the Buy Zone. LZ_UpperQuarter or LZ_UpperQuarter_XAUUSD : A calculated "Upper Quarter" level. The EA uses this to defi

Multichart Object Sync Pro Draw once, see it everywhere. The professional solution for instant multi-chart synchronization. Overview Multichart Object Sync Pro is the ultimate utility for technical traders who demand efficiency. It instantly clones your trendlines, rectangles, and analysis tools across all your open charts. Whether you scalp on the M1 while watching the H1, or use multiple monitors for a full market view, this tool ensures every chart tells the same story. Forget about drawing

Market Energy Zones Market Energy Zones is an advanced indicator designed to visualize the energy distribution of price across different price levels . By analyzing how often price interacts with specific price ranges, the indicator builds a structured map of market energy and liquidity . This allows traders to clearly see where liquidity is concentrated and how price is likely to move between these zones . Energy Zone Concept The indicator divides the market into multiple zones and labels them

TL Method — Automatic Trendline Detection & Strength Indicator Tired of drawing trendlines manually? TL Method does it for you — automatically detecting, drawing, and scoring trendlines in real time. What it does: Scans up to 1000 bars to find valid support and resistance trendlines Scores each trendline by counting confirmed anchor touches Generates buy/sell signal arrows when price approaches strong trendlines Alerts you via popup, push notification, or sound — with smart cooldown to avoid spa

SunSignal ML — AI Gold Signals with Multi-Timeframe Confluence SunSignal ML is an advanced AI-powered signal indicator purpose-built for XAUUSD gold trading. It combines a proprietary adaptive trend algorithm with six machine learning models trained on confirmed price pivots to produce high-confidence entry signals with multi-timeframe validation. The indicator runs efficiently on M1, M5 and M15 timeframes and is designed for traders who want precision entries guided by data rather than guesswor

input double TailPercent = 60.0; // Percentage of the candle tail required to qualify as a valid tail input bool EnableAlert = true; // Set true to enable alert notifications input bool EnableSound = true; // Set true to enable sound alerts input bool EnablePush = true; // Set true to receive push notifications on your phone input ENUM_TIMEFRAMES TimeFrame = PERIOD_H4; // Sniper entry timeframe input int WaitMinutes = 60; // Wait time (in minutes) before sending

AURR Ultra Scalper Pro AURR Ultra Scalper Pro is a powerful smart-money scalping indicator designed to help traders identify high-probability trading opportunities with clear and precise signals. The indicator automatically detects potential BUY and SELL setups , while displaying Entry, Stop Loss, and multiple Take Profit targets directly on the chart. With its clean visual design and built-in risk management tools, this indicator is ideal for both scalpers and intraday traders . Key Features •

This MQL5 code defines a custom technical indicator named HoverClock12H . Its primary purpose is to enhance the MetaTrader 5 (MT5) charting experience by displaying a localized, 12-hour format time label that updates dynamically based on where you hover your mouse cursor. Unlike the default MT5 "Crosshair" tool which usually shows the server time, this indicator converts candle time into your specific local time zone. ## Key Features Dynamic Mouse Tracking: It uses the CHARTEVENT_MOUSE_MOVE even

WAT MACHINE — Product Description DOES NOT REPAINT. EVER. WAT MACHINE is a precision signal indicator for MetaTrader 5 that identifies high-probability turning points in the market and plots clean buy and sell arrows directly on your chart — exactly where price is most likely to reverse. No guessing. No repainting. No chasing. The signal is confirmed and locked in. What you see is what was there. HOW TO USE IT When an arrow appears, you have two options: Direct entry — enter at market on the nex

Step Line Chart I created this indicator because I couldn't find a built-in step line chart in MT5, and I was tired of switching back and forth to TradingView just to see one. This is my very first indicator, originally made for my own personal use, and I am sharing it for anyone who might have the same need. What it does: Transforms the standard MT5 Line Chart into a clean Step Line chart based on Close prices. When attached, it automatically switches the chart mode to "Line Chart" and hides t
FREE

Intraday Blast — Professional BTC & Gold Trading Framework
Intraday Blast is a precision-built, institutional-style intraday framework designed exclusively for Bitcoin (BTC) and Gold (XAU / GC) traders.
This private indicator blends adaptive volatility zones, multi-timeframe POC, VWAP, and trend confirmation into one clean, decision-focused system.
It is not a signal-spamming indicator.
It is a context engine for disciplined traders who understand execution, risk, and patience.
Desig

MERAVITH SCANNER는 MetaTrader 5용 전문 금융 시장 지표로, 여러 분석 도구를 하나의 통합 시스템으로 결합합니다. 독점적인 거래량 가중 평균 가격(VWAP) 방법론을 사용하여 모든 계산을 자동으로 수행하며, 주관적인 해석을 완전히 배제합니다. 이 지표는 모든 자산 클래스(Forex, 주식, 지수, 상품, 암호화폐)와 M1부터 월간 차트까지 모든 시간 프레임에서 작동합니다. 기본 원리는 “가격은 거래량을 따른다”입니다. MERAVITH는 기관 거래량이 집중되는 위치를 식별하고, 그 집중에서 수학적으로 정확한 가격 수준을 도출합니다. 예측이나 투기를 하지 않으며, 계산만 수행합니다. MERAVITH SCANNER를 사용하면 28개의 주요 Forex 통화쌍을 모든 시간 프레임에서 단 2~3분 만에 스캔할 수 있습니다. 또한 원하는 시장을 스캔할 수도 있으며, 예를 들어 약 100개의 주식을 약 10분 안에 스캔할 수 있습니다. 지표는 소진 레벨, 균형선, 편차, 통계

자동 위험 관리 및 구조 돌파 스캐너를 포함한 구조 추세 분석 버전: 1.0
개요 자동 위험 관리 기능을 갖춘 구조 추세 분석은 가격 움직임과 시장 구조에 의존하는 트레이더를 위해 설계된 종합적인 트레이딩 시스템입니다. 부드러운 추세 필터와 스윙 포인트 감지, 구조 돌파(BOS) 신호를 결합하여 높은 확률의 거래 설정을 생성합니다.
이 도구의 가장 두드러진 특징은 자동 위험 관리 기능입니다. 유효한 구조 돌파가 감지되면 지표는 즉시 위험/보상 영역(1:1, 1:2, 1:3)을 계산하고 표시하며, 가격이 목표에 도달할 때 거래 시각화를 자동으로 관리합니다. 수동으로 차트를 그릴 필요가 없어 트레이더는 실행에만 집중할 수 있습니다.
주요 기능 동적 구조 돌파(BOS) 감지
스윙 고점(HH/LH)과 스윙 저점(HL/LL)을 자동으로 식별합니다.
가격이 주요 구조적 레벨을 돌파할 때 차트에 BOS 라인을 직접 표시하여 추세 방향을 확인합니다.
구조적 핵심 지점을 명확한 텍스트
FREE

리버설 셋업을 놓치지 마세요. **Candlestick Reversal Dashboard(캔들스틱 리버설 대시보드)**는 전체 관심 종목 목록을 모든 타임프레임에 걸쳐 자동으로 스캔하고, 패턴이 형성되는 즉시 알림을 보냅니다 — 절대 리페인트하지 않는 신호와 함께. 이 인디케이터가 하는 일 20개의 통화 쌍을 여러 타임프레임에 걸쳐 캔들스틱 리버설 패턴을 찾아 수동으로 스캔하려면 몇 시간이 걸립니다. 셋업을 발견했을 때는 이미 진입 시점이 지나간 경우가 대부분입니다. Candlestick Reversal Dashboard 는 이 문제를 완전히 해결합니다. 최대 20개 심볼과 9개 타임프레임에 걸쳐 14가지 모든 클래식 리버설 패턴을 동시에 자동 감지합니다. 확인된 모든 신호는 깔끔하고 스크롤 가능한 대시보드에 표시됩니다. 한 번의 클릭으로 패턴이 형성된 차트로 직접 이동할 수 있습니다. 신호는 캔들이 마감된 후에만 생성됩니다 . 패턴이 대시보드에 나타나면, 그것은 절대

This is our version of the Bull Market Support Band indicator.
This indicator contains two moving averages: one simple and one exponential. Together, they represent a support band that can be used in both bull and bear markets.
Although originally designed for the weekly chart, it can be used on any timeframe.
Our version adds a candle coloring rule: green for closes above the band and red for closes below.
The default value is 20 for the Simple Moving Average (SMA) and 21 for the Exponentia
FREE

Trend Guardian Pro – 추세 조기 예측 인디케이터 Trend Guardian Pro 는 전문 수학자, 분석가 및 트레이더 팀의 협업으로 탄생한 결과물입니다. 수년간의 시장 데이터 분석을 토대로 제작되었으며, 고급 수학적 모델링 기법을 활용하여 추세의 잠재적 변화를 조기에 식별합니다. 주요 특징: 조기 예측 – 시장의 변화가 명확해지기 전, 다양한 시장 요인을 분석하여 추세 전환 신호를 포착합니다. 종합 분석 – 여러 시간대(Multi-Timeframe)를 동시에 분석하여 신호의 신뢰도를 높입니다. 적응형 알고리즘 – 현재 시장의 변동성에 맞춰 알고리즘이 자동으로 조정됩니다. 노이즈 필터링 – 고급 필터링 기술을 통해 시장 노이즈를 제거하고 가짜 신호(데드 캣 바운스 등)를 최소화합니다. 직관적인 인터페이스 – 필요한 모든 정보를 차트 위에 시각적으로 명확하게 표시합니다. 핵심 기능: 추세 강도 식별 (약함 / 중간 / 강함); 거래량 분석 을 통한

여러 심볼과 시간 프레임에서 수렴 쐐기 패턴을 자동으로 감지하세요 울프 파동은 기술적 분석에서 가장 강력하고 독특한 구조를 가진 패턴 중 하나입니다. 피보나치 비율에 의존하는 하모닉 패턴과 달리, 울프 파동은 순수한 기하학을 사용합니다 — 수렴하는 추세선이 가격이 어디로 갈지뿐만 아니라 언제 도달할지도 예측합니다. 이 내장된 가격과 시간 예측이 울프 파동을 트레이더가 사용할 수 있는 다른 어떤 패턴과도 다르게 만듭니다. 유효한 울프 파동을 수동으로 찾으려면 다섯 개의 피봇 포인트를 정확하게 식별하고 라인 1-3과 2-4가 진정으로 수렴하는지 신중하게 확인해야 합니다. 이 대시보드는 9개의 시간 프레임에서 최대 20개의 종목을 자동으로 스캔하고, 다섯 개의 피봇 포인트를 모두 감지하며, 완전한 패턴 기하학을 그리고, 유효한 울프 파동이 확인되는 순간 알림을 보내 그 수동 작업을 없애줍니다. 울프 파동이 독특한 이유 대부분의 패턴 기반 거래 도구는 외부 계산이나 피보나치 확장을

NIKA QUANT ANALYZER — MT5 전략 테스터 전문 최적화 분석 도구
어떤 최적화 결과가 진짜이고 어떤 것이 커브피팅 함정인지 추측하는 것을 멈추세요.
Nika Quant Analyzer는 MT5 전략 테스터 XML 내보내기를 읽고 QM+ 점수로 각 파라미터 조합을 즉시 순위 매깁니다. Profit Factor, Sharpe Ratio, Recovery Factor, 최대 드로다운, Return/DD, 거래 수를 하나의 복합 지표로 통합합니다.
다중 파일 글로벌 랜킹 지원: 여러 XML을 로드하면 모든 패스가 심볼과 타임프레임 전체에서 통합 랜킹됩니다.
주요 기능
- QM+ 복합 점수 — 하나의 숫자로 의사결정. 조정 가능한 가중치 공식. - 다중 파일 글로벌 랜킹 — 여러 XML 로드. GLOBAL RANK와 BY FILE 모드 전환. - 심볼 및 타임프레임 표시 — 각 행에 심볼과 TF 표시. - QM 분포 히스토그램 — 로그 스케일로 품질 등급별 분포.
FREE

20개의 심볼과 9개의 타임프레임에 걸쳐 희귀하고 강력한 Cypher 하모닉 패턴을 자동으로 감지 — 피보나치로 검증된 리페인트 없는 신호를 차트와 모바일 기기에 직접 전송합니다. Cypher 패턴이란 Cypher는 엄격한 피보나치 관계를 사용하여 고확률 가격 반전 구역을 식별하는 5점 XABCD 하모닉 구조입니다. Cypher가 모든 하모닉 패턴 중에서 독특한 이유는 포인트 C가 XA 레그의 127.2%–141.4%를 초과하여 연장되어야 한다 는 점입니다 — 즉, C는 가격이 반전되기 전에 실제로 포인트 A를 넘어 움직입니다. 이는 명확하게 정의된 반전 구역을 가진 강력한 "오버슈트" 구조를 만들어냅니다. 그런 다음 포인트 D는 XC 레그 전체의 78.6%를 되돌려 패턴을 완성합니다. D가 경계 내에 머물기 때문에 — 강세 설정에서는 X 위, 약세에서는 X 아래 — Cypher는 대부분의 다른 하모닉 패턴보다 더 타이트한 손절 배치 를 허용하여 우수한 리스크-리워드 비율을

여러 심볼과 시간 프레임에서 전설적인 가틀리 패턴을 자동으로 감지하세요 가틀리 패턴 — 1935년 H.M. 가틀리가 발견하고 스콧 카니가 특정 피보나치 비율로 정교하게 다듬은 — 은 모든 하모닉 패턴의 "할아버지"로 여겨집니다. 정확한 B 포인트 61.8% 되돌림과 D 포인트 78.6% 완성은 기술적 분석에서 가장 신뢰할 수 있는 잠재적 반전 구역 중 하나를 만들어냅니다. 올바르게 형성된 가틀리 패턴을 수동으로 찾으려면 수 시간의 차트 분석과 신중한 피보나치 검증이 필요합니다. 이 대시보드는 최대 20개의 종목을 9개의 시간 프레임에 걸쳐 자동으로 스캔하고, 필요한 모든 비율을 검증하며, 유효한 가틀리가 완성되는 순간 알림을 보내 그 지루한 작업을 없애줍니다. 가틀리 패턴이 특별한 이유 가틀리는 각 레그에 엄격한 피보나치 요건을 가진 5점 XABCD 하모닉 구조입니다. 더 단순한 패턴과 달리 가틀리는 정확한 비율 정렬을 요구하며, 이는 거의 90년에 걸친 검증된 시장 심리학으로 뒷받

Forex Bat Harmonic Dashboard 를 만든 이유는 여러 통화쌍과 타임프레임에 걸쳐 정확한 Bat 패턴을 수동으로 찾는 데 몇 시간이 걸렸고——그럼에도 계속해서 셋업을 놓쳤기 때문입니다. 이것은 진정한 Bat를 정의하는 핵심 XAD 88.6% 되돌림 을 포함한 엄격한 피보나치 비율 검증을 사용하여 전체 관찰 목록에서 Bat 하모닉 패턴 을 자동으로 감지하는 전문가급 멀티 심볼·멀티 타임프레임 스캐너입니다. 백그라운드에서 지속적으로 실행되며 모든 확인된 패턴을 하나의 깔끔하고 정리된 대시보드에 표시합니다. 모든 신호는 적절한 우측 확인(기본값 PivotRight = 5)과 함께 확정된 봉에서 확인됩니다. Bat 패턴이 대시보드에 나타나면 절대 사라지거나 변경되지 않습니다. Bat 패턴을 독특하게 만드는 것은? Scott Carney가 발견한 Bat 패턴 은 D 포인트가 XA의 정확히 88.6%를 되돌리는 5점 XABCD 하모닉 구조입니다——Gartle

RSI Divergence Pulse는 다이버전스 감지, 다중 타임프레임 분석, 시각 도구를 하나의 가벼운 애플리케이션에 통합한 포괄적인 RSI 지표입니다. Regular 및 Hidden 다이버전스를 자동으로 식별하고, 실시간 Multi-Timeframe RSI 패널을 표시하며, OB/OS 영역을 시각적으로 인식하기 쉽게 채우고, 가격 차트와 RSI 하위 창 모두에 다이버전스 선을 그려주며, Buy/Sell 화살표를 배치하고 실시간 알림을 제공합니다. Features Color-Coded RSI Line
RSI 선은 현재 영역에 따라 색상이 변경됩니다. 파랑은 중립 영역(30~70)을 나타냅니다. 초록은 과매수 영역(70 이상)을 나타냅니다. 빨강은 과매도 영역(30 이하)을 나타냅니다. RSI Signal Line
RSI의 SMA(기본 기간 9)가 신호선으로 작동합니다. RSI와 신호선의 교차는 타이밍 정보를 추가로 제공합니다. 차이값(Diff)은 대시보드에 표시됩니다. Auto

Cyclic Impulse MT5 — 이 기술 지표는 차트 구조를 분석하여 주기적인 가격 움직임을 식별합니다. 이를 통해 주기적인 가격 움직임의 반전과 진입 신호를 찾을 수 있습니다.
지표 작동 방식
주기적인 하락 움직임이 감지되면 캔들 마감 후 파란색 하락 막대가 생성됩니다. 현재 캔들에서 잠시 깜빡일 수 있으며, 신호는 아직 확정되지 않았습니다. 파란색 화살표는 가격 차트에 중복 표시됩니다.
주기적인 상승 움직임이 감지되면 캔들 마감 후 빨간색 상승 막대가 생성됩니다. 현재 캔들에서 잠시 깜빡일 수 있으며, 신호는 아직 확정되지 않았습니다. 주황색 화살표는 가격 차트에 중복 표시됩니다.
모든 차트, 시간 프레임, 거래 상품에 사용 가능합니다.
다양한 알림 유형을 제공합니다.
가격 차트에 추가 화살표를 표시합니다.
과거 차트에는 다시 그려지지 않으며, 캔들 마감 시에만 작동합니다. 캔들이 마감되더라도 화살표나 막대는 사라지지 않습니다.
사용 및 매개변수 설정이 간편하며,

ABCD Harmonic Dashboard를 만든 이유는 매일 아침 몇 시간씩 차트를 수동으로 스캔하며 하모닉 셋업을 찾다가——그럼에도 절반은 놓치는 현실에 지쳤기 때문입니다. 이것은 엄격한 피보나치 비율 검증을 사용하여 전체 관찰 목록에서 AB=CD 하모닉 패턴을 자동으로 감지하는 전문가급 멀티 심볼·멀티 타임프레임 스캐너입니다. 백그라운드에서 지속적으로 실행되며 모든 확인된 패턴을 하나의 깔끔하고 정리된 대시보드에 표시합니다. 더 이상 차트를 전환할 필요가 없습니다. 더 이상 기회를 놓치지 않습니다. 제가 보여드리는 모든 신호는 확정된 봉에서 확인됩니다. 패턴이 대시보드에 나타나면 절대 사라지거나 변경되지 않습니다. 보이는 것이 바로 실시간에 실제로 있었던 것입니다. AB=CD 패턴이란 무엇인가? AB=CD는 기술적 분석에서 가장 신뢰할 수 있는 하모닉 패턴 중 하나입니다. 네 개의 가격 피벗——A, B, C, D——으로 구성되며 D 포인트가 고확률 반전 구역을 표시합니다. 구조

저는 Forex Butterfly Harmonic Dashboard 를 만들었습니다. 여러 통화쌍과 타임프레임에서 진정한 Butterfly 익스텐션 패턴을 수동으로 식별하는 데 수 시간이 걸렸고——그럼에도 계속해서 Gartley 셋업과 혼동하며 최고의 익스텐션 움직임을 놓쳤기 때문입니다. 이것은 D가 원점 X를 초과하여 연장된다 는 핵심 요건을 포함한 엄격한 4단계 피보나치 비율 검증을 사용하여 전체 워치리스트에서 Butterfly 하모닉 패턴 을 자동으로 감지하는 전문적인 멀티 심볼·멀티 타임프레임 스캐너입니다——이것이 진정한 Butterfly를 정의하는 유일한 특징입니다. 백그라운드에서 지속적으로 실행되며 확인된 모든 패턴을 하나의 깔끔하고 체계적인 대시보드에 표시합니다. 모든 신호는 좌우 피벗 확인이 완료된 마감 캔들에서 확인됩니다. Butterfly 패턴이 대시보드에 나타나면 절대로 사라지거나 변경되지 않습니다. Butterfly 패턴을 독특하게 만드는 요소는? B

볼륨 델타 MT5 이 지표는 MetaTrader 5용 전문 주문 흐름 지표로, 거래량 불균형 로직을 사용하여 메인 차트 창에 매수 및 매도 압력을 직접 시각화하도록 설계되었습니다. 캔들 구조와 사용 가능한 틱 또는 실제 거래량을 기반으로 공격적인 매수 압력과 매도 압력의 차이인 델타를 계산하여 시장 지배력을 명확하게 보여줍니다. 이 지표는 외환, 지수, 상품, 암호화폐, 주식 등 모든 상품과 시간대에 적용 가능합니다. 네팅 및 헤징 계좌와 완벽하게 호환되며, 실계좌와 데모 계좌 모두에서 사용할 수 있고, CPU 리소스에 과부하를 주지 않으면서 안정적인 성능을 제공하도록 최적화되어 있습니다. 모든 계산은 효율적으로 수행되며 필요한 캔들에 대해서만 실행되므로 사양이 낮은 VPS 환경에서도 원활하게 작동합니다. Volume Delta는 시장 압력에 따라 차트에서 캔들에 직접 색상을 입힙니다. DeltaThreshold 매개변수 이상에서 강한 매수 압력이 발생하면 BuyVolumeColo

BCB Elevate의 Projection 지표는 완전한 프로페셔널급 마켓 구조 및 추세 추종 도구입니다. 수동 트레이더를 위해 제작되었으며, 매크로 트렌드 필터(EMA 100), 동적 ATR 트레일링 스탑, 스윙 고점/저점(Swing High/Low) 피벗 추적을 결합하여 매우 정확한 차트 신호를 제공합니다. 차트를 재그리거나 혼잡하게 만드는 대신 Projection 지표는 엄격한 조건이 맞을 때까지 기다렸다가 진입 화살표, 손절(Stop Loss) 목표 및 이익 실현(Take Profit) 레벨을 표시합니다. 주요 기능: 추세 감지: 구조적 스윙 고점/저점을 사용하여 진정한 시장 추세를 식별합니다. 매크로 필터: EMA 100을 기준선으로 사용하여 지배적인 모멘텀에 따라 거래하도록 보장합니다. 동적 ATR 스탑: 변동성에 따른 손절과 이중 테이크프로핏(TP1 & TP2) 구역을 자동으로 계산합니다. RSI 피크 감지: 거래 중 RSI가 극단적인 과매수/과매도 수준에 도달하면 알림

마켓 익소스천 인디케이터 가격: $0 플랫폼: MetaTrader 5 유형: 기술적 지표 (자동매매 아님) 개요 Market Exhaustion Indicator 는 시장 구조 기반 기술적 분석 도구로, GomerAI 시장 연구 프레임워크의 일부로 개발되었습니다. 이 지표는 객관적인 시장 구조 분석을 통해 단기적인 가격 극단과 잠재적인 되돌림 구간을 식별하도록 설계되었습니다. 단순한 캔들 카운트나 일반적인 과매수/과매도 지표에만 의존하는 대신, 이 지표는 낮은 시간 프레임의 시장 구조를 분석하여 다음을 식별합니다. 확인된 스윙 고점과 스윙 저점 최근 구조적 극단을 넘어서는 가격 이동 강한 방향성 움직임 이후 발생할 수 있는 시장 피로 또는 소진 이전 구조 영역으로의 되돌림 조건 이 지표는 자동 거래가 아닌, 객관적이고 규칙 기반의 방식으로 시장 소진을 식별하려는 트레이더를 위해 설계되었습니다. 기능 설명 이 지표는 다음을 지속적으로 분석합니다. 확인된 스윙 고점 및 저점 탐지 단기
FREE

알파 원 MT5 - 고급 추세 탐지 시스템
알파 원은 전문적인 추세 추종 지표로, 차트에 직접 표시되는 자동 진입, 손절매, 세 가지 이익 실현 수준과 함께 명확한 매수 및 매도 신호를 제공합니다.
이 지표는 실시간 추세 강도와 방향을 반영하기 위해 녹색과 빨간색 사이를 전환하는 15개의 동적 라인으로 구성된 독특한 에너지 필드 시각화 기능을 갖추고 있습니다. 녹색 에너지는 강세 우세를, 빨간색 에너지는 약세 압력을 나타내어 시장 모멘텀을 즉시 시각적으로 파악할 수 있게 합니다.
신호 시스템 신호는 여러 독립적인 분석 차원에서의 모멘텀 변화를 분석하는 다중 확인 과정을 통해 생성됩니다. 각 신호는 차트에 표시되기 전에 여러 구성 요소의 일치된 판단이 필요합니다.
리페인트 없음 보장 모든 신호는 확정된 마감 바에서만 계산됩니다. 신호가 표시되면 절대 이동, 변경 또는 사라지지 않습니다. 과거 데이터에서 보는 것은 실시간에 나타난 것과 정확히 동일합니다. 백테스트 결과는 실제 성

ZigZag_3LZZ — 3단계 지그재그 인디케이터
ZigZag_3LZZ 인디케이터는 금융 시장의 기술적 분석을 위해 설계되었습니다. 차트에 서로 다른 주기(5, 13, 34)를 가진 세 가지 색상의 지그재그 라인을 표시하여 트레이더에게 다음 기능을 제공합니다:
주요 가격 반전 수준을 시각적으로 식별
중요하지 않은 가격 변동과 시장 노이즈 필터링
최신 극점을 기반으로 추세선 그리기
피보나치 수준 자동 계산 (0.24, 0.382, 0.5, 0.618, 0.76)
현재 지지선과 저항선 수준 결정
새로운 극점 출현 시 즉각적인 반전 신호 획득
단일 차트에서 세 가지 시간대를 시각적으로 비교
적용 분야
이 인디케이터는 다양한 거래 전략에 사용됩니다:
추세 거래 — 세 가지 방향의 지그재그 라인을 통한 추세 방향 판단
수준 거래 — 지지/저항 수준에서 시장 진입
반전점 탐색

Multi-Mode Gann Angles Indicator (MT5) 이 인디케이터를 사용하는 실제 거래 성과 신호는 다음 링크에서 확인할 수 있습니다:
https://www.mql5.com/ru/signals/2376159
Multi-Mode Gann Angles 인디케이터는 차트에서 선택한 캔들을 클릭한 후 추세선으로 구성된 팬 형태를 생성합니다. 시각적 구조는 전통적인 Gann 각도와 유사하며, 시장 구조에 대한 수동 분석을 위해 설계되었습니다. 각도의 스케일은 여러 방식으로 설정할 수 있습니다. 사용자는 고정 값을 사용할 수도 있고, 지정된 개수의 과거 봉을 기준으로 계산된 평균 가격 움직임을 기반으로 값을 산출할 수도 있습니다. 이를 통해 분석 중인 종목과 시간대의 특성에 맞게 각도 구성을 조정할 수 있습니다. 이 인디케이터는 각 타임프레임에서 독립적으로 작동합니다. 추세선은 생성된 타임프레임에서만 표시됩니다. 각 인스턴스는 IndicatorId와 현재 타임프레임을 포함

MT4 버전: https://www.mql5.com/en/market/product/157433 MT5 버전: https://www.mql5.com/en/market/product/167286
볼륨 불균형(Volume Imbalance)은 가벼운 볼륨 프로파일과 델타 불균형 시각화 도구로, 설정 가능한 조회 범위 내에서 거래량이 많은 가격대, 방향성 압력, 그리고 거래량이 적은 가격대를 파악하는 데 도움을 줍니다.
총 거래량만 보여주는 기존 볼륨 프로파일과 달리, 이 지표는 각 가격대를 다음과 같이 구분합니다. 매수 거래량(매수 압력) – 상승 캔들(종가 > 시가)을 기준으로 추정 매도 거래량(매도 압력) – 하락 캔들(종가 ≤ 시가)을 기준으로 추정 결과적으로 차트 오른쪽에는 TradingView 스타일의 깔끔한 프로파일이 표시되고, 델타 요약 패널에는 가격대별 불균형 비율(Δ%)이 표시되어 매수자와 매도자가 우세했던 지점을 쉽게 확인할 수 있습니다.
또한, 선택한 기간 내

SMT Multi-TF Dashboard는 MetaTrader용 전문 다중 타임프레임 분석 패널입니다. 7개 타임프레임의 추세 방향, EMA 상태, RSI, MACD, 스토캐스틱 및 주요 지지/저항 수준을 차트 상의 단일 대시보드에 동시에 표시합니다. 작동 원리 인디케이터는 M5, M15, H1, H4, D1, W1, MN 타임프레임을 스캔하고 EMA 포지셔닝, 시장 구조 분석(높은 고점/높은 저점 감지) 및 ADX 방향 강도를 사용하여 각각의 복합 추세 점수를 계산합니다. 모든 계산은 리페인팅을 방지하기 위해 확인된 종가 바(시프트 1)를 사용합니다. 대시보드 열 TF: 현재 차트 타임프레임의 선택적 하이라이트가 있는 타임프레임 레이블. TREND: EMA 정렬, 시장 구조, ADX 방향 지수를 결합한 복합 추세 방향. EMA: 빠른 및 느린 EMA 크로스오버 상태. RSI: 과매수 및 과매도 영역 식별이 포함된 상대강도지수 값. MACD: 시그널 라인 대비 MACD 라인

Predicta Pro Confluence Dashboard는 복잡한 시장 분석을 간소화하도록 설계된 전문가용 분석 도구로, 차트에 여러 개의 선과 오실레이터를 추가하여 복잡하게 만드는 대신, 8가지 핵심 기술 지표를 하나의 간결하고 읽기 쉬운 패널에 통합했습니다.
스마트한 컨플루언스 스코어링 시스템을 기반으로 시장 모멘텀, 추세, 거래량을 실시간으로 분석하여 명확한 방향성과 높은 확률의 진입 신호를 제공합니다.
주요 장점:
깔끔한 차트: 캔들스틱 차트를 100% 깔끔하게 유지합니다. 간결한 대시보드는 화면 측면에 깔끔하게 정렬됩니다.
실시간 확률: 매수자와 매도자의 강도를 나타내는 동적 점수(0~8)를 계산합니다.
재도색 없음: 모든 계산은 현재 가격 움직임과 종가 데이터에만 기반하므로 재도색이 발생하지 않습니다.
시간 절약: 감정적인 거래나 분석 마비 현상을 방지하고, 복잡한 분석을 대신 수행해 줍니다.
즉시 모바일 알림: 높은 확률의 매매 기회가 발생하면 텔레그램

Smart Money Trap Detector 는 스윙 고점과 스윙 저점에서 유동성 함정을 식별합니다 . 가격이 핵심 수준을 돌파한 후 반전할 때 기관 투자자가 설정한 잠재적 불 트랩 또는 베어 트랩을 감지합니다 . 각 감지된 트랩은 꼬리 크기 , 반전 속도 , 거래량에 기반한 1~5 의 강도 점수를 받습니다 . 작동 원리 인디케이터는 설정 가능한 룩백 기간을 사용하여 스윙 고저점을 추적합니다 . 가격이 스윙 고점 또는 저점을 돌파하면 , 설정된 확인 캔들 수 내에 가격이 수준을 다시 통과하여 반전하는지 모니터링합니다 . 돌파 꼬리가 최소 ATR 비율 임계값을 충족하고 가격이 범위 내로 되돌아 마감하면 트랩이 확인됩니다 . 모든 신호는 리페인팅을 방지하기 위해 확인된 종가 바에 배치됩니다 . 시각적 기능 차트의 화살표가 확인된 불 트랩 ( 위쪽 화살표 ) 과 베어 트랩 ( 아래쪽 화살표 ) 을 표시 . 유동성 영역이 스윙 포인트 주변에 색상 사각형으로 그려짐 . 텍스트 레이블

MT5용 Crypto_Forex 지표 "Micro M 및 Micro W 패턴", 리페인트 및 지연 없음. - "Micro M 및 Micro W 패턴" 지표는 가격 변동 거래에 매우 강력한 지표입니다. - 이 지표는 차트에서 Micro M 패턴과 Micro W 패턴을 감지합니다. - 상승 Micro W - 차트에 파란색 화살표 신호(그림 참조). - 하락 Micro M - 차트에 빨간색 화살표 신호(그림 참조). - PC 및 모바일 알림 기능 내장. - "Micro M 및 Micro W 패턴" 지표는 지지/저항 레벨과 함께 사용하기에도 매우 좋습니다. - 모든 시간대에서 사용 가능합니다. - 추세 변화 또는 조정 종료 시점을 감지하는 데 매우 유용한 지표입니다. Click here to see high quality Trading Robots and Indicators! MQL5 웹사이트에서만 제공되는 오리지널 제품입니다.

FRACTAL ZONES DECISION – 프랙탈을 실제 결정 구역으로 바꾸는 지표
하나의 캔들이 동시에 상승 프랙탈과 하락 프랙탈을 형성하는 더블 프랙탈을 식별하여 시장의 실제 혼조 구역을 생성합니다. 이 구역은 기존 프랙탈보다 훨씬 강력한 기관 수준의 지지와 저항으로 작용합니다.
지표 기능:
화살표로 클래식 프랙탈 표시(끄기 가능)
혼조 구역을 강조하는 특수 점선 표시(현재 타임프레임별 색상 구분)
MT5의 모든 타임프레임 동시 모니터링(M1부터 MN1까지 최대 21개 추가 TF)
각 구역의 돌파 라인을 자동으로 표시
가격이 더블 프랙탈 구역을 돌파할 때마다 소리 알림과 모바일 Push 알림 전송(타임프레임별 개별 설정 가능)
즉, 시장이 실제로 혼조 상태인 위치를 명확히 보고 그 혼조가 깨질 때 즉시 알림을 받을 수 있습니다.
적합 대상:
정확한 진입을 원하는 스캘퍼
강한 지지와 저항을 찾는 데이트레이더
가격 함정을 피하고 싶은 스윙 트레이더
실제 컨플루언스로 거래하고 싶

MT5용 Crypto_Forex 지표 HTF ADX.
- MT5용 전문 HTF ADX 지표로 거래 방식을 업그레이드하세요. HTF는 상위 시간대를 의미합니다. - ADX(빨간색 선)는 추세 강도를 측정하는 데 사용됩니다. ADX 값이 20 이상이고 상승 추세를 보이면 추세가 강하다는 것을 의미합니다. - +DMI(파란색 선)가 -DMI(녹색 선) 위에 있으면 가격이 상승하고 있으며, ADX는 상승 추세의 강도를 측정합니다. - -DMI(녹색 선)가 +DMI(파란색 선) 위에 있으면 가격이 하락하고 있으며, ADX는 하락 추세의 강도를 측정합니다. - ADX(빨간색 선)가 20 아래에 있으면 시장이 평탄하다는 것을 의미합니다. - 이 지표는 다중 시간대 추세 거래에 매우 유용합니다. 상위 시간대의 ADX를 현재 차트에 적용할 수 있습니다.
Click here to see high quality Trading Robots and Indicators! MQL5 웹사이트에서만 제공되는

이 MT5 지표는 널리 알려진 'ICT Killzones + Pivots' 개념을 커스텀하여 구현한 도구입니다(SMC 및 ICT 개념에서 영감을 받음).
MT5 푸시 알림 기능이 활성화되어 있는지 확인하십시오. 이를 통해 세션 전환(Session Break), 일봉/주봉 마감 등 모든 알림을 모바일로 수신할 수 있습니다.
IC Markets 또는 GMT+2 시간대 브로커를 사용하는 경우 시간 설정(Time Input)에 '-7'을 입력하십시오. Exness 또는 GMT+0 시간대 브로커를 사용하는 경우 '-5'를 입력하십시오. 브로커의 서버 시간 설정은 세션 매매 전략에 영향을 미치므로 정확한 설정이 필수적입니다.
이 지표는 Inner Circle Trader(ICT)의 매매 기법을 따르는 데이트레이더 및 SMC(Smart Money Concept) 트레이더를 위해 설계되었습니다. 차트상에 주요 세션 시간대와, 각 세션에 기반한 동적 피봇(Pivot) 레벨을 시각적으로 표시해 줍

X Sensors Pro는 선택된 기간 동안 가격 수준별 거래량 분포를 시각화하는 전문 볼륨 프로파일 지표입니다. 이 지표는 자동으로 로컬 극값(HH와 LL)을 식별하고, 최대 거래량 수준인 POC(Point of Control)를 계산하며, 식별된 범위를 기반으로 지지선과 저항선을 구축합니다.
주요 기능:
컬러 히스토그램 형태의 볼륨 프로파일 시각화
POC(Point of Control) 자동 감지
HH(더 높은 고가) 및 LL(더 낮은 저가) 수준 구축
피벗 수준 및 다중 지지/저항 수준 계산
강세(녹색) 및 약세(빨간색) 거래량의 색상 표시
모든 시간대에 적응하는 조정 기능
이 지표의 용도는 무엇인가요?
이 지표는 트레이더의 다음과 같은 과제를 해결합니다:
1. 축적 및 분배 영역 식별
거래량은 항상 큰 세력이 시장에 진입하거나 이탈하는 곳에 집중됩니다. POC는 최대 거래량이 발생한 가격을 보여줍니다. 이것은 심리적으로 중요한 수준입니다.
2. 공정 가치 탐색
PO

MT5용 암호화폐 외환 지표 "Major_Trend_Correction Histogram" (리페인트 없음) - Major_Trend_Correction Histogram 지표는 큰 추세를 감지하도록 설계되었습니다. - 지표는 두 가지 색상으로 표시됩니다. 빨간색은 하락 추세, 파란색은 상승 추세를 나타냅니다 (설정에서 색상 변경 가능). - 히스토그램의 10개 이상의 연속된 동일한 색상의 막대가 나타나면 새로운 추세의 시작을 의미합니다. - 모바일 및 PC 알림 기능이 내장되어 있습니다. - "Period" 매개변수는 지표의 민감도를 조절합니다. 매수 거래 시: 1) 히스토그램에서 10개 이상의 연속된 파란색 막대가 나타나는지 확인합니다. 이는 새로운 상승 추세의 시작을 의미합니다. 2) 그 후 1~2개의 반대되는 빨간색 막대가 나타나고, 이어서 주요 추세의 파란색 막대가 다시 나타나면 상승 추세 조정입니다. 3) 조정 후 매수 거래를 시작할 수 있습니다. 매도 거래 시 유의사항

MT5용 Crypto_Forex 지표 "확률 및 2개 이동 평균", 리페인트 불필요
- 스토캐스틱 오실레이터는 시중 최고의 지표 중 하나로, 많은 트레이더에게 이상적인 도구입니다. PC/Mobile alerts! - "확률 및 2개 이동 평균" 지표를 사용하면 스토캐스틱 오실레이터의 빠른 이동 평균과 느린 이동 평균을 확인할 수 있습니다. - 과매수 구간 - 80 이상, 과매도 구간 - 20 미만 - 80 이상 구간에서는 매도 진입, 20 미만 구간에서는 매수 진입이 유리합니다. - 매수 및 매도 진입 조건은 그림에서 확인할 수 있습니다. - 매수 신호 조건을 고려하세요. (1) - 빠른 이동 평균선이 과매도 구간에서 느린 이동 평균선을 상향 교차하는 경우: 매수 포지션을 개시합니다. (2) - 스토캐스틱 값이 과매수 구간에 있고 빠른 이동 평균선이 하향 교차하는 경우: 매수 포지션을 청산합니다. (3) - 매도 포지션의 경우 그 반대의 경우(그림 참조). 여기를 클릭하여 고

MT5용 Crypto_Forex 지표 "MFI 알림 기능" (리페인트 불필요)
- 자금흐름지수(MFI)는 가격과 거래량 데이터를 활용하여 과매도 및 과매수 구간을 파악하는 기술적 오실레이터입니다. - PC 및 모바일 기기 모두에 내장된 알림 기능을 통해 과매도/과매수 구간 진입 및 과매도/과매수 구간 청산을 지원합니다. - 알림 활성화를 위한 트리거 레벨 조정 가능. - MFI 오실레이터는 강세 및 약세 가격 모멘텀에 대한 정보를 제공합니다. - MFI가 80 이상이면 과매수 구간에서 매도 진입을, 20 미만이면 과매도 구간에서 매수 진입을 하는 것이 좋습니다. - MFI는 다이버전스 감지에 매우 유용하며, 가격 움직임과 함께 활용하기에도 좋습니다. - 모든 시간대에서 사용할 수 있는 지표입니다.
여기를 클릭하여 고품질 트레이딩 로봇과 지표를 확인하세요! MQL5 웹사이트에서만 제공되는 정품 제품입니다.

MACD Titanium은 MetaTrader 5용 Zero-Lag MACD 지표로, 기존 MACD보다 더 빠르고 명확한 모멘텀 신호를 제공합니다. Zero-Lag EMA 계산 방식을 사용하여 신호 지연을 줄이고 시장 모멘텀 변화에 더욱 빠르게 반응하면서도, 전통적인 MACD 구조를 유지합니다. 차별점 • Zero-Lag EMA 사용
• 모멘텀 변화에 빠른 반응
• 교차 지점을 명확히 표시
• 동적 배경 색상으로 현재 방향성 표시
• 모든 시간대와 종목에서 사용 가능 리페인트 없음.
모든 계산은 실시간 수행. 시각적 구조 아쿠아 라인 – MACD
오렌지 라인 – 시그널
녹색 점 – 상승 교차
빨간 점 – 하락 교차
배경 색상 – 현재 모멘텀 방향 녹색 = 상승 우세
빨간색 = 하락 우세 명확성을 중심으로 설계되었습니다. MACD Titanium Pro가 곧 출시됩니다 — 알림 기능, 멀티 타임프레임 분석 및 고급 다이버전스 감지 기능이 포함됩니다. MACD Titanium Trend
FREE

Pure Diamond Trend Exhaustion Pure Diamond Trend Exhaustion 지표는 시장의 추세 소진 구간과 잠재적 가격 반전 지점을 식별하기 위해 설계되었습니다. 핵심 알고리즘은 가격의 극점과 캔들 꼬리 구조 분석을 기반으로 하며, 기존의 지연성 보조지표를 사용하지 않고도 유의미한 과매수 및 과매도 수준을 포착합니다. 기술적 특징: 신호 재분석 없음 (No Repaint): 지표 신호(다이아몬드)는 현재 캔들이 마감되는 즉시 고정됩니다. 한 번 생성된 신호는 이후의 가격 변동에 따라 사라지거나 위치가 바뀌지 않습니다. 노이즈 필터링 알고리즘: 본 프로그램은 캔들의 몸통과 꼬리 비율을 분석하여 설정된 가격 범위 내의 거짓 파동을 필터링합니다. 범용성: 외환(Forex), 암호화폐, 지수, 원자재를 포함한 모든 자산군에 최적화되어 있으며, 모든 타임프레임에서 사용 가능합니다. 미니멀한 인터페이스: 시각화가 그래픽 심볼로 구현되어 트레이더의 작업 공간을 방

CRT Engine – Candle Range Theory Indicator MT5
MT4 Version
CRT Engine is an indicator based on the Candle Range Theory (CRT) concept. It is designed to display CRT-related elements on the chart in a structured and readable format. The indicator helps reduce manual chart marking by organizing key areas directly on the chart. Features CRT Buy and Sell setup indicationCRH and CRL levels Sweep and liquidity areas Higher timeframe CRT range Entry, Take Profit, and Stop Loss reference lines Risk zo

Bollibang!! master
The Ultimate Indicator: Bollinger Bands. Band walk is a powerful trend. Bollibang!! Master includes the Bollinger Band Width indicator. Please download the separate Bollibang!! Master Percent b file and install BB%b .
Overview
Sub-window 1 — Bollinger BandWidth
FREE

Bollibang!! master Percent b
The Ultimate Indicator: Bollinger Bands Bollibang!! master b includes Bollinger Band %b. It is an indicator for evaluating "band walks".
Overview Sub-window 1 — Bollinger BandWidth (BBW)
FREE

### Heikin Ashi Trend Indicator v2.1
TradingView에서 dman103이 공개한 Heikin Ashi Trend Indicator(2,300+ 좋아요, 80,000+ 조회)를 MQL5/MQL4로 포팅한 지표입니다. 헤이킨 아시 캔들 스무딩과 Tilson T3 이동평균을 결합하여 가격 차트에 노이즈가 제거된 트렌드 시그널을 표시합니다.
#### 작동 원리
지표는 두 단계로 데이터를 처리합니다. 먼저 일반 캔들스틱에서 Heikin Ashi OHLC 값을 계산합니다. 그 다음 Tilson T3 이동평균(사전 계산된 다항식 계수를 사용하는 6단 캐스케이드 EMA)을 HA의 Open, Close, High, Low 네 가지 구성요소에 적용합니다.
트렌드 방향은 스무딩된 값의 비교로 결정됩니다:
- **상승 추세:** T3(haClose) > T3(haOpen) — T3(haLow) 수준에서 가격 아래에 마커 또는 라인 표시 - **하락 추
FREE

MA Cloud PRO + Candle Color & Alerts The MA Cloud PRO is an advanced trend-following indicator for MetaTrader 5, designed for traders who demand maximum visual clarity and precision in identifying market cycles. It combines the power of two customizable Moving Averages with a high-fidelity cloud filling system and intelligent candle coloring. What does this indicator do? This indicator monitors the crossover of two Moving Averages (Fast and Slow) and fills the space between them with vibrant

Demo test with Demo account
NB: Ask for manual user and vip setting DigitopiaVolumeProfileV2 is a professional Anchored Volume Profile indicator for MetaTrader 5. Designed for institutional traders, it provides precise visualization of liquidity, value areas, and order flow. KEY FEATURES: Manually Anchored Profiles: Define your own analysis periods with draggable Start/End lines. Value Area (CME): Automatic calculation of POC, VAH, and VAL according to market standards. Delta Volume & True Ti

DoubleRSI — Dual RSI Crossover Indicator with Signal Filters Description DoubleRSI displays two RSI lines with configurable periods on a separate window and generates buy/sell signals based on crossovers between the two RSI lines within defined price zones. How it works A buy signal is generated when the short RSI crosses above the long RSI while the long RSI is within the configured buy zone (default 50-70). A sell signal is generated when the short RSI crosses below the long RSI while the long
FREE

# Smart Sweep Sniper MT5 Version What’s New in V.11 : Now with Automated Midnight Open (Broker GMT Sync) Midnight Pro Edition , specialized for scalping and day trading in Prop Firm, Available here ## The Institutional Edge — Detect Where Smart Money Acts, Enter When It Matters If you like it, leave a positive review to support its development. If you encounter a bug, let us know before posting a review. When you complete your challenge, share your certificate in the comments. Happy tra
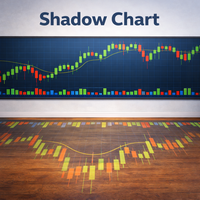
The Shadow Chart indicator is the advanced evolution of the Mirror Chart MT5. Rather than overlaying the second instrument directly onto the main chart with dynamic scaling, it renders it in a dedicated sub-window with its own independent price axis. The second symbol behaves exactly like a separately opened chart window — the scale is absolute and undistorted. The sub-window automatically adapts its display mode to match the main chart — candles, bars, or line — and inherits all color settings
FREE

TANIN RISK REWARD MT5 is the ultimate position calculation assistant for Price Action traders. If you love the flexibility of the Long/Short Position tool on TradingView, this indicator brings that exact, lightning-fast experience to your MetaTrader 5 terminal. Designed by Tanin Coder, this tool allows you to map out your Trade Entry, Stop Loss, and Take Profit visually on the chart with automatic Risk-Reward ratio recalculations. A professional, fast, and interactive drawing tool supporting Dyn
FREE

Advanced Volume Profile Liquidity Analysis via Custom Area Selection The Advanced Manual Volume Profile is a precision tool for MetaTrader 5 designed to deconstruct market structure through price-level volume analysis. Unlike static profiles, this indicator exclusively processes the price and time range defined by the user via a rectangle object, offering a surgical view of the market auction. Elite Technical Specifications Dynamic Algorithm: Real-time calculation (400ms refresh rate) based on t
FREE

Orynth P&F Chart Overlay – Clean Trend Visualizer Orynth is a professional technical analysis tool that brings the power of Point and Figure (P&F) charting directly onto your standard candlestick chart. It filters out market noise by focusing solely on meaningful price movement, allowing traders to identify clear trends and reversals without the distraction of minor fluctuations. Unlike traditional P&F charts that open in a separate window, Orynth overlays price "boxes" directly on your main cha

Like this indicator? Get the fully automated Expert Advisor version here: HalfTrend AutoTrader Pro
HalfTrend trendline with ATR pullback zones — built for trend traders.
Spot the trend direction instantly, use ATR bands to judge “normal” pullbacks vs extended moves, and get alerts on trend flips and optional trendline touches .
HalfTrend ATR Bands & Alerts (MT5) is a trend-following indicator that plots a clean HalfTrend trendline together with ATR-based bands/zones . It provides trend chan
FREE

Title: Smart VP: Buy/Sell Bars + POC Description:
Enhance your trading with the Right Anchored Volume Profile. Visualize buy and sell volumes per price level with near-bar numbers and identify the Point of Control (POC) instantly. Perfect for traders who want clear market structure at a glance. Features: Right Anchored Volume Profile Buy/Sell volume bars Near-bar volume numbers POC (Point of Control) line Customizable colors and display settings

SR Regression MT5 – Advanced Trend, Support/Resistance & MTF Sentiment Indicator SR Regression MT5 is a professional multi-functional trading indicator designed for traders who want to combine trend analysis, dynamic support/resistance detection, breakout signals and multi-timeframe sentiment confirmation in one powerful tool. What It Does Automatically draws Linear Regression Channels (small, medium, large trend periods) Detects and merges Support & Resistance levels Generates Buy/Sell break

30 Indicator Comment Center — Your Full Trading Desk on One Chart 30 Indicator Comment Center turns your MetaTrader 5 chart into a complete confluence-trading workstation. Instead of stacking a dozen separate indicators and guessing how they agree, this tool runs 30 professional-grade technical engines simultaneously , blends them into a single live verdict, and presents everything through a clean, modern six-page interface — built right on your chart. No more switching windows. No more mental

Precision Strike Arrows is a precision signal indicator for MetaTrader 5 built on the Momentum concept. It detects periods of market compression and fires a single clean arrow on the chart when momentum shifts direction, keeping your chart clear and your focus sharp. Most arrow indicators paint signals on every minor fluctuation. Precision Strike Arrows is designed to do the opposite. It waits for the market to coil, identifies the moment momentum commits to a direction, and plots one decisive a
FREE
MetaTrader 마켓은 개발자들이 거래 애플리케이션을 판매할 수 있는 간단하고 편리한 사이트이다.
제품을 게시하고 마켓용 제품 설명을 어떻게 준비하는가를 설명하는 데 도움이 됩니다. 마켓의 모든 애플리케이션은 암호화로 보호되며 구매자의 컴퓨터에서만 실행할 수 있습니다. 불법 복제는 불가능합니다.
