 MetaTrader 5
 Experts
 지표
지표
 라이브러리
라이브러리
 유틸리티
유틸리티
 위젯
위젯
 규칙
규칙
MetaTrader 5용 새 기술 지표 - 167
 기술 지표의 시그널은 주식 및 외환 시장에서 거래를 개시 및 종료하는 데 중요한 역할을 합니다. 지표의 본질은 미래의 가격 변화를 예측하기 위한 금융 시그널 값의 수학적 변형입니다.
기술 지표를 테스트하여 시장 행동과 그로 인한 이익을 더 잘 예측할 수 있습니다.
기술 지표의 시그널은 주식 및 외환 시장에서 거래를 개시 및 종료하는 데 중요한 역할을 합니다. 지표의 본질은 미래의 가격 변화를 예측하기 위한 금융 시그널 값의 수학적 변형입니다.
기술 지표를 테스트하여 시장 행동과 그로 인한 이익을 더 잘 예측할 수 있습니다. 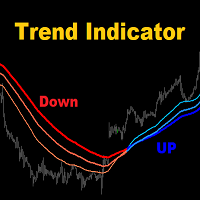
MA3 Trend MT5 - is the good trend indicator on three MAs . Benefits of the indicator: The indicator produces signals with high accuracy.
The confirmed signal of the indicator does not disappear and is not redrawn.
You can trade on the MetaTrader 5 trading platform of any broker.
You can trade any assets (currencies, metals, cryptocurrencies, stocks, indices etc.).
You can trade on any timeframes (M5-M15 scalping and day trading / M30-H1 medium-term trading / H4-D1 long-term trading). Indi
FREE

Your search for a perfectly simple ICT Killzone indicator for MT5 is now over because here it is. If you trade ICT concepts, then you know what ICT Killzones are. ICT Killzones (by default is adjusted to EST New York Time, no recalibrating to your timezone needed. Just load it onto your chart and you're good to go): Asian Open Killzone (06:00PM - 12:00AM EST New York Time) London Open Killzone (02:00AM - 05:00AM EST New York Time ) New York Open Killzone (07:00AM - 9:00AM EST New York Time )
Introduction to the Magic TD Sequential 9
The "Magic TD 9" is a technical analysis tool for stocks. It is based on historical price data and divides prices into nine levels based on a certain magnitude. It then calculates the average price of each level and constructs a sequence of nine data points. This sequence is called the "Magic TD 9," with the first data point representing the stock's lowest price and the ninth data point representing the highest price.
Index inputs:
1 Turns: represen
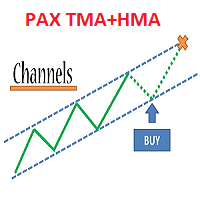
Trade system "PAX Multi TMA/HMA 8" for MT5
It is a ready-made trading system for trading on any instrument and any timeframe.
Completely ready for manual trading and use in robots.
Not redrawn signals ( See the picture )
It is convenient to work on any timeframe.
Tested on metals, currency pairs, oil, international stocks, Russian stocks, cryptocurrencies, monetary and cryptocurrency indices.
What the trading system consists of:
1. The main channel of price movement named Medina. May b

The US Dollar Index on your chart, built live from your own broker's six currency pairs. The dollar index is the cleanest read there is on whether the dollar itself is moving, or whether it is the other side of your pair doing the work. When EURUSD falls you cannot tell from EURUSD alone whether the euro is weak or the dollar is strong. The index tells you. Put it under any chart and you are looking at the dollar on its own terms. It replicates the ICE US Dollar Index, widely quoted as DXY. Same
FREE
This is MT5 version of StochScanner It scans Stochastic from Multi Symbols and Multi Timeframes and displayed on the dashboard on a single chart. . 4 scanning modes: 1. Mode OverBought/OverSold Indicator scans Overbought and OverSold . OverBought : current stochastic is above level 80 and OverSold : current stochastic is below level 20 2. Mode Signal It means if the previous stochastic is on OverBought or OverSold ( either Main Line and Signal Line ) and the current Main Line cross over the curr

This indicator automatically draws horizontal lines at 00s, 20s, 50s and 80s levels. If you trade ICT concepts and are an ICT Student, then you know that these levels are used as institutional support/resistance levels and/or fibonacci retracement anchor points. Features
Draws horizontal lines at 00, 20, 50 and 80 levels above and below current market price . Choose the amount of levels to show on chart Customizable line colors Recommended for forex currency pairs. Saves time looking for thes
FREE
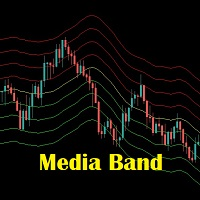
Media Band é um indicador que projeta 8 bandas paralelas a uma media movel de referencia. Podendo auxiliar na visualização da volatilidade do mercado financeiro. Este indicador foi inspirado na necessidade de avaliar melhor uma boa oportunidade de compra e venda dos ativos de acordo com o "seu" operacional. Não pode ser utilizado como recomendação e sim a fins de estudos do Mercado Financeiro.
FREE
The Bounce strength indicator (BSI) for meta trader 5 illustrates the strength of the market bounce. The +10 and -10 extreme bounds are used by the indicator. The blue bars show a bullish bounce, while the pink bars show a bearish bounce. The indicator, in essence, depicts market volatility for both up and down moves. When utilized appropriately, the indicator performs equally well on all currency pairs and produces encouraging returns.

The Advanced Pivot Point Indicator is a powerful tool designed to help traders identify key support and resistance levels in the market. This versatile indicator offers a customizable and user-friendly interface, allowing traders to select from five different pivot point calculation methods: Floor, Woodie, Camarilla, Tom DeMark, and Fibonacci. With its easy-to-read lines for pivot points (PP), support (S1, S2, S3, S4), and resistance (R1, R2, R3, R4) levels, the Advanced Pivot Point Indicator pr
FREE
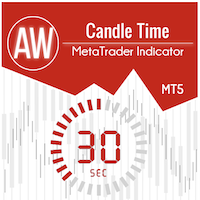
촛불이 끝날 때까지의 시간 표시기. 촛불이 끝날 때까지의 시간과 서버 시간을 표시합니다. 텍스트는 캔들의 추세 또는 방향을 표시할 수 있으며 소리 알림이 내장되어 있습니다. 특징:
필요한 경우 조정하거나 비활성화할 수 있는 다른 시간 프레임뿐만 아니라 현재 캔들이 끝날 때까지의 시간을 표시합니다. AW 캔들 타임은 AW Super Trend 지표로 현재 캔들 또는 추세의 방향을 선택할 수 있습니다. 추세 전략은 선택한 색상으로 강조 표시됩니다. 내장형 소리 알림 및 캔들 교체 전 시간 추가 컬러링 디스플레이는 현재 가격 옆이나 차트의 모든 모서리에 구성할 수 있으며 입력 설정에서 유연하게 조정할 수 있습니다. Instruction -> 여기 / 더 많은 제품 -> 여기 입력 변수:
기본 Candle_Time_Location - 캔들 타임스탬프의 위치입니다. 차트의 모서리 또는 현재 가격 옆에 위치할 수 있습니다. Trend_Strategy - 컬러 캔들 타임스탬프를 사용합니다
FREE
O WA Order Block FVG bos MT5 é um indicador com base no estudo de SMC (Smart Money Concepts) criado pelo ICT Inner Circle Trader, eleplota no seu gráfico as informações de Order Blocks em 3 tempos gráficos diferentes, fair Value Gaps e Regiões de Liquidez além do BOS ( Break os Structures), tudo em um só indicador. Dessa forma você não precisa colocar essas informações de forma manual. Agora você tem tudo isso de forma automática em seu gráfico.

Auto Fibonacci Retracement Indicator — Flexible and Reliable This isn’t just another Auto Fibonacci Retracement indicator. It’s one of the most flexible and dependable tools available . If you find it useful, please consider leaving a review or comment — your feedback means a lot! Check out my other helpful tools below: Telegram to MT5 using AI - AI-Powered Signal Copier Bot Smart Alert Manager - Set up advanced alerts and send them to Mobile, Telegram, Discord, Webhook...
Timeframes Trend
FREE

고정밀 거래 및 전체 시장을 위해 설계된 슬리피지 분석 라이브 또는 데모 계정 모두에서 이익 실현 및 손절로 모든 포지션을 분석하여 브로커의 슬리피지를 분석할 수 있습니다.
내 다른 개발은 여기에서 볼 수 있습니다
모든 것을 정확하게 식별할 수 있도록 모든 포지션을 이익실현 및 손절매와 함께 사용하는 것이 좋습니다.
도움이 필요하면 구매 후 즉시 저에게 연락하십시오
여러 번 우리는 슬라이딩 옵션이 있고 무엇을 배치해야할지 모릅니다. 자 이제 좋아하는 브로커에서 시장 슬라이드를 분석하고 분석한 시간에 따라 최적의 구성을 사용할 수 있습니다. 일별, 주별, 월별, 연도 등으로 분석할 수 있습니다.
수신 매개변수 -
3가지 고급 구성이 있습니다. - 구성 모드 1회 분석 - 구성 모드 2 평균화 모드 - 구성 모드 3 슬리피지 분석
FREE

Little Hanzel is t he best spike Detector, the indicator is made for trading Boom and Crash using the 1 min timeframe.It use levels on the 1 min timeframe to detect spikes.A horizontal line(order level) will appear on all the buying levels for on Boom and selling level, horizontal line will also appear on Crash. Join mql5 Little Hanzel channel https://www.mql5.com/en/channels/littlehanzel Input section: Choose Boom for the Boom indices (Boom 1000, Boom 500,and Boom 300 ) Choose Crash for t

Multi-timeframe trend indicator based on the ADX / ADXWilder indicator with Fibonacci levels
The indicator shows trend areas using ADX or ADXWilder indicator data from multiple timeframes. The impulse mode of the indicator allows you to catch the beginning of a trend, and several "Screens" with different timeframes allow you to filter out market noise. Fibonacci levels are added to the price chart, which have flexible settings.
How the indicator works: if PDI is greater than NDI, then it`s
FREE

Finally a Metatrader version of the very popular (and expensive) Market Cipher B indicator, or the Vumanchu Cipher B + Divergences very popular on Tradingview platform.
This tool is very heavy on calculations, total are 31 plots using 97 buffers from several indicators. On my mid end computer, timeframes below M15 start getting a bit laggy, so it would require a powerful computer to run it properly at very low timeframes. It's still usable here, but somewhat sluggish response in Metatrader (lik
FREE

Multi-timeframe trend indicator, based on the ADX / ADXWilder indicator The indicator shows trend areas using ADX or ADXWilder indicator data from multiple timeframes. The impulse mode of the indicator allows you to catch the beginning of a trend, and several "Screens" with different timeframes allow you to filter out market noise.
How the indicator works: if PDI is greater than NDI, then it`s bullish movement; if PDI is less than NDI, then it`s bearish movement; to determine any trend, it is
FREE
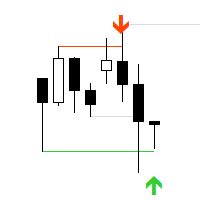
"AV Stop Hunter MT5" is an indicator for MetaTrader 5, which draws entry arrows for long and short after so-called Stop Hunt candles and has several notifications about them. Since this is a smart money concept , the periods H1 and H4 are the best. Increasing volume improves the signal, lines and arrows are then thicker. The MQL5 variant has colored stop-hunting candles. NEW: Signal Buffer: 1, 0 or -1
Definition :
Stop hunting, also known as stop running, is the practice of institutional trad

This indicator is an automated version of the Fibonacci retracement (Fib) indicator. Deciding the best areas to use when drawing the fib can be tricky and this indicator was made with that in mind. When you drop it on the chart it will automatically choose the best points to draw the fib with, but in case you aren't satisfied with those regions, you can adjust it as you wish.
FREE

This indicator will show you the average entry price for positions, pending orders and both, every side and every type has an different color; It will also show you actual risk, pending risk, both sum and for both sides and the sum of both; you can configure Day, Week, Month and Year Financial Risk to show you if you are close to it; it shows the risk return of each side and both sides too, based on risk and profit for actual position and pending orders
FREE
The fact that round number levels have a significant influence on the market cannot be denied and should not be overlooked. These psychological levels are used by both retail Forex traders and major banks that deal in Forex. Very simple and effective indicator and most importantly free. ////////////////////////////////////////////////////////////////////////////////////////////////////////////////////////////////////////////////////////////// The program does not work in the strategy tester.
FREE
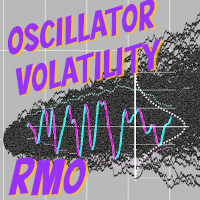
The Returns Momentum Oscillator (RMO) shows the difference of exponentially weighted volatility. It is used to find market tops and bottoms. Volatility comes in waves, and as the Returns often front run price action it gives directional prediction of market movement. The Oscillator signal is RMSed (root mean squared) to make the distribution closer to Gaussian distribution. While the traditional RSI indicators are often stuck in overbought or oversold areas for a long time, RMSing of the sign
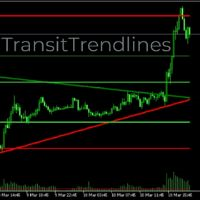
TransitTrendlines this is a automatically trendline drawer, it draw both horizontal and diagonal trendlines. The horizontal trendlines are the pivot points of the day timeframe and the diagonal trendlines are based on the current time frames. You can adjust the diagonal trendlines by increasing the number of bars to draw the diagonal trendline and can also adjust the steepness. Note that the Horizontal trendlines are based on the day pivot points not currant time frame. Join mql5 transitbk98 cha
FREE

Count on our trend tracker to carry out your operations!
Operational Green is BUY and Pink is SELL! Enter the operation after closing the first color block!
Developed and Tested on the 5 or 15 minute Chart for Mini Index and Mini Dollar!
Can be used on any chart!
Editable colors and period!
“All strategies and investments involve risk of loss. No information contained in this channel should be interpreted as a guarantee of results or investment recommendation!”
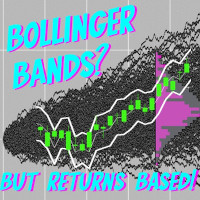
Bollinger Bands based on Returns This indicator characterizes the price and volatility by providing a channel/band of standard deviations like the Bollinger Bands. In contrary to standard Bollinger Bands which uses price directly, this indicator uses returns due to normalization. The standard Bollinger Bands based on price directly, were one of the first quant or statistical methods for retail traders available. The issue with these bands, standard deviations can only be calculated, if the u

This creative simple indicator will provide a precise framework for market sentiment within technical analysis of different timeframes. For instance, for traders like me that uses "Mark Fisher" strategy regularly, this is a perfect indicator for having an insight to markets from short term to long term point of view, using Break points of candles' lows and highs and perfect to combine with "Price Action" . For more options and modifications you can also edit the low timeframe candles withi
FREE
The indicator is getting the four most important trading sessions: New York London Sydney
Tokyo The indicator auto calculate the GMT time. The indicator has buffers that can be used to get the current session and the GMT.
You can use it as stand alone indicator and you can turn the draw off and call it from your EA. INPUTS Max Day: Max days back to get/draw. London Session On: Show/Hide London Session. New York Session On: Show/Hide New York Session. Sydney Session On: Show/Hide Sydney Session
FREE
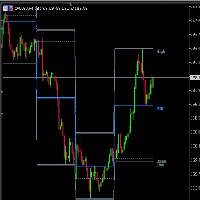
OHLC Volume Histogram displays the difference between two streams of the OHLC Volume volume indicator as a colored histogram. There are no input parameters. Calculation: Histogram = StreamUP - StreamDN where: StreamUP = Volume * UP_Coeff / (UP_Coeff+DN_Coeff) StreamDN = Volume * DN_Coeff / (UP_Coeff+DN_Coeff) UP_Coeff = High-Open DN_Coeff = Close-Low Volume - tick volume
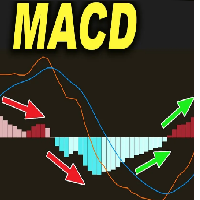
What Is Moving Average Convergence/Divergence (MACD)? Moving average convergence/divergence (MACD, or MAC-D) is a trend-following momentum indicator that shows the relationship between two exponential moving averages (EMAs) of a security’s price. The MACD line is calculated by subtracting the 26-period EMA from the 12-period EMA. The result of that calculation is the MACD line. A nine-day EMA of the MACD line is called the signal line, which is then plotted on top of the MACD line,
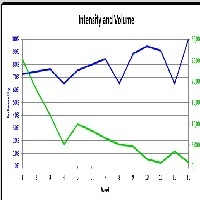
“Multi timeframe Slow Volume Strength Index” shows data of three SVSI indicators from different timeframes on the current chart. The indicator has nine adjustable parameters: EMA period – EMA SVSI calculation period Smoothing – SVSI smoothing period Overbought – overbought level Middle – middle line Oversold – oversold level Drawing mode – indicator drawing type Steps – as a ladder Slope – sloping lines First SVSI timeframe – the timeframe of the first SVSI Second SVSI timeframe – th
Se você está procurando uma maneira de melhorar seus resultados de negociação, então o indicador VWAPiEagleVision é o que você precisa! Este robô é programado para rastrear o VWAP em tempo real e usar essas informações para identificar tendências e oportunidades de negociação lucrativas.
O VWAP (Volume Weighted Average Price) é um indicador amplamente utilizado pelos traders para determinar o preço médio ponderado pelo volume negociado. Ele é comumente usado por traders institucionais e pode
FREE

Automatically detect bullish or bearish order blocks to optimize your trade entries with our powerful indicator. Ideal for traders following ICT (The Inner Circle Trader). Works with any asset type, including cryptocurrencies, stocks, and forex. Displays order blocks on multiple timeframes, from M2 to W1. Alerts you when an order block is detected, migrated, or a higher timeframe order block is created/migrated. Perfect for both scalping and swing trading. Enhanced by strong VSA (Volume Spread A
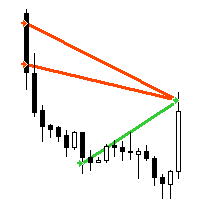
"AV Trade History MT5" is an indicator for MetaTrader 5, which similar to the "Trade History" or "Show trade history" setting, shows the closed trades on the chart. It also shows the orders history in the strategy tester, makes it easier to see them when testing expert advisors automated trading.
Improvements :
- Visibility is increased by line thickness and free choice of color.
- Additional information about the trade is visible when hovering over it, e.g. ticket, magic, comment, direction
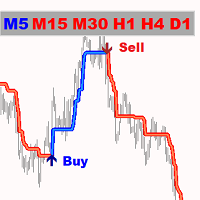
골드 포인터는 최고의 추세 지표입니다. 지표의 고유한 알고리즘은 기술적 및 수학적 분석 요소를 고려하여 자산 가격의 움직임을 분석하고 가장 수익성이 높은 진입 지점을 결정하고 매수 또는 매도 주문을 개시하라는 신호를 제공합니다.
최고의 보조지표 신호:
- 매도 = 빨간색 추세선 + 빨간색 TF 표시기 + 같은 방향의 노란색 신호 화살표. - 매수 = 파란색 추세선 + 파란색 TF 인디케이터 + 같은 방향의 아쿠아 신호 화살표.
인디케이터의 장점:
1. 표시기는 높은 정확도로 신호를 생성합니다. 2. 표시기의 확인 된 신호는 오디오 경고 (경고 및 메시지)로 신호 (화살표)를 확인한 후에도 사라지지 않고 다시 그려지지 않습니다. 3. 모든 브로커의 메타트레이더 5 거래 플랫폼에서 거래할 수 있습니다. 4. 모든 자산(통화, 금속, 암호화폐, 주식, 지수 등)을 거래할 수 있습니다. 5. 모든 차트주기(M5-M15 스캘핑 및 트레이딩/M30-N1 중기 트레이딩/H4-D1 장기
"Scalper Channel MT5" is a modern channel indicator that shows the trader the direction of the trade. For work, the indicator uses built-in and proprietary technical means and a new secret formula. Load it on the chart and the indicator will show you the entry direction in color:
If the upper limit of the price channel of the indicator is blue, open a buy position. If the lower limit of the price channel of the indicator is red, open a sell position. If the border of the indicator is gray, neut

This indicator is suitable for trading on the pair and many others. The indicator itself uses universal calculations of additional accuracy, but so far they are optimized for some currency pairs. Many settings can be configured on the main menu. He displays his calculations on the graph in the form of icons. There are two types of icons. In the tester, it works fine by default in the settings. You can specify a color for its icons. There is a panel. Happy trading.
[ MT4 Version ] [ Kill Zones ] [ SMT Divergences ] Order Blocks ICT Multi TF - FVG-Confirmed Order Blocks for MT5 Most ICT order block indicators for MT5 turn every opposite candle into an order block. The chart fills up and the label stops meaning anything. Order Blocks ICT Multi TF uses Fair Value Gap confirmation and monitors up to four timeframes from one chart. It is built for traders who want a defined reason for the block, not another coloured rectangle. GIVE THE BLOCK A REASON TO MATTE

Trend indicator based on the ADX / ADXWilder indicator
The indicator shows trend areas using ADX or ADXWilder indicator data.
How the indicator works: if PDI is greater than NDI, then it`s bullish movement; if PDI is less than NDI, then it`s bearish movement; if ADX is less than or equal to the filter value specified in the parameters, then there is no movement state.
Input parameters of the indicator: Calculate Timeframe - timeframe for calculation; ADX Type - type of ADX calculation based
FREE

The Advanced Momentum Trend indicator is an indicator used to determine trend directions. It determines the trends by considering many factors while calculating the trend. You can use this indicator as a trend indicator or in combination with other indicators that suit your strategy. You can also use it as a stand-alone trend filtering. Thanks to the alert feature, you can instantly learn about the new trends. To View Our Other Products Go to the link: Other Products
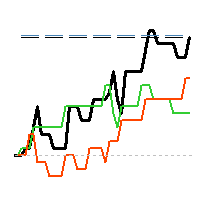
"AV Monitor MT5" is an indicator for MetaTrader 5, which alowes a history analysis of the closed orders. It helps to achieve a quick visual analysis of your own trading or different expert advisors among themselves. Compare and analyze your expert advisors: Which one is the best?
I use an "AV Monitor MT5" indicator per running expert advisor chart to track its performance split into long & short, as well as an index chart e.g. DOW with this indicator and the setting "Show Balance & Equity" to t
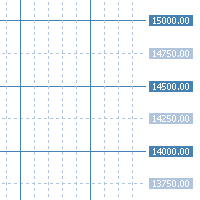
"AV Grid MT5" is an indicator for MetaTrader 5, which automatically displays round numbers as horizontal lines and a sensible period separation .
Round prices can be used as support and resistance in trading.
It is an improvement on the "Grid" setting, which also draws a grid on the chart.
Improvements :
- Round levels instead of arbitrary positioning of the horizontals
- Structure by highlighting all x lines (main lines, 2 or 5 makes sense)
- Vertical lines are each in two periods (main
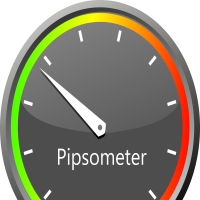
Pipsometer is an elegant, real-time panel indicator for MT5 that instantly shows you both your cumulative money and pip gain/loss and total trades executed on the current chart. It dynamically changes its display color—green for net profit and red for net loss—so you can gauge performance at a glance without opening reports or scrolling through trade history.
FREE

Shows min and max of last M5 Candle. Can be used to trade breakouts of last M5 candle. The M5 Candle Breakout Strategy avoids to stay too long in a sindways phase. See documentation on @swisstrader3713, where you can follow my live trading. The only parameters are the color of the lines defining the M5 stretch. Best use the indicator in M1 timeframe. The M5 Breakout Strategy has helped me to reduce overtrading.
FREE

*Used by MeditionSeed EA. Meditation is a practice in which an individual uses a technique – such as mindfulness, or focusing the mind on a particular object, thought, or activity – to train attention and awareness, and achieve a mentally clear and emotionally calm and stable state.[1][2][3][4][web 1][web 2] Plant a Meditation Seed to have wonderful future.
FREE

*Used by MeditionSeed EA. Meditation is a practice in which an individual uses a technique – such as mindfulness, or focusing the mind on a particular object, thought, or activity – to train attention and awareness, and achieve a mentally clear and emotionally calm and stable state.[1][2][3][4][web 1][web 2] Plant a Meditation Seed to have wonderful future.
FREE

*Used by MeditionSeed EA. Meditation is a practice in which an individual uses a technique – such as mindfulness, or focusing the mind on a particular object, thought, or activity – to train attention and awareness, and achieve a mentally clear and emotionally calm and stable state.[1][2][3][4][web 1][web 2] Plant a Meditation Seed to have wonderful future.
FREE
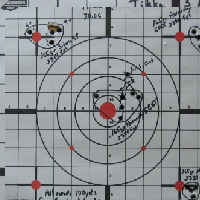
The Intra Daily Range Projection indicator forecasts the current day’s price range on the basis of the previous day data. All calculations are based on the book “New Science of Technical Analysis” by Thomas R. DeMark.
When you're analyzing investments, the trading range is a valuable analytical tool. The average trading range is the average distance between the high and the low over a specified period of time. You can calculate the average high-low range on a piece of paper, a spreadsheet, or
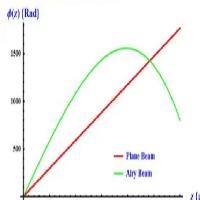
Phase accumulation adaptive bandpass filter MT5 Indicator is a Metatrader 5 (MT5) indicator and the essence of this technical indicator is to transform the accumulated history data. Phase accumulation adaptive bandpass filter MT5 Indicator provides for an opportunity to detect various peculiarities and patterns in price dynamics which are invisible to the naked eye. Based on this information, traders can assume further price movement and adjust their strategy accordingly.
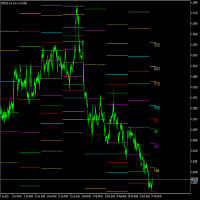
Fibonacci Pivots is a multi-timeframe indicator with custom alerts, designed to help traders easily identify key levels of support and resistance on any financial instrument. This advanced indicator uses the popular Fibonacci sequence to calculate pivot points based on the specified timeframe, depth, and backstep parameters. It also comes with customizable alerts. You can choose to be alerted when the price crosses any of the pivot points or when the price is within a specified frequency and pi

Correlation indicator is a trading indicator that compares price correlations on up to 8 different instruments simultaneously. This indicator is designed to be very versatile. It can be used to trade many different strategies from scalping to hedging to simple trend-following based on an average trend direction of multiple currency pairs or it can signal only when all the pairs correlate on the same side of a particular moving average. The indicator automatically applies the same moving average
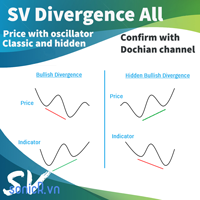
Detect divergence (classic, hidden) price and all oscillator indicator include: RSI, CCI, MACD, OSMA, Stochastic, Momentum, Awesome Oscillator (AO), Accelerator Oscillator (AC), Williams Percent Range (WPR), Relative Vigor Index (RVI), Rate of Change (ROC). Confirm reversal with dochian channel for to improve signal quality. Divergence is when the price of an asset is moving in the opposite direction of a technical indicator , such as an oscillator, or is moving contrary to other data. Diverge
HiLo Trend Matrix is an advanced multi-timeframe trend indicator that scans and analyzes multiple timeframes to determine the overall trend direction, allowing you to effortlessly ride the trend waves as they emerge. By scanning the four higher timeframes, starting from your current timeframe or a selected one from the input parameters, you'll always have a comprehensive view of the market's movements. And when the trend aligns, the HiLo Trend Matrix delivers an alert, so you can seize the oppo

This indicator closes the positions when Profit. This way you can achieve a goal without determine Take Profit.
Parameters: Profit: the amount of Dolllars you want to close when profit.
Just determine Profit section and open new positions. If Any of your positions reaches above Profit , Indicator will close automatically and you will recieve your Profit.
FREE
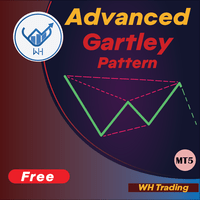
고급 Gartley 패턴 인식 표시기에 오신 것을 환영합니다. 이 지표는 가격 구조의 HH 및 LL과 피보나치 수준을 기반으로 가틀리 패턴을 감지하고 특정 fib 수준이 충족되면 지표가 차트에 패턴을 표시합니다. MT4 버전 : WH Advanced Gartley Pattern MT4 **이 표시기는 모든 패턴 인식을 포함하는 콤보 Ultimate Harmonic Patterns MT5 의 일부입니다.**
특징 : 높은 정확도 로 Gartley 패턴을 감지하는 고급 알고리즘. 매우 빠르고 리소스가 적습니다 (머신에 대한 요구가 적음). 지연 이나 다시 그리기가 없습니다. 사용자 정의 Fib 수준 조정(선호하는 설정에 따라 피보나치 수준을 변경할 수 있음) 약세 및 강세 패턴을 동시에 표시합니다(약세 또는 강세 설정에 대해 여러 패턴을 표시하는 기능 포함). 거래 수준 라인을 표시합니다(조정 가능한 중지 및 목표
FREE
나만의 촛대 패턴을 정의하면 이 패턴이 나타날 때 이 지표가 화면에 표시됩니다 Strategy Tester에서 무료로 테스트하고 선택한 자산에 캔들스틱 패턴이 몇 번 나타나는지 확인할 수 있습니다. 패턴의 양초를 모두 칠하거나 하나만 칠할 수도 있습니다 이 지표는 캔들스틱 분석에 유용하며, 가격 조치 및 적나라한 거래 전략에 사용할 수 있습니다. 선택한 움직임을 나타내는 지표입니다
naman-ui chosdae paeteon-eul jeong-uihamyeon i paeteon-i natanal ttae i jipyoga hwamyeon-e pyosidoebnida Strategy Testereseo mulyolo teseuteuhago seontaeghan jasan-e kaendeulseutig paeteon-i myeoch beon natananeunji hwag-inhal su issseubnida. paeteon-ui yangcholeul modu chilhageona

FREE
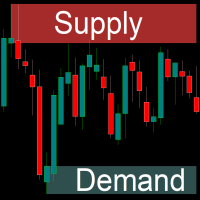
The indicator draws supply and demand zones. The zone timeframe can be set independently of the chart timeframe. For instance, it is possible to set M5 zones on an H4 chart. The importance of zones can be adjusted using the zone strength parameter. Demand zones are displayed if at least one candle in the range of the zone is entirely above the zone. Similarly, supply zones are displayed if at least one candle within the zone is entirely below the zone.
Unlike many other indicators including the moving average indicator, Pivot Point can be a leading indicator. In these systems, the price levels of the previous period are used to determine the critical points instead of relying on the current price performance. Such an approach provides a clear framework for traders to plan their trades in the best possible way.
You can use this method and its combination with the methods you want to build and use a powerful trading setup. MT4 version
Let us kno
FREE

The Universal Trend indicator was created to detect trends in price movement and allows you to quickly determine not only the direction of the trend, but also understand the levels of interaction between buyers and sellers. The indicator works on all timeframes and currency pairs. The indicator gives fairly accurate signals and it is customary to use it both in trending and flat markets. It is advisable to use the indicator in combination with other tools for more reliable signals and making a
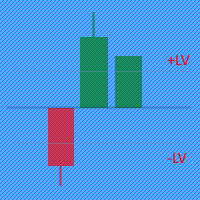
The Price Movement Strength indicator displays the direction and strength of the price change in the form of a candle on each price bar. If the indicator shows the closing level of the candle equal to zero on the current bar, then the price has not changed during bar. If the indicator shows a green candle, then the price of the trading instrument is growing, and vice versa, a red candle signals a price fall. Input parameters: The indicator has two parameters for setting buy/sell levels: BuyLevel

Máquina Trader Tendência Count on our trend tracker to carry out your operations on the Mini Index and the Mini Dollar!!! Operational Green is BUY and Pink is SELL!!! Enter the operation after closing the first color block!!! Developed and Tested on the 5 or 15 minute Chart for Mini Index and Mini Dollar!!! Can be used on any chart!!! Editable colors and period!!!
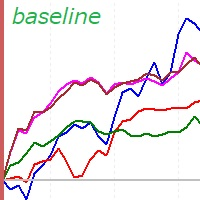
This is a rate of change chart from the baseline. features. comparison of max 5 symbols. free baseline with drag. free timeframes of the sub window. reverse chart selectable if you need.
i.e. set symbols "-US100" notes In the sub window, you can't believe datetime on the chart, because the numbers of bars are different. You can check the baseline if you click symbol name. The dragged baseline is temporary. You must set it to indicator's parameter if you need.
FREE
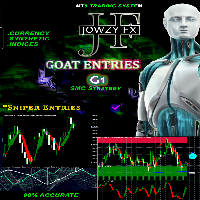
Jowzy Fx G1 is the indicator designed to detect swings in the direction of the trend and possible reversal swings. The indicator studies several price and time vectors to track the aggregate trend direction and detects situations in which the market is oversold or overbought and ready to correct. This indicator shows Swing that is a strong hint for an excellent entry point and finds immediately with alarm and notification and also has stop loss and entry point with candlestick checking for eas
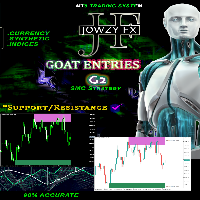
Jowzy Fx G2 support or resistance levels are formed when a market’s price action reverses and changes direction, leaving behind a peak or trough (swing point) in the market. Support and resistance levels can carve out trading ranges. The indicator identifies the Swing High and Swing Low based on X amount of bars ( Period ) defined in the indicator set.
Main Features: Detect the best and most successful point of trend or reversal trend
Easy-to-use and user-friendly indicator NO repaint Scan
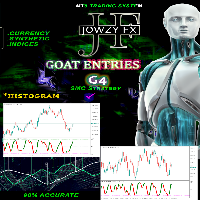
Jowzy Fx G4 indicator is a universal tool, suitable for scalping and medium-term trading. This indicator uses an innovative formula and allows you to determine the direction and strength of the trend. is not redrawn, so you can evaluate its efficiency using history data. suitable for M5, M15, M30, H1 and H4 is perfect for all Meta Trader symbols: currencies, metals, cryptocurrencies, stocks and indices
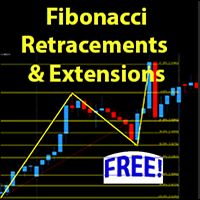
This indicator allows you to measure retracements of price between any two points in either direction. It displays the price points, percentages and also displays the extension levels.
User may Modify and Add addition levels and extensions." User may also Add multiple Fibonacci indicators on the chart and change their colors, style and sizes.
Can be used on any timeframe.
This is the only Fibonacci Tool you'll need to measure and trade on Structure.
MT4 Version Available as well.
ADDITIONA
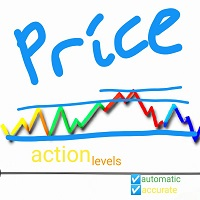
Accurate horizontal support and resistance levels Accurate for price action analysis. All Markets: forex, stocks, indices, metals, commodities ,and crypto Available for meta trader 5 Adjustable parameters I think that's it inputs: For multiple timeframe analysis: adjust "analysis_timeframe" accordingly "depth_of_retrenchments" represents how big the peaks or troughs are. "lookback " represents the most recent number of candlesticks to consider "linecolor " is the color of the lines "linewei
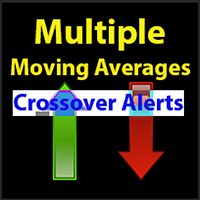
This indicator will identify when Fast Moving Averages (EMA, SMA, or LW) cross Slow Moving Average lines on any timeframe and with any symbol.
When the moving averages cross and price close above or below the crossing, the User will receive an alert via pop-up, push, or email.
Choose any two Moving Averages to cross to receive an alert and the Indicator will also paint the Moving Average Lines and Arrows.
You can choose Exponential Moving Averages (EMA). Simple Moving Averages (SMA) or Linear
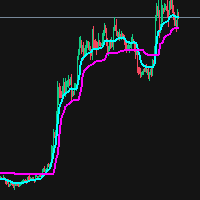
Optimized Trend Tracker OTT is an indicator that provides traders to find an existing trend or in another words to ser which side of the current trend we are on.
We are under the effect of the uptrend in cases where the prices are above OTT ,
under the influence of a downward trend, when prices are below OTT
it is possible to say that we are.
The first parameter in the OTT indicator set by the two parameters is the period/length.
OTT will be much sensitive to trend movements if it is sma
MetaTrader 플랫폼 어플리케이션 스토어에서 MetaTrader 마켓에서 트레이딩 로봇을 구매하는 방법에 대해 알아 보십시오.
MQL5.community 결제 시스템은 페이팔, 은행 카드 및 인기 결제 시스템을 통한 거래를 지원합니다. 더 나은 고객 경험을 위해 구입하시기 전에 거래 로봇을 테스트하시는 것을 권장합니다.
