 MetaTrader 5
 Experts
 지표
 라이브러리
 유틸리티
 위젯
 규칙
MetaTrader 5용 무료 Expert Advisor 및 지표 - 119
 트레이딩 로봇과 지표를 사용하여 외환 거래를 더 수익성 있게 만들 수 있습니다. 트레이딩용 로봇을 사용하면 개점 및 폐점 거래를 자동화할 수 있으며, 지표는 시장 행동을 보다 정확하게 예측할 수 있습니다.
이 페이지에는 MetaTrader 5 응용 프로그램의 카탈로그가 나와 있습니다.

MT5 Tick History Sync – Real Tick Downloader, History Verification & Data Export Download. Synchronize. Verify. Export. Make Every Backtest Count. Are you confident that your MetaTrader 5 backtests are using complete real tick history? Missing historical ticks can compromise the reliability of your backtesting results, especially when testing scalping strategies, high-frequency trading systems, and Expert Advisors that depend on precise price movements. MT5 Tick History Sync by Zistilo is a prof
FREE

The simplest and most useful trading panel for every manual trader!
Are you tired of closing trades one by one during news? Do you want to protect your profit with one click?
This panel does exactly that:
CLOSE ALL - Instantly closes ALL open positions with one click. You can choose to close all symbols or only current symbol. Essential for scalpers and news traders.
BREAKEVEN ALL - Instantly moves Stop Loss to entry price (breakeven) for all profitable trades. Protect your profits and
FREE

UEX Reader - Expert Advisor UEX 지표 기반의 완전 자동 트레이딩 EA입니다. https://www.mql5.com/en/market/product/152936
UEX Reader는 두 가지 유연한 트레이딩 방식을 제공합니다. 일반 방식과 평균화 방식
거래 포지션은 UEX 지표가 예측하는 시장 방향에 따라 개별적으로 또는 동시에 실행할 수 있습니다.
UEX Reader는 지표를 기반으로 작동하지만, MT5 테스터에서 테스트해 볼 수도 있습니다.
- - - - - - - -
UEX Reader Expert Advisor 사용 방법: https://www.mql5.com/en/market/product/166805/comments PDF document :
https://c.mql5.com/31/1830/UEX_Reader_ExpertAdvisor.zip
FREE

Chart Navigator MT5 Base 는 가격 차트에서 빠르게 이동하고, 차트 위의 사용자 표시 지점으로 즉시 이동하기 위한 미니맵입니다. 이 지표는 전체 가격 차트를 보여 주는 compact한 미니맵을 차트에 추가합니다. 이 지도는 과거 데이터를 빠르게 이동하고, 수직선으로 표시한 중요한 위치로 다시 돌아가는 데 도움이 됩니다. 이 단순한 내비게이터의 핵심 장점은 단순한 차트 스크롤이 아니라, 수동으로 힘들게 스크롤하지 않고 필요한 영역으로 빠르게 이동할 수 있다는 점입니다. 중요한 이벤트의 표시로 차트에 수직선을 놓으면, 그 선은 미니맵에도 표시됩니다. 이후 과거 데이터에서 멀리 앞으로 또는 뒤로 이동하더라도, 미니맵에서 해당 표시를 찾아 한 번의 클릭으로 필요한 위치로 빠르게 돌아올 수 있습니다. 중요한 날짜, 신호, 거래, 뉴스, 분석 구간 또는 빠르게 다시 돌아가야 하는 모든 지점을 표시할 때 편리합니다.
작동 방식 미니맵은 선택된 과거 구간을 compact한 가격
FREE

Repaint Inspector는 지표가 리페인트하는지를 주장만 믿고 넘어가는 대신 직접 측정합니다. 차트에 부착하고 임의의 커스텀 지표와 그 매개변수 목록을 지정하면, 이미 마감된 바에서 해당 지표의 버퍼를 반복해서 다시 읽으며 바뀌는 모든 값, 나타나는 모든 값, 사라지는 모든 값을 세고, 그런 일이 히스토리에서 얼마나 먼 과거까지 여전히 일어나는지도 함께 측정합니다. 이 프로그램은 측정 도구입니다. 차트에서는 주문을 절대 보내지 않습니다. 전략 테스터에서는 시작 시 최소 볼륨 포지션 하나를 열었다가 닫는데, MQL5 Market의 자동 테스트가 엑스퍼트 어드바이저가 거래 작업을 수행하는지 확인하기 때문입니다. 이 거래는 저널에 알림으로 기록되고, 측정에는 포함되지 않으며, 입력값 하나로 끌 수 있습니다. DLL과 네트워크 접근을 사용하지 않으며, MQL5\Files에 있는 두 개의 CSV 파일 외에는 디스크에 아무것도 쓰지 않습니다. 만든 이유: '리페인트 없음'은 지표 설명에
FREE

이 응용 프로그램은 당신이 당신의 개인 정보를 보호 할 수 있습니다. 이는 다른 서버에서 거래 전략의 결과를 확인하는 데 유용 할 수 있습니다.
예를 들어,계정 내역 내보내기를 사용하여 계정의 거래 내역을 원하는 형식의 파일로 내보내거나,전문가 내역 내보내기의 프로그램 코드를 전문가에게 연결하여 내역을 내보낼 수 있습니다.
파일의 시작 부분에 이러한 라인이 있어야합니다:
날짜,티켓,유형,기호,볼륨,항목,가격,정지 손실,수익,이익,수수료,수수료,스왑,매직
이 파일의 처음부터 위치하지 않을 수 있습니다,즉,다른 정보는 그 앞에 갈 수 있습니다.
그 후 파일의 끝에 하나의 트랜잭션에 대해 쉼표로 구분 된 필드 값이있는 줄이 있습니다. 행의 필드 값:
DATE - date in the format YYYY.MM .DD HH:MM:SS TICKET - transaction ticket (integer) TYPE - transaction type from ENUM_DEAL_TY
FREE
Breakout Shift Trader – MT5 Indicator Trade Like the Market Architects — Not the Victims. Most traders are fighting blind against a rigged game. Market makers engineer false breakouts, liquidity grabs, and “stop hunts” that wipe out retail accounts in seconds. Breakout Shift Trader flips the script. This MT5 indicator decodes the footprints left by institutional manipulation and aligns your trades with the power brokers driving real price action. Proven Results – Tested, Verified, Relentless N
FREE

ZeroG CyberClock Pro is not just another standard MetaTrader clock—it is a premium, beautifully crafted, cyberpunk-style desktop utility designed for the modern algorithmic and manual trader. Tired of basic, ugly text overlapping your charts? CyberClock Pro introduces a sleek, draggable Neon HUD that seamlessly blends into your trading environment without cluttering your analysis. Stay perfectly synchronized with the world’s major financial hubs thanks to its real-time Smart Session Engine.
FREE
Corretora recomendada para usar esse indicador: https://tinyurl.com/5ftaha7c Indicador que pinta o candle de amarelo em pontos de muita agressão no mercado. Sempre que o mercado for se movimentar o candle irá ficar amarelo. Valido para todos ativos e todos timeframes. SEE OUR RESULTS ON INSTAGRAM: https://www.instagram.com/diogo.cansi/ TELEGRAM GROUP = https://t.me/robosdsc More information by email dscinvestimentos@gmail.com or by Whatsapp 55-991372299
FREE
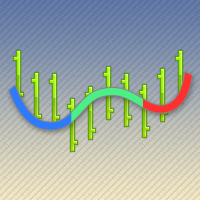
The ColorLine indicator shows the line of the price moving average on the chart. The line has diffrent colors (100 bars have the same color). The color settings of the line is changing every 5 ticks, there are 3 color schemes. Indicator for demonstrating the DRAW_COLOR_LINE style. Draws a line at Close prices in colored pieces of 20 bars. The thickness, style and color of the line sections are changed randomly. The indicator code is published in the MQL5 Documentation in the section Indicator S
FREE

Basket Close – Your Smart Trading Assistant for the Perfect Exit!
The Basket Close EA is the ideal solution for traders who want to efficiently manage their open positions. This simple Expert Advisor allows you to close all open positions simultaneously based on a predefined profit or loss target.
Automated Risk Management – Closes all positions as soon as a specific profit or loss (in percentage of the account balance) is reached.
Efficient Trade Control – No more manual monitoring or
FREE

If you like this product, please give it a 5 star rating as a token of appreciation.
This indicator calculates and draws pivot points and support/resistance levels for both daily and weekly timeframes: Pivot (central) level Support levels S1, S2, S3 Resistance levels R1, R2, R3 It allows showing daily, weekly, or both sets of pivots , giving traders visual references for potential support/resistance areas.
Pivot mode: Choose which pivots to display (weekly, daily, or both). Colors and style: C
FREE
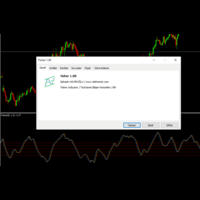
With Fisher level indicator. Many settings can be changed by the user, indicator created with original calculation. You can adjust the levels you create according to yourself and provide more stable displays. What is Fisher indicator: It transforms data that does not normally show a normal distribution, such as market prices. In essence, the transformation helps to better identify price reversals on a chart by making peak swings relatively rare events.
FREE

Kito Horizon Forecast is a closed-bar analytical indicator for MetaTrader 5. It combines current-chart conditions with confirmation and macro-timeframe context to present a directional forecast and a fixed planning roadmap.
The indicator does not open, modify or close trades. It is designed to support discretionary analysis and EA integration.
Main features
Long and short confidence The panel displays separate directional confidence scores and classifies the current state as LONG, SHORT or W
FREE

Trading Session Activity Dashboard
TAGLINE
Trade the session, not just the candle.
PRODUCT OVERVIEW
SessionEdge Navigator MT5 is a session-analysis indicator for MetaTrader 5. It tracks the major trading sessions and provides a practical dashboard showing whether a session is active, how much range it has produced, how that range compares with its recent average, and whether current session behavior is bullish, bearish, or range-like.
Covered sessions: - Sydney - Tokyo / Asian - London - N
FREE

Trade Manager Panel is a free on-chart utility that helps you manage open positions quickly with a set of one-click buttons. It does not open trades on its own and generates no trading signals - it is a pure manual-trading assistant that works on any account with no restrictions.
Features: - Close All: close every open position at once. - Close Profit: close only the positions currently in profit. - Close Loss: close only the positions currently in loss. - Partial Close: close a configurable p
FREE

MT5 Alert Indicator Please add Ema moving averages 60/100/200 & Rsi period 10 levels 30/70 to your chart. This indicator alert on a trend reversal strategy were - ema 60 > 100&200 - ema 100 < 200 And the Rsi is below 30 FOR BUY SIGNAL
Use this strategy in confluence with a larger timeframe trend in the same direction. This strategy identifies great entry opportunities to enter an early trend.
FREE

The EA supports closing orders based on the preset amount. It can close all orders on all pairs, or it can close orders based on Magic ID. Button "Close All" manual Input - Magic Number: Magic Number = 0: Close All pairs Magic Number diffrent 0: Close All with Magic - Money TP: Profitable in money. the EA will close all orders - Money SL: Loss in money. the EA will close all orders Contact: t.me/nguyenvanbo128
FREE
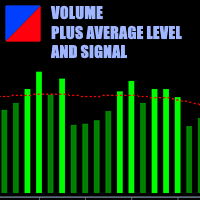
This is a volume indicator with the addition of a threshold level that can be set to a fixed value chosen personally or obtained from the average of the volume values themselves. The type of averaging method can be selected in the input parameters.
The input parameters are easy to interpret but let's examine them:
1 - Volume type Here you can select the type of volume you want to see represented and there are 2 choices, either TICK volume or REAL volume. Keep in mind that for forex, for examp
FREE
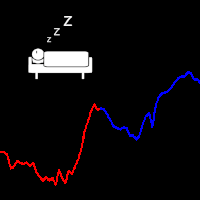
An easy indicator that simply shows the moment we connect to the market. We can easily see what has happened while we were gone because the line has two different colors that show the start time. It is only that, a visualization aid that allow us to mark the market behavior while it was night time in our country, or if we have stopped several hours. Input: Server start working date: Day of month Month Year Hour Minutes
FREE

The indicator plots three lines on the chart — an upper band, a moving average, and a lower band — forming an envelope around price. On each bar it computes a momentum value by subtracting the price n bars ago from the current price (where n is the momentum period). This captures how fast price is moving, not just where it is. It then looks back over the last period bars and sums up the squared momentum values. The square root of that average gives a momentum-based standard deviation — essential
FREE

Double Line Donchian Channel MT5/Meta Trader 5 Indicator, this is customized Indicator to show only 2 Lines of Highest and Lowest PRICE line where you can add a MA (MOVING AVERAGE) for center line. What is Donchian Channel?
Donchian Channels are three lines generated by moving average calculations that comprise an indicator formed by upper and lower bands around a midrange or median band. The upper band marks the highest price of a security over N periods while the lower band marks the lowest p
FREE

Multi-MA Ribbon Overlay (6 EMAs + 250 SMA)
This indicator displays six exponential moving averages (15, 25, 35, 45, 60, 70)(YOU CAN CHANGE THE VALUES) and a slow 250-period simple moving average to help visualize market momentum and trend structure. It’s designed as a clean trend-ribbon for scalpers, intraday, and swing traders. ️ Disclaimer:
Trading forex and CFDs on margin carries a high level of risk and may not be suitable for all investors. Leverage can work for or against you. Always u
FREE

StrikeZone ATR 는 시장의 변동성을 가장 직관적으로 보여주기 위해 설계된 전문 지표로, 트레이더가 현재 시장 환경을 빠르게 파악하고 최적의 매매 결정을 내릴 수 있도록 도와줍니다. 이 지표는 ATR 기반의 가격 변화 폭을 멀티 컬러 히스토그램으로 시각화하여 상승·하락뿐 아니라 강한 추세와 약한 움직임을 명확히 구분할 수 있습니다. 또한 스무딩 처리된 변동성 라인은 전체 흐름을 부드럽게 표시하여 단기 급등락 패턴, 변동성 수축 국면, 추세 전환 가능성을 더욱 명확하게 인식할 수 있도록 해 줍니다. StrikeZone ATR은 스캘핑, 단타, 선물지수 트레이딩 등 빠르게 변화하는 시장에서 특히 높은 활용도를 제공합니다. 변동성이 확대되는 구간에서는 추세 진입 타이밍을 제공하고, 변동성이 줄어드는 시기에는 위험 관리가 필요함을 알려주는 등 다양한 전략과 자연스럽게 결합될 수 있습니다. 또한 가볍고 최적화된 구조로 제작되어 어떤 차트에서도 빠르고 안정적으로 작동하며, 초보자부터
FREE

This indicator is based on the MACD indicator
Also, some candlestick patterns are used in it to identify better signals
Can be used in all symbols
Can be used in all time frames
Easy to use method
Adequate settings
Settings: period: The number of candles used to calculate signals. pFast: Like the MACD indicator settings pSlow: Like the MACD indicator settings
alarmShow: If you want to receive an alert in Metatrader after receiving the signal, enable this setting alarmShowNoti: If you want to
FREE

Advanced Trade Mirror is a powerful Forex tool designed for traders who need instant, seamless trade replication across multiple terminals on the same machine. With lightning-fast execution, it ensures zero lag in copying trades, maintaining precision and efficiency in high-speed trading environments. Get the Trade Mirror Master here: https://www.mql5.com/en/market/product/133891
Specification:
Master ID: Identity value of master terminal, please use a unique value to prevent duplicated mas
FREE
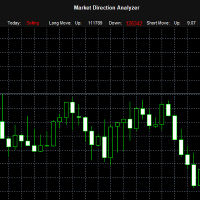
The "Market Direction Analyzer" is a technical indicator designed to provide traders with a comprehensive analysis of market trends, momentum, and potential reversals. By integrating multiple analytical tools, it offers a multi-dimensional perspective on market conditions, aiding in more informed trading decisions.
Using the Market Direction Analyzer in Trading: Trend Confirmation: By analyzing the aggregated sentiment score derived from its components, traders can confirm the prevailing market
FREE
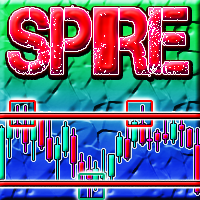
Spire - показывает трендовый, сигнальный, свечной прорыв в сторону верхней или нижней границы канала, а так же временную или долгую консолидацию в виде прямоугольного канала. Сигналы тренда не перерисовываются. В основу идеи индикатора входит Bollinger Bands.
Изменяемые параметры Signal trend -изменение цветовой гаммы сигнального символа тренда Lower limit - изменение цветовой гаммы нижней границы канала Upper limit - изменение цветовой гаммы верхней границы канала Internal field -изменение ц
FREE
Hi Traders, EMA is very popular indicator to determine: trend // support // resistance. Here are the use of this simple yet very powerful Multi-Time Frame indicator: 1- Attach this indicator to your chart . - Choose the desired time frame ( ex: Current, M15, H1, H4, D1,...). - Set your desired EMA periods ( ex: 20, 50, 100, 150, 200,...). - Enable which EMA you want to show by setting the relevant EMA to: True / False (you can show 1, 2, 3, 4 or all of 5 EMAs at the same time). - Set col
FREE
WindFlow HTF is a useful tool suited to use in conjunction together with my WindFlow indicator. This indicator will give you a background vision about the price action trend on a higher timeframe, so when it runs with the WindFlow indicator you have an almost complete trading solution. At this point, you only need some support/resistance analysis and a bit of focus to become a consistent trader.
The metaphorical "wind's ballet" Professional traders know that every timeframe is governed by its o
FREE
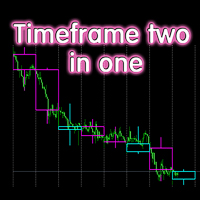
The indicator displays candlesticks of a given senior timeframe, on smaller timeframes
TF_Bar - selection of the senior timeframe, based on which candlesticks on the current one will be displayed.;
Number_of_Bars - the maximum number of bars up to which the indicator will be calculated.;
Color_Up - color display of bullish candlesticks;
Color_Down - color display of bearish candlesticks;
Widht_lines - the thickness of the indicator lines.
Other useful free and paid products can be viewed
FREE

The Equity Curve indicator is a simple and helpful tool that shows the development of the equity curve in real time. For precision measurement, it should be used in a separate window with a period of M1.
Main features The indicator shows the development of the equity curve in real time. High precision on the minute chart. High-speed calculation. Available for MT4 and MT5. Please visit the Equity Curve indicator product page for the input and output parameters settings.
FREE

Time Panel: Server Time, Local Time and Open and closed clocks for TOKYO, London and New York.
Time Panel + Horizontal Bar: Server/Local + Main markets Sessions
Example: TIMES SERVER HH:MM:SS LOCAL HH:MM:SS TOKYO OPEN 00:00 - 09:00 UTC cls 02:34:15 LONDON CLOSED 08:00 - 17:00 UTC opn 05:12:33 NEW YORK OPEN 13:00 - 22:00 UTC cls 07:45:22
https://t.me/Tonic_Trades_Signals
FREE

Currency Strength Heatmap with Meter Overview Currency Strength Heatmap is a professional multi-currency strength indicator designed for MetaTrader 5. It analyzes the relative strength of the eight major currencies (EUR, USD, GBP, JPY, AUD, CAD, CHF, and NZD) in real time and presents the information through an advanced Heatmap Matrix and Currency Strength Meter. Instead of relying on a single currency pair, the indicator evaluates all 28 major currency combinations to identify the strongest and
FREE

A technical analysis tool that displays dynamic price levels on the chart based on market volatility measurements. Technical Features: Calculates 5 distinct price levels displayed as horizontal lines Applies a multiplier factor (default: 6.0) to scale the calculations Features an adaptive central reference line that adjusts based on price movement All levels update dynamically as new price data becomes available Visual Components: Upper Level 2 (Red): Outermost upper boundary Upper Level 1
FREE

Keltner Channels Enhanced - Professional Indicator with Alerts
Full Description:
Keltner Channels Enhanced is a professional-grade technical indicator that brings the classic Keltner Channels to a new level with advanced features and complete customization.
KEY FEATURES
Advanced Calculation Exponential Moving Average (EMA) based middle line. Average True Range (ATR) for dynamic channel width. Customizable price type (Close, Open, High, Low, Median, Typical, Weighted). Horizontal shift o
FREE
EMA Line Visualizer with Trend Analysis Description:
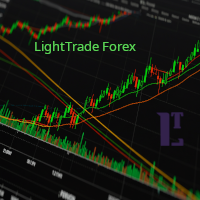
The Exponential Moving Average (EMA) Line Visualizer EA plots multiple EMAs on your chart (25, 50, 100, 200, and a custom EMA) and analyzes real-time trend direction. It detects whether the market is currently in an Uptrend , Downtrend , or Flat condition based on the latest EMA relationships. Features: Multi-EMA Display
Plot multiple EMAs with customizable periods. Custom Colors
Set distinct colors for each EMA line for better visual trac
FREE

Propfirm Buddy - Your Ultimate Equity Protector [ TG group Propfirm experience sharing]
Are you tired of losing funded accounts or failing evaluations due to sudden market spikes or emotional revenge trading? Propfirm Buddy is an advanced, lightweight utility Expert Advisor designed to be your personal risk manager. Whether you are trading a prop firm challenge or protecting a live funded account, Propfirm Buddy runs quietly in the background, monitoring your equity 24/5. The moment a critica
FREE

Friends, join us!
Ask questions and connect with like-minded traders: MetaCOT Public Group
MetaCOT Information Channel: news, CFTC reports, and signals: MetaCOT Channel
Here’s to successful trading and new profitable signals for us all! Attention! Recently, certain countries have been blocking access to the cftc.gov website. As a result, users in these countries are giving the product low ratings. MetaCOT has always adhered to the highest quality standards and is in no way associated with th
FREE

MeeKiew Easy Order Manager (MT5) is a high-performance trading utility designed to streamline order execution and management on the MetaTrader 5 platform. Specifically optimized for use with the MeeKiew Dynamic MTF Pivot (MT5) indicator, this tool allows traders to react to market levels with speed and precision. While MT5 can sometimes feel slower in manual execution, this manager bridges the gap with a "One-Click" philosophy and advanced bulk management features. MeeKiew Dynamic MTF Pivo
FREE

캔들 그림자 지표: 각 캔들의 숨겨진 힘을 잠금 해제하세요! 피상적인 가격 변동 분석에 지치셨나요? 각 시간 프레임에서 매수자와 매도자의 힘을 더 깊이 이해하고 싶으신가요? 캔들 그림자 지표 를 소개합니다 – 시장의 숨겨진 역학을 시각화하고 분석하는 데 필수적인 도구입니다! 이 강력한 지표는 캔들 그림자 크기에 반영된 매수자와 매도자 간의 보이지 않는 싸움을 차트에 직접 명확하고 유익한 히스토그램으로 변환합니다. 캔들 그림자란 무엇이며 왜 그렇게 중요할까요? 캔들 그림자 또는 "심지"와 "꼬리"는 특정 기간 동안 가격이 도달한 최고가와 최저가를 나타내며, 해당 기간이 끝날 때 가격이 마감된 수준을 함께 보여줍니다. 긴 윗그림자는 강한 매도 압력을 나타내며, 가격을 도달한 최고점에서 아래로 밀어냅니다. 반대로, 긴 아랫그림자는 가격 하락을 매수한 적극적인 매수자를 나타냅니다. 캔들 그림자 지표를 사용하면 다음을 수행할 수 있습니다. 시장 참여자의 힘을 시각화합니다: 해당 히스토그램 막
FREE
Engulfing Signal Indicator with EMA Confirmation This indicator is made to identify engulfing candlestick patterns in real-time using a mathematical approach and a constant bar-checking loop. It highlights these patterns as they occur, offering visual cues and confirmation when aligned with specific market conditions. How it works: Engulfing Pattern Detection : The indicator identifies engulfing candles using a division factor. A candle is considered engulfing if the entire range (body + wicks)
FREE

Features The Expert Advisor (EA) is a semi-automated trading system that blends user-initiated entries with algorithmic trend management. Trade entries are triggered manually, while scaling, trailing stops, and risk control are handled automatically by the EA. Functional Specifications 1. Trading Modes Manual Execution Mode Trades initiated via on-chart control panel User selects Buy or Sell direction EA applies predefined Stop Loss and Take Profit values Trend management logic activates after
FREE
Copier MS MT5 Netting Copyist MS is a fast and easy-to-use copier of trade orders; it works as an advisor in the form of a single file with switching between the Master and Slave operating modes. The current version of the adviser works only on netting accounts. Settings Type of work - selection of the operating mode: Master or Slave; Master account number - number of the trading account of the master terminal; Selective copying currency pairs - individual selection of currency pairs for copyin
FREE
* This product was converted using "BRiCK Convert4To5 MT4 " based on the MQL4 source file of "BRiCK Convert4To5 MT4 Free" . "Convert4To5" is a Script that converts MQL4 source files into MQL5 source files.
Experts, Indicators, Scripts, and Libraries with extension ".mq4" will be available for MT5.
Parameter
None.
Procedure
1. Open the following folder.
terminal_data_folder\MQL4\Files\ (in the terminal menu select to view "File" - "Open the data directory") 2. Confirm that the BRiCK_Conv
FREE

If you like this product, please give it a 5 star rating as a token of appreciation.
This indicator draws vertical lines marking key Forex trading sessions (Asian, London, New York) for a configurable number of past days. These “Silver Bullet” lines help traders quickly visualize session start and end times on the chart.
DaysToDisplay: How many previous days’ session lines to show. Session colors: Customizable line colors for each session. Session start hours: Local server hours for each sessi
FREE
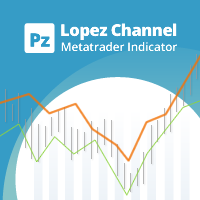
This multi-timeframe indicator identifies the market's tendency to trade within a narrow price band. [ Installation Guide | Update Guide | Troubleshooting | FAQ | All Products | Get Help ] It is easy to understand Finds overbought and oversold situations Draws at bar closing and does not backpaint The calculation timeframe is customizable The red line is the overbought price The green line is the oversold price It has straightforward trading implications. Look for buying opportunities when t
FREE

The indicator highlights in color the places on the chart where the price moves in one direction continuously from the selected number of candles.
You can specify the number of points from the beginning of the movement to select only movements from this amount.
It can be useful for looking for reversals or sharp impulses.
I also recommend purchasing this utility to determine local weekly / monthly trends and support and resistance lines. https://www.mql5.com/en/market/product/61401
FREE
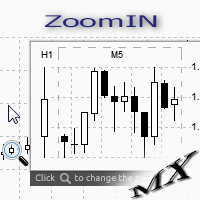
The ZoomIN MT5 indicator is designed for quickly viewing the selected bar on the smaller timeframes in a pop-up window. Once launched, the indicator works in the background, does not take up space on the chart and does not consume system resources. When the indicator is activated by the Shift + i combination (can be changed in the settings), a pop-up window with a chart of a smaller timeframe is created. The displayed timeframe can be changed by a left-click on the magnifying glass icon. To hide
FREE

The Average Directional Index (ADX) is a technical analysis indicator developed by J. Welles Wilder in 1978. Its primary function is to measure the strength of a trend, regardless of its direction, and to determine whether the price has entered a sideways trend. It is also mentioned by John Murphy in *The Visual Investor* (2005) as an indicator that helps determine whether a market is ranging or is about to start a new trend. As for Exponential Moving Averages (EMAs), some authors believe that
FREE

Drawdown Dashboard Lite 適合希望隨時掌握帳戶風險狀態的 MT5 使用者。
工具掛到任意圖表後,會每秒自動更新帳戶資料,讓使用者可以快速查看目前資金狀況與回撤程度,而不需要另外計算。
主要顯示內容包括:
Balance:目前帳戶已實現資金餘額 Equity:Balance 加上目前所有未平倉浮動損益後的實際帳戶權益 Floating P/L:目前全部持倉的總浮動盈虧 Current Drawdown:目前 Equity 低於 Balance 的金額與百分比 Session Peak Equity:自工具啟動後曾出現過的最高 Equity Session Max Drawdown:自工具啟動後,從最高 Equity 回落所出現的最大回撤 Positions:目前帳戶中的持倉總數
例如:
Balance: 10,000 USD Equity: 9,820 USD Floating P/L: -180 USD Current DD: 180 (1.80%) Session
FREE

Dragos Fractal Analog is a MetaTrader 5 indicator built for traders who want to compare the current market structure with similar historical price patterns.
The indicator searches past market data, finds the closest fractal analog, and projects the historical continuation onto the active chart using normalized scaling.
It is designed for research, pattern comparison, directional context study, and discretionary decision support.
Main features:
- Best historical pattern matching
- Current mode
FREE

This indicator will show you the average entry price for positions, pending orders and both, every side and every type has an different color; It will also show you actual risk, pending risk, both sum and for both sides and the sum of both; you can configure Day, Week, Month and Year Financial Risk to show you if you are close to it; it shows the risk return of each side and both sides too, based on risk and profit for actual position and pending orders
FREE
If you use several charts open at the same time, you know how boring it is to apply formats to each chart individually. This script can change all open charts using a single command. Parameters: 1 - Choose symbol to put on charts: apply the selected symbol to all charts. If "current", it does not change the symbol; 2 - Choose timeframe or leave empty: apply the selected timeframe to all charts. If "CURRENT", it does not change the timeframe; 3 - Apply template to the charts: If true, apply the t
FREE
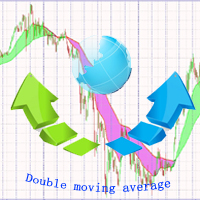
https://www.mql5.com A double moving average indicator This indicator uses the system's own two different time period of moving average indicators to reflect the movement of market prices. It is recommended that you use the default parameter Settings, which you can set according to your own experience to get the best predictive power. I hope it can provide some help for your trading.
FREE

Simple Calendar Events is an indicator that will mark important Important Economy Events on your chart. For example, if you are trading something that is USD based, you would like to know when some important events are coming, you can expect some volatility or some different Price action, so you can base your strategy on it. If you trade something that is country based you can also choose that, and it will show you when the event is, so you can be prepared for it. When you hover with the mouse
FREE

LotCalc is a minimalist MT5 indicator designed for fast, precise position sizing. Set your risk amount in dollars, click the button, then click your entry and stop-loss levels directly on the chart — the lot size and point distance are calculated and displayed instantly. No clutter, no extra panels, just the one tool you actually need before placing a trade.
FREE

Market Watch Bulk Loader 스타터 버전: 티커 목록을 붙여넣기만 하면 클릭 한 번으로 시장 관찰창에 추가됩니다. 한 번에 최대 5개 티커.
티커를 하나씩 직접 입력하지 말고, 클립보드에서 시장 관찰창으로 한 번에 추가하세요.
이것은 Market Watch Bulk Loader의 스타터 버전입니다. 정식 버전과 기능이 완전히 동일하며, 제한은 단 하나입니다. 한 번에 5개 티커까지 불러옵니다. 사용 중인 브로커의 심볼 표기를 이 유틸리티가 제대로 인식하는지 먼저 확인해 보세요.
사용 방법
1. 티커 목록을 클립보드에 복사합니다(스크리너, 스프레드시트, 채팅 메시지, 일반 텍스트 등 어디서든 가능). 2. MetaTrader 5에서 패널의 TXT 버튼을 누릅니다. 입력창이 나타납니다. 3. 목록을 붙여넣습니다(Ctrl+V 또는 마우스 오른쪽 버튼). 4. Copy를 누릅니다.
유틸리티는 각 티커를 브로커가 실제로 제공하는 심볼과 대조하여 일치하는 항목을 시장
FREE

>
Risk Sentinel은 전략이 아니라 보호 도구입니다. 매매를 개시하지 않습니다. 전문 트레이딩 데스크가 리스크를 관리하는 방식으로, 사용자나 다른 EA가 진입한 포지션을 지켜줍니다.
주요 기능
- 모든 포지션에 강제 손절(stop-loss). 포지션을 손절 없이 방치하지 않습니다. ATR, 포인트, 퍼센트, 고정 금액 중에서 선택하세요. - 자동 본전(break-even) 및 트레일링 스탑. 흐름이 유리하게 전개되면 수익을 고정합니다. - 일일 손실 서킷 브레이커. 당일 손실이 설정한 한도에 도달하면 전 포지션을 청산하고 남은 하루 동안 매매를 중단합니다. 터미널을 재시작해도 상태가 유지됩니다. - 경제 캘린더 인식. 해당 심볼의 통화와 관련된 고영향 뉴스를 주시하며, 위험 구간 동안 포지션을 보호합니다. 대부분의 로봇은 뉴스를 무시합니다. 이 도구는 그렇지 않습니다. - 원클릭 패널. 전 포지션 청산, 전 포지션 본전 이동, 그리고 패닉 스위치를 차트에서 바로 사용할
FREE

The Three Candle Types Label Name Condition 1 Inside Bar High ≤ prev High AND Low ≥ prev Low 2 Directional Bar Higher High XOR Lower Low (one, not both) 3 Outside Bar High > prev High AND Low < prev Low Additional Failed type 2FU (red, above) = Higher High but candle closed red (bearish) → Failed Up 2FD (red/orange, below) = Lower Low but candle closed green (bullish) → Failed Down
FREE
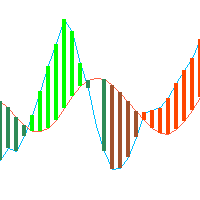
This is just a ADX with multi symbols, multi timeframes, and colors. features. different symbols and timeframes from the main chart. draw ADX and ADX moving average. easy to identify if ADX is above 25 or not. e asy to identify if ADX is above moving average or not. easy to identify the direction of the trend by color, not by DI line. unnecessary DI lines can be erased
FREE

Trade Auditor는 읽기 전용 포렌식 분석 도구입니다. 거래를 열지 않으며 아무것도 변경하지 않습니다. 계좌 자체의 거래 내역과 보유 포지션을 스캔하여, 계좌가 절제된 트레이딩 데스크처럼 움직이는지 - 아니면 계좌가 터지는 방식으로 움직이는지 - 쉬운 말로 알려줍니다. 대부분의 트레이더는 EA를 구매하거나 시그널을 복사하지만, 드로다운이 닥치기 전까지는 그것이 계좌에 실제로 어떤 영향을 미치는지 제대로 알지 못합니다. Trade Auditor는 그것을 보여주고, 직접 증명할 수 있게 해줍니다. 무엇을 점검하는가 마틴게일. 손실 이후 포지션 크기가 커지는 것 - 전형적인 계좌 파괴 요인입니다. 잔고 기준으로 정규화하므로, 정상적인 리스크 기반 크기 증가는 표시되지 않습니다. 그리드 및 물타기. 이전 거래가 아직 열려 있는 동안 같은 방향으로 더 불리한 가격에 또 다른 거래를 여는 것 — 의도가 아니라 패턴입니다. 의도적인 분할 진입(스케일인)이나 다중 진입 돌파 전략도 더 불리
FREE

Server Clock and Daily Reset Hour is a small read-only chart panel that answers one question: what hour, in your broker's server time, does your trading day actually reset? Prop firm and funded account rules are usually written in a time zone that is not yours and not your broker's. A rule that says the day resets at 5:00 pm New York has to be converted into broker server time before it is any use to you, and the answer changes twice a year when clocks shift. Getting it wrong means every daily l
FREE

Características Principales 1. Medía Móvil Multi-Timeframe (MTF) con Estabilidad Temporal EMA Macro ( InpMATimeframe ): Permite proyectar y visualizar en el gráfico actual una Media Móvil Exponencial (EMA) calculada desde una temporalidad superior (por defecto en gráfico diario PERIOD_D1 ). Independencia de Temporalidad: Mantiene los cálculos exactos y fijos del periodo que se requiera (la temporalidad macro seleccionada) sin que estos se modifiquen, distorsionen o recalibren indebidamente al
FREE
Volume-to-Price Movement Oscillator (VP Oscillator) for MT5 The VP Oscillator highlights the balance (or imbalance) between trading volume and price movement, helping traders spot hidden accumulation, distribution, or weakening trends. How It Works: Calculates each bar’s price range (High–Low) and tick volume. Normalizes both values over a set period (default: 14). Plots the absolute difference between them ×100 — showing how closely price action aligns with trading activity. Interpretation: Hig
FREE
The EMA Navigator Pro is an advanced version of the popular EMA indicator, designed to provide superior flexibility and multi-timeframe analysis capabilities. This indicator not only displays EMA lines but also offers a powerful alert system to ensure you never miss a crucial signal. Key Features: Multi-Timeframe Support: You can assign a separate timeframe to each individual EMA line, allowing you to analyze long-term (e.g., D1) and short-term (e.g., H1) trends on the same chart. Automatic Cro
FREE

The Tick Data Record is a multi-symbol multi-timeframe Expert Advisor that records tick data for later graphical representation and analysis. General Description The Tick Data Record offers a(n) alternative/complement to the online/offline price charts displayed through the MT4/MT5 platform. The Expert Advisor permits to write and save the current/history values of Time, Bid, Ask, Spread, Last and Volume to a text file (“.txt”). The idea is to copy/open the obtained register to/in a spreadshe
FREE

is a multi-timeframe visual matrix that tracks the relative linear progression (log-return strength) of the eight major currencies — EUR, GBP, AUD, NZD, USD, CAD, CHF, and JPY — across selected timeframes in a single responsive panel. Motive Traders often struggle to quickly see which currencies are gaining or losing strength relative to one another across multiple timeframes. This indicator condenses that information into color-coded progression lines so you can immediately identify strong vers
FREE

Nika Session Spread Intelligence는 시장 개장 시간, 마감까지 남은 시간, 모든 거래 세션을 깔끔한 다크 테마 패널로 차트에 직접 표시하는 경량 인디케이터입니다. 일반적인 세션 인디케이터와 달리 이 도구는 SymbolInfoSessionTrade를 통해 브로커의 실제 거래 세션 일정을 읽어오므로 표시 시간이 항상 정확합니다 - 외환, 지수, 원자재, 암호화폐 모두 지원. 주요 기능 - 시장 개장/폐장 상태 색상 표시 (녹색 = 개장, 빨간색 = 폐장) - 카운트다운 타이머 - 세션 종료 또는 다음 개장까지 남은 시간, 500ms마다 업데이트 - 시각적 진행 바 - 세션 진행에 따라 채워짐, 마감 근처에서 오렌지색으로 변경 - 당일 모든 세션 목록 (서버 시간), 활성 세션 강조 표시 - 내장 알림 - 세션 시작/종료 X분 전 알림 (설정 가능, 사운드 포함) - 패널의 + / - 버튼으로 확대/축소 - 완전한 사용자 정의 - 색상, 폰트, 위치, 새로고침 빈
FREE

High Volume Pivot SR Zones Advanced Volume-Based Support & Resistance Indicator for MetaTrader 5 High Volume Pivot SR Zones is an advanced technical analysis indicator designed to identify important market support and resistance areas using pivot levels, price action, and volume-based analysis. The indicator helps traders identify potential market reversal zones, breakout opportunities, breakdown levels, and support/resistance retests directly on the chart. By combining pivot-based price levels
FREE
트레이딩 전략과 기술 지표를 판매하기에 가장 좋은 장소가 왜 MetaTrader 마켓인지 알고 계십니까? 광고나 소프트웨어 보호가 필요 없고, 지불 문제도 없습니다. 모든 것이 MetaTrader 마켓에서 제공됩니다.
