TemplateMaker

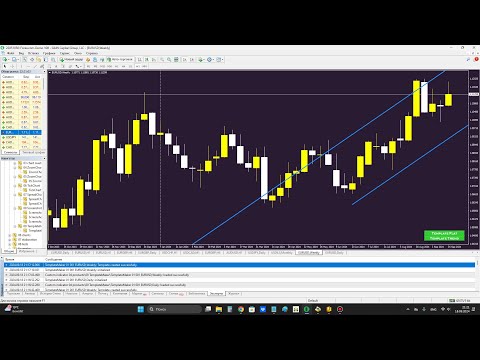
This indicator simplifies the process of creating chart templates by allowing you to save your current chart settings to a template with just one click of a button. The indicator adds a button directly to the chart that automatically saves the template with a given name and prefix, making it easy to organize and use templates.

The main functions of the indicator are:

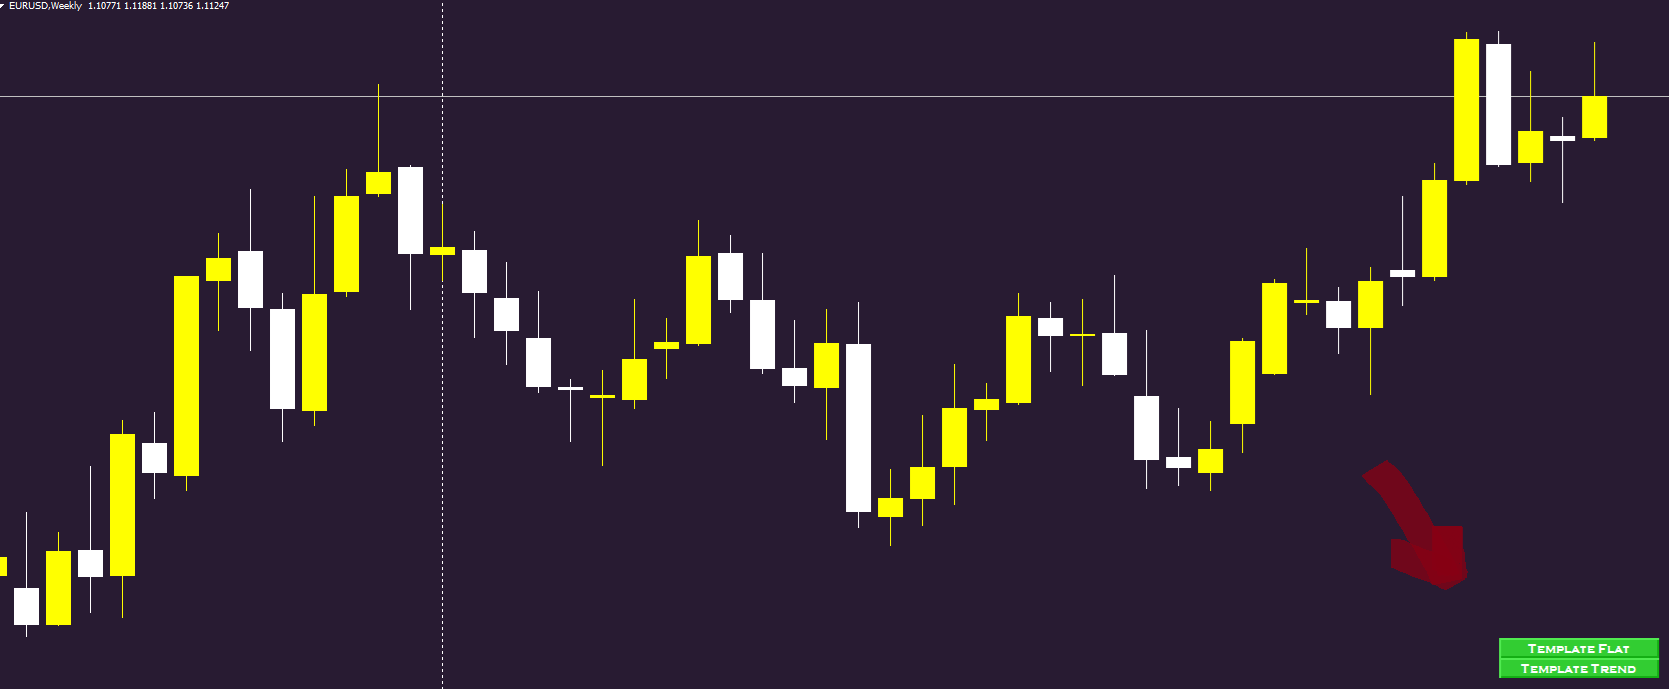
Creating a template of the current chart with a single click on the button.
Possibility to specify a prefix for the template name, which makes it easy to distinguish them.
Support of several indicator instances with different prefixes without overlapping buttons.
Indicator parameters:

prefix - prefix for the name of the created template to distinguish it from others.
추천 제품
Matrix Arrow Indicator Multi Timeframe Panel MT4 는 Matrix Arrow Indicator MT4 를 위한 무료 추가 기능이자 훌륭한 자산입니다. 5개의 사용자 맞춤형 타임프레임과 총 16개의 수정 가능한 기호/기기에 대한 현재 매트릭스 화살표 표시기 MT4 신호를 보여줍니다. 사용자는 Matrix Arrow Indicator MT4 로 구성된 10개의 표준 표시기를 활성화/비활성화할 수 있습니다. Matrix Arrow Indicator MT4 에서와 같이 10개의 모든 표준 지표 속성도 조정 가능합니다. 매트릭스 화살표 표시기 다중 시간 프레임 패널 MT4는 16개의 수정 가능한 기호 버튼 중 하나를 클릭하여 첨부된 현재 차트를 변경할 수 있는 옵션도 제공합니다. 이렇게 하면 다른 기호 간에 훨씬 빠르게 작업할 수 있고 다시는 거래 기회를 놓치지 않을 수 있습니다. 이 무료 Matrix Arrow Indicator Multi Timef
FREE
CoralPage
D Armond Lee Speers
CoralPage is a simple little utility to add navigation controls to your chart.  You can now easily step through the symbols in the Market Watch without having to click-and-drag a symbol from the Market Watch onto your chart.  It's a simple but indispensable time-saver! Click move to the first, previous, next or last symbol in the Market Watch.  Shift-click to go the the previous or next symbol that has an open order. CoralPage is completely free.  If you like this, please check out my other prod
FREE
IceFX SpreadMonitor
Norbert Mereg
4.91 (11)
IceFX SpreadMonitor is a special spread logging indicator which displays the current, minimum/maximum and average spread values. These values are set to be visible even after a reboot. Also, SpreadMonitor could save all the desired spread values to .csv files for later analysis of the results. Indicator parameters: SpreadLowLevel - low level of spread (show value in green color) SpreadHighLevel - high level of spread (show value in red color) BGColor - background of panel SpreadNormalColor - co
FREE
FFx Bears Power
Eric Venturi-Bloxs
5 (1)
The purpose of this new version of the MT4 standard indicator provided in your platform is to display in a sub-window multiple timeframes of the same indicator. See the example shown in the picture below. But the display isn’t like a simple MTF indicator. This is the real display of the indicator on its timeframe. Here's the options available in the FFx indicator: Select the timeframes to be displayed (M1 to Monthly) Define the width (number of bars) for each timeframe box Alert pop up/sound/ema
FREE
ATR Bands MT4
Mykola Khandus
ATR Bands with Take-Profit Zones for MT4 The ATR Bands indicator for MT4 is designed to assist traders in managing risk and navigating market volatility. By using the Average True Range (ATR), it helps identify key price levels and set realistic stop-loss and take-profit zones. Key Features: ATR-Based Bands : The indicator calculates dynamic upper and lower bands using ATR. These bands adjust based on price volatility, helping to indicate potential support and resistance levels. Customizable Par
FREE
FFx RVI
Eric Venturi-Bloxs
5 (1)
The purpose of this new version of the MT4 standard indicator provided in your platform is to display in a sub-window multiple timeframes of the same indicator. See the example shown in the picture below. But the display isn’t like a simple MTF indicator. This is the real display of the indicator on its timeframe. Here's the options available in the FFx indicator: Select the timeframes to be displayed (M1 to Monthly) Define the width (number of bars) for each timeframe box Alert pop up/sound/ema
FREE
Apex Drawdown
Carl Christian Nyberg
Uncomplicated straightforward indicator that shows the maximum account drawdown since the indicator was added to the chart. The indicator does not take transaction history into account since it is impossible to calculate drawdown from historical entries en closures of trades. The indicator will be free in this basic form. Eventually it will be developed but the focus is to keep it plain and simple.
FREE
FFx Bulls Power
Eric Venturi-Bloxs
3.67 (3)
The purpose of this new version of the MT4 standard indicator provided in your platform is to display in a sub-window multiple timeframes of the same indicator. See the example shown in the picture below. But the display isn’t like a simple MTF indicator. This is the real display of the indicator on its timeframe. Here's the options available in the FFx indicator: Select the timeframes to be displayed (M1 to Monthly) Define the width (number of bars) for each timeframe box Alert pop up/sound/ema
FREE
Fibomathe for MT4
Almaquio Ferreira De Souza Junior
Fibomathe Indicator: Support and Resistance Tool for MT4 The Fibomathe Indicator is a technical analysis tool designed for MetaTrader 4 (MT4) that assists traders in identifying support and resistance levels, take-profit zones, and additional price projection areas. It is suitable for traders who use structured approaches to analyze price action and manage trades. Key Features Support and Resistance Levels: Allows users to define and adjust support and resistance levels directly on the chart. L
FREE
Mtf WPR Screener
Sergey Batudayev
MTF WPR  Screener  A compact multi-timeframe dashboard that converts Williams’ %R (WPR) into a clear, actionable signal: NOW: BUY/SELL with confidence % , plus the Best Entry TF suggestion and a simple volatility label . What you get NOW decision (every second): BUY / SELL + confidence % Best Entry TF: highlights the most suitable timeframe for entry in the current direction MTF table (optional): WPR values across timeframes in one panel (toggle “Details”) Two trade display modes: STRICT: shows
FREE
Add indicator "Symbol Name Drawer " on chart. Indicator creates text object with name of current symbol. You can change symbols on chart and indicator automatically changes text. Free to use. Simple tool. If you have any suggestion you can write me about it in comments. I try to improve this tool in future versions. Thanks for using my indicator. If you want to order something special in mql4 or mql5 message.
FREE
This indicator is designed for calculating the value of points for the specified lot sizes. The MT5 version is here  https://www.mql5.com/en/market/product/29230 Description by lines Line 1 - deposit currency. Line 2 - lot size (10 input parameters) . All further values are calculated into columns below each lot size. Line 3 - calculation of value for one point. Line 4 - calculation of value for spread. All subsequent lines - calculation of value for points (20 input parameters) . All you need t
FREE
CoralDash
D Armond Lee Speers
CoralDash is a simple symbol shortcut dashboard.   The Symbol List has many presets to choose from:  Market Watch Open Orders Current Chart Majors A custom list Clicking the symbol has two available actions Set the current chart symbol Filter the list of symbols shown in the dashboard based on one currency (e.g., see all EUR pairs) Click the "PAIR" cell in the header to toggle between the two available actions Click the symbol cell to apply the action For the filter, click the left side to selec
FREE
My Risk Management
Ahmad Aan Isnain Shofwan
My Risk Management The Risk Management Dashboard is a visual tool designed to help traders monitor risk exposure in real time. With a clear and compact layout, it provides an instant overview of trading activity, enabling more disciplined and informed decision-making. Key Features Active Symbol Summary Displays all traded symbols with the number of trades, total buy/sell lots, and current profit/loss. Per-Symbol Risk Analysis Calculates and shows the risk percentage of each symbol relative to
FREE
Show Pips
Roman Podpora
4.26 (58)
이 정보 표시기는 계정의 현재 상황을 항상 알고 싶어하는 사람들에게 유용합니다. 표시기는 포인트, 백분율, 통화 단위의 이익뿐만 아니라 현재 쌍의 스프레드와 현재 기간에서 막대가 마감될 때까지의 시간과 같은 데이터를 표시합니다. 버전 MT5 -   더욱 유용한 지표 차트에 정보선을 배치하는 데는 여러 가지 옵션이 있습니다. 가격 오른쪽(가격보다 뒤에 있음) 코멘트로(차트의 왼쪽 상단에 있음) 화면의 선택된 모서리에 있습니다. 정보 구분 기호를 선택할 수도 있습니다. | / . \ # 표시기에는 다음과 같은 단축키가 내장되어 있습니다. 키 1 - 정보 표시 유형으로 뒤로 이동(가격, 설명 또는 코너 오른쪽) 키 2 - 정보 표시 유형에서 앞으로 나아갑니다. 키 3 - 정보 라인 표시 위치 변경 단축키는 설정에서 다시 할당할 수 있습니다. 이 표시기는 사용하기 쉽고 매우 유익합니다. 설정에서 불필요한 정보 항목을 비활성화할 수 있습니다. 설정 표시된 정보를 교체하기 위한 단축키(뒤로
FREE
Toms Dashboard
Thomas Alexander Kevin Anderson
Dynamic Trading Dashboard for MT4 This powerful MT4 trading dashboard offers traders a comprehensive view of current and historical trading performance in an intuitive and visually organized format. With its precision-engineered design, the dashboard provides a seamless blend of real-time insights and historical analysis.  This trading dashboard is perfect for meticulous traders who seek a precise, all-encompassing tool to manage open and closed positions while gaining insights into past perform
FREE
FFx Awesome Oscillator
Eric Venturi-Bloxs
4 (1)
The purpose of this new version of the MT4 standard indicator provided in your platform is to display in a sub-window multiple timeframes of the same indicator. See the example shown in the picture below. But the display isn’t like a simple MTF indicator. This is the real display of the indicator on its timeframe. Here's the options available in the FFx indicator: Select the timeframes to be displayed (M1 to Monthly) Define the width (number of bars) for each timeframe box Alert pop up/sound/ema
FREE
Geo Info
Georgij Komarov
5 (3)
Geo_Info is one of the most informative indicators displaying net levels as well as basic data on a symbol and trading positions in a space-saving manner. displays brief data on the basic symbol parameters in the upper left corner of the chart: Swap for Buy order, swap for Sell order, current spread, margin, tick size, stop level, order freeze level . The data is shown for one lot in points. The data is displayed as follows: SWAP B:4.200 /S:-8.470 /SPR:342 /MRG:256.0/TCV:0.10/STL:0/FRL The data
FREE
Advanced Trade Information Dashboard –  MT4 Everything I need to know about my account and open positions, right on the chart. I got tired of clicking between the terminal, the trade tab, and the calculator just to check my margin, pip value, or total profit in pips. So I built this dashboard to put it all in one place. What It Shows Total P&L – Real profit/loss from the positions I care about (filter by symbol, magic number, or include swap/commission). Margin Level – The one number that k
FREE
Signal Alert
Roman Lomaev
SignalAlert 지표는 다른 지표에서 구매 및 판매 신호를 추적하고 신호가 발생하면 사운드 알림을 보내는 도구입니다. SignalAlert는 Binary Sixty Scalping과 같은 지표와 함께 사용할 때 빠르게 신호에 반응하는 데 유용합니다. 지표 설정: IndicatorName – SignalAlert가 신호를 읽을 지표의 이름을 지정합니다. 예를 들어, „Binary Sixty Scalping“을 정확히 입력하면 SignalAlert가 이 지표의 신호를 추적합니다. BuyBuffer – 구매 신호의 버퍼 번호를 지정합니다. 예를 들어, „Binary Sixty Scalping“의 구매 신호가 첫 번째 버퍼에 있으면 BuyBuffer = 0을 설정합니다. 다른 버퍼에 있으면 해당 번호를 지정합니다. SellBuffer – 판매 신호의 버퍼 번호를 지정합니다. 예를 들어, „Binary Sixty Scalping“의 판매 신호가 두 번째 버퍼에 있으면 SellBuffer
FREE
Strength Scalper Pro
Jose Ramon Miranda Ramos
3 (1)
PLEASE TAKE NOTICE: This indicator is in current development. final version will be free. This is a simple indicator that uses 3 timeframes in its formula to create Possible buy and sell signals. This indicator is optimized for the M1 timeframe Only. It has 2 types of Alerts: Push Notifications Audio Alerts UPDATES: 3/19/24: Still testing the final code Troubleshooting: When loading the indicator, if you don't see the arrows on the current chart that means that MT4 has not loaded all the high
FREE
Session High Low
Jerome Asiusin
This indicator help to mark the high and low of the session Asian,London,Newyork , with custom hour setting This indicator is set to count from minute candle so it will move with the current market and stop at the designated hour and create a accurate line for the day. below is the customization that you can adjust : Input Descriptions EnableAsian Enables or disables the display of Asian session high and low levels. EnableLondon Enables or disables the display of London session high and
FREE
BoxInside MT4
Evgeny Shevtsov
4.83 (6)
This indicator calculates the volume profile and places labels that correspond to the VAH, VAL and POC levels, for each candle individually. Indicator operation features The indicator works on the timeframes from M5 to MN, but it uses the history data of smaller periods: M1 - for periods from M5 to H1, M5 - for the H4 period, M30 - for the D1 period, H4 - for the W1 period, D1 - for the MN period. The color and location of the VAL, VAH and POC labels on the current candle are considered to be c
FREE
My Fibonacci
Ahmad Aan Isnain Shofwan
My Fibonacci An automated Fibonacci indicator that combines ZigZag swing detection with comprehensive Expert Advisor integration through a 20-buffer system. More details about data specification and EA integration: https://www.mql5.com/en/blogs/post/764109 Core Features Automated Fibonacci Detection The indicator identifies swing points using configurable ZigZag parameters and draws Fibonacci retracements and extensions automatically. It updates levels as new swing formations develop. Market Ad
FREE
App system signals
Pierre Paul Amoussou
APP System Signals 는 금융 시장에서 활발히 거래하는 사용자들을 위해 설계된 기술적 지표입니다. 이 도구는 지수 이동 평균(EMA), 단순 이동 평균(SMA) 및 추세 분석을 결합하여 과거 가격 움직임과 시장 구조를 기반으로 매수 및 매도 신호를 생성합니다. 모든 매개변수는 완전히 사용자 정의가 가능하여 각 사용자 개개인의 분석 스타일과 거래 방식에 맞게 조정할 수 있습니다. 이 지표는 다양한 시간 프레임에서 사용할 수 있으며, 주식, 외환, 암호화폐 등 다양한 금융 자산과 호환됩니다. 사용자 친화적인 인터페이스로 설계되어 초보자부터 경험이 풍부한 트레이더까지 모두 쉽게 사용할 수 있습니다. APP System Signals는 거래 전략에 쉽게 통합할 수 있으며, 차트 상에서 시각적인 표시를 제공하여 시장을 보다 명확히 분석할 수 있도록 돕습니다. 이 도구의 목적은 거래 결정을 위한 구조적인 기술적 지원을 제공하는 것이며, 특정 결과를 예측하거나 수익을 보장하는 것은
FREE
USDJPY Keltner Range M15 Strategy is a fully automated MetaTrader 5 strategy designed to capture structured breakout opportunities on USDJPY using daily directional confirmation, Keltner Channel reference levels, volatility-buffered pending STOP entries and simple fixed-risk management. The strategy is designed for USDJPY on the M15 timeframe. Its goal is to participate when the market shows directional intent through daily high or daily low behavior, while using Keltner Channel structure and
FREE
Delta AG Free
Yurij Kozhevnikov
5 (2)
The difference between the arithmetic and geometric means at the specified range. Since the greater is the difference between the values, the greater the resulting figure is, actually the indicator shows volatility fluctuations. The arithmetic mean of a certain number of values ​​is the sum of the values ​​divided by their number. The geometric mean is the root of the power of the number of values ​​extracted from the product of these values. If all values ​​are equal, the arithmetic mean and th
FREE
Symbols Spread panel
Andrii Miknevich
5 (1)
An indicator in the form of a panel for collecting statistics on spreads from a specified list of pairs. It is enough to open one chart and set an indicator to collect statistics for all specified pairs. After completion of work, the panel writes values to a file, which allows not to interrupt statistics after completion of work. Input parameters: -Interval to update the spread for pairs (sec) Allows you to specify how often to collect statistics (allows you to reduce the load) -List of pair
FREE
Gold & Silver Intermarket Overlay EMA    Is a professional multi-symbol indicator, designed to analyze the correlation between the current instrument and precious metals (XAUUSD and XAGUSD). The indicator overlays normalized gold and silver charts on top of the current instrument, allowing you to visually track in one window : market correlation divergences leading movements, relative strength of assets Used for intermarket analysis and market sentiment assessment (risk-on/risk-off). Key
FREE
FFx DeMarker
Eric Venturi-Bloxs
5 (2)
The purpose of this new version of the MT4 standard indicator provided in your platform is to display in a sub-window multiple timeframes of the same indicator. See the example shown in the picture below. But the display isn’t like a simple MTF indicator. This is the real display of the indicator on its timeframe. Here's the options available in the FFx indicator: Select the timeframes to be displayed (M1 to Monthly) Define the width (number of bars) for each timeframe box Alert pop up/sound/ema
FREE
이 제품의 구매자들이 또한 구매함
Genesis Matrix Pro is a professional multi-timeframe trend detection indicator designed to help traders identify high-quality market alignment with clarity and structure. It combines 12 different technical indicators into one visual alignment matrix, allowing traders to quickly see when market conditions are bullish, bearish, or neutral. A signal is generated only when the selected strategies are aligned, helping reduce noise and improve decision-making. PLEASE CONTACT ME AFTER PURCHASE TO GET
Gann Made Easy
Oleg Rodin
4.83 (163)
Gann Made Easy 는 mr.의 이론을 사용하여 최고의 거래 원칙을 기반으로 하는 전문적이고 사용하기 쉬운 Forex 거래 시스템입니다. W.D. 간. 이 표시기는 Stop Loss 및 Take Profit Levels를 포함하여 정확한 BUY 및 SELL 신호를 제공합니다. PUSH 알림을 사용하여 이동 중에도 거래할 수 있습니다. 구매 후 거래 방법 안내 및 유용한 추가 지표를 무료로 받으시려면 저에게 연락주세요! 아마도 Gann 거래 방법에 대해 이미 여러 번 들었을 것입니다. 일반적으로 Gann의 이론은 초보자 거래자뿐만 아니라 이미 거래 경험이 있는 사람들에게도 매우 복잡한 것입니다. Gann의 거래 방식은 이론적으로 적용하기 쉽지 않기 때문입니다. 나는 그 지식을 연마하고 Forex 지표에 최고의 원칙을 적용하기 위해 몇 년을 보냈습니다. 표시기는 적용하기가 매우 쉽습니다. 차트에 첨부하고 간단한 거래 권장 사항을 따르기만 하면 됩니다. 지표는 지속적으로 시장 분석
The Propfolio Master Suite is the ultimate all-in-one analytical workstation for professional traders. Combining the power of the Beat The Market Maker (BTMM) methodology, Smart Money Concepts (SND/Liquidity), and Advanced Volume Profile, this suite replaces multiple different indicators with one optimized engine. Monitor up to 14 pairs simultaneously from a single chart, instantly identify market cycles, and seamlessly map institutional footprints with the click of a button. The Command Center
Scalper Inside PRO
Alexey Minkov
4.74 (68)
Scalper Inside PRO Scalper Inside PRO is an intraday trend and scalping indicator for MetaTrader 4 that uses an exclusive algorithm to quickly detect market direction and key target levels. It automatically calculates entry, exit and multiple profit targets, and shows detailed performance statistics so you can see how different instruments and strategies performed. This helps you choose the most suitable trading instruments for the current market conditions. Additionally, you can easily integrat
M1 Sniper
Oleg Rodin
5 (23)
M1 SNIPER 는 사용하기 쉬운 거래 지표 시스템입니다. M1 시간대에 맞춰 설계된 화살표 지표입니다. 이 지표는 M1 시간대 스캘핑을 위한 단독 시스템으로 사용할 수 있으며, 기존 거래 시스템의 일부로도 사용할 수 있습니다. 이 거래 시스템은 M1 시간대 거래용으로 특별히 설계되었지만, 다른 시간대에도 사용할 수 있습니다. 원래는 XAUUSD와 BTCUSD 거래를 위해 이 방법을 설계했지만, 다른 시장 거래에도 유용하다는 것을 알게 되었습니다. 이 지표의 신호는 추세 방향과 반대로 거래될 수 있습니다. 저는 지표의 신호를 활용하여 양방향으로 거래할 수 있도록 돕는 특별한 거래 기법을 알려드립니다. 이 방법은 특별한 동적 지지선과 저항선 가격 영역을 활용하는 것을 기반으로 합니다. 구매하시면 M1 SNIPER 화살표 지표를 바로 다운로드하실 수 있습니다. 또한, 아래 스크린샷에 표시된 Apollo Dynamic SR 지표는 M1 SNIPER 도구를 사용하는 모든 사용자에게 무료로
PRO Renko System
Oleg Rodin
5 (30)
PRO Renko System 은 RENKO 차트 거래를 위해 특별히 고안된 매우 정확한 거래 시스템입니다. 이것은 다양한 거래 상품에 적용될 수있는 보편적 인 시스템입니다. 체계는 효과적으로 당신에게 정확한 반전 신호에 접근을 주는 소위 시장 소음을 중화합니다. 이 표시기는 사용하기가 매우 쉽고 신호 생성을 담당하는 매개 변수가 하나만 있습니다. 당신은 쉽게 당신의 선택의 어떤 무역 계기에 공구를 적응시킬 수 있고 renko 막대기의 크기. 나는 항상 당신이 내 소프트웨어로 수익성있게 거래 할 수 있도록 추가 지원을 제공 할 준비가되어 있습니다! 나는 당신에게 행복하고 수익성있는 거래를 기원합니다! 구매 후 저에게 연락하십시오! 내 렌코 차트 생성기를 보내드립니다. 또한 내 개인 권장 사항 및 시스템의 다른 모듈을 무료로 공유 할 것입니다!
NAM Order Blocks
NAM TECH GROUP, CORP.
3.67 (3)
MT4 Multi-timeframe Order Blocks detection indicator. Features - Fully customizable on chart control panel, provides complete interaction. - Hide and show control panel wherever you want. - Detect OBs on multiple timeframes. - Select OBs quantity to display. - Different OBs user interface. - Different filters on OBs. - OB proximity alert. - ADR High and Low lines. - Notification service (Screen alerts | Push notifications). Summary Order block is a market behavior that indicates order collection
Smart Price Action Concepts
Issam Kassas
4.77 (13)
우선적으로, 이 거래 도구는 전문적인 거래에 이상적인 비-다시 그리기 및 지연되지 않는 지표입니다.  온라인 강좌, 사용자 매뉴얼 및 데모. 스마트 가격 액션 컨셉트 인디케이터는 신규 및 경험 많은 트레이더 모두에게 매우 강력한 도구입니다. Inner Circle Trader Analysis 및 Smart Money Concepts Trading Strategies와 같은 고급 거래 아이디어를 결합하여 20가지 이상의 유용한 지표를 하나로 결합합니다. 이 인디케이터는 스마트 머니 컨셉트에 중점을 두어 대형 기관의 거래 방식을 제공하고 이동을 예측하는 데 도움을 줍니다.  특히 유동성 분석에 뛰어나 기관이 어떻게 거래하는지 이해하는 데 도움을 줍니다. 시장 트렌드를 예측하고 가격 변동을 신중하게 분석하는 데 탁월합니다. 귀하의 거래를 기관 전략에 맞추어 시장의 동향에 대해 더 정확한 예측을 할 수 있습니다. 이 인디케이터는 시장 구조를 분석하고 중요한 주문 블록을 식별하고 다양한
Quants HL Break
Ferhat Mutlu
5 (2)
LH 및 HL 브레이크아웃을 찾기 위한 순수 가격 조치에 의한 고급 계산. 그것은 당신에게 시장에서 큰 반전 포인트를 줄 것입니다.LH 및 HL 신호는 traingle 브레이크 아웃에도 사용할 수 있습니다. 브레이크 아웃이 발생하면 강한 반전을 나타냅니다. 이동 평균에 대한 좋은 필터입니다. 추세 지표와 함께 사용하는 것이 좋습니다. 지원 및 저항, 공급 수요 지표에 대한 추가 확인으로 사용할 수 있습니다. 자세한 내용은 다음 외환 스레드에서 찾을 수 있습니다. 표시기가 다시 칠해지지 않습니다. Buffers :   SetIndexBuffer ( 0 ,UpBar);      SetIndexBuffer ( 1 ,UpBar2);           SetIndexBuffer ( 2 ,DnBar);      SetIndexBuffer ( 3 ,DnBar2);           SetIndexBuffer ( 4 ,UpBarTop);      SetIndexBuffer ( 5 ,UpBa
Dynamic Forex28 Navigator
Bernhard Schweigert
4.43 (7)
Dynamic Forex28 Navigator - 차세대 외환 거래 도구. 현재 49% 할인. Dynamic Forex28 Navigator는 오랫동안 인기 있는 지표의 진화형으로, 세 가지의 힘을 하나로 결합했습니다. 고급 통화 Strength28 지표(695개 리뷰) + 고급 통화 IMPULSE with ALERT(520개 리뷰) + CS28 콤보 신호(보너스). 지표에 대한 자세한 정보 https://www.mql5.com/en/blogs/post/758844 차세대 Strength 지표는 무엇을 제공합니까?  원래 지표에서 좋아했던 모든 것이 새로운 기능과 더 높은 정확도로 강화되었습니다. 주요 기능: 독점적인 통화 Strength 공식.  모든 시간대에 걸쳐 부드럽고 정확한 강도선. 추세와 정확한 진입을 식별하는 데 이상적입니다. 역동적인 시장 피보나치 수준(시장 피보나치).  이 지표에만 있는 고유한 기능. 가격 차트가 아닌 통화 강도에 피보나치가 적용됩니다.
Auto Optimized Parabolic RSI: 고급 3D 모멘텀 엔진 대부분의 개인 투자자용 보조지표는 시장의 변동성이 변하는 순간 무용지물이 되는 정적인 입력값에 의존하기 때문에 실패합니다. Auto Optimized Parabolic RSI는 자체적인 수학적 우위를 지속적으로 재계산하여 "보조지표 노후화" 문제를 해결하며, 기관급 퀀트 트레이딩의 적응력을 귀하의 MT5 터미널에 직접 제공합니다. 핵심 이점: 맞춤형 인메모리 3D 최적화   표준 자동 최적화 도구들은 일반적인 보조지표 호출로 터미널에 과부하를 일으켜 MT5 플랫폼을 멈추게 하는 경우가 많습니다. 이 도구는 이러한 병목 현상을 완전히 우회합니다. 맞춤형 네이티브 RAM 기반 계산기로 구축된 내부 엔진은 차트를 로드하거나 타임프레임을 변경할 때마다 빛처럼 빠른 3D 그리드 검색을 실행합니다. RSI 기간(주기), SAR 스텝(가속도) 및 SAR 최대치(속도 제한)를 동시에 스캔하여 플랫폼 지연 없이 수만 개의
RFI levels PRO
Roman Podpora
5 (1)
이 지표는 추세 반전 지점과 가격 반등 영역을 정확하게 보여줍니다.       주요 투자자들   . 새로운 트렌드가 형성되는 곳을 파악하고 최대한 정확하게 의사결정을 내리며 모든 거래를 완벽하게 통제합니다. TREND LINES PRO   지표와 함께 사용할 때 최대의 잠재력을 발휘합니다.  VERSION MT5 지표가 보여주는 내용: 새로운 추세의 시작 시 활성화되는 반전 구조 및 반전 수준. 최소한의 위험 대비 수익률을 갖는 이익 실현   (TAKE PROFIT)   및   손절매(STOP LOSS)   레벨 표시       RR 1:2   . 지능형 손실 감소 로직이 적용된 손절매 기능. 지정된 지표에서 두 가지 추세 유형에 대한 반전 패턴을 표시합니다. 지표: 트렌드를 따라   트렌드 라인 프로   (글로벌 트렌드 변화) 트렌드 프로   (빠른 트렌드 변화) 간단하고 효과적입니다       스캐너       실시간 추세 (신규). 다중 시간 프레임 도구 필터링. 표시하다  
Trend Catcher ind
Ramil Minniakhmetov
트렌드 캐처 인디케이터 트렌드 캐처 인디케이터는 개발자가 자체 개발한 맞춤형 적응형 트렌드 분석 지표들을 조합하여 시장 가격 움직임을 분석합니다. 단기적인 노이즈를 제거하고 근본적인 모멘텀 강도, 변동성 확대, 가격 구조 움직임에 집중하여 진정한 시장 방향을 파악합니다. 또한 이동 평균, RSI, 변동성 필터와 같은 맞춤형 지표들을 활용하여 가격을 평활화하고 트렌드를 필터링합니다. 실제 운영 모니터링 및 기타 제품은 다음 링크에서 확인하실 수 있습니다: https://www.mql5.com/en/users/mechanic/seller 텔레그램에서는 EA나 설정 파일을 판매하지 않습니다. 사기이니 주의하세요. 모든 설정 파일은 블로그에서 무료로 제공됩니다. 중요! 구매 후 즉시 연락 주시면 사용 방법 및 보너스를 드립니다!
Apollo SR Master
Oleg Rodin
5 (2)
Apollo SR Master는 지지/저항 구간에서의 거래를 더욱 쉽고 안정적으로 만들어 주는 특수 기능을 갖춘 지지/저항 지표입니다. 이 지표는 지역 가격의 고점과 저점을 감지하여 시간 지연 없이 실시간으로 지지/저항 구간을 계산합니다. 새롭게 형성된 저항 구간을 확인하기 위해 지표는 해당 저항 구간을 실제 매도 또는 매수 신호로 활용할 수 있음을 나타내는 특수 신호를 표시합니다. 이 경우, 저항 구간의 강도가 높아지고, 따라서 저항 구간에서의 성공적인 거래 가능성도 높아집니다. 이것이 바로 이 지표의 핵심 아이디어입니다. SR 존은 손절매와 이익실현을 더욱 쉽게 할 수 있도록 해줍니다. 신호 방향에 따라 SR 존 위 또는 아래 공간을 손절매로 활용할 수 있습니다. 또한, 반대쪽 SR 존은 잠재적 이익실현 영역으로 활용할 수 있습니다. 또한 Apollo SR Master 지표를 사용하는 모든 사용자에게 "Apollo Price Action System" 지표를 무료로 제공합니다.
Grabber System
Ihor Otkydach
5 (2)
탁월한 기술적 지표인 Grabber를 소개합니다. 이 도구는 즉시 사용 가능한 “올인원(All-Inclusive)” 트레이딩 전략으로 작동합니다. 하나의 코드 안에 강력한 시장 기술 분석 도구, 매매 신호(화살표), 알림 기능, 푸시 알림이 통합되어 있습니다. 이 인디케이터를 구매하신 모든 분들께는 다음의 항목이   무료로   제공됩니다: Grabber 유틸리티: 오픈 포지션을 자동으로 관리하는 도구 단계별 영상 매뉴얼: 설치, 설정, 그리고 실제 거래 방법을 안내 맞춤형 세트 파일: 인디케이터를 빠르게 자동 설정하여 최고의 성과를 낼 수 있도록 도와줍니다 다른 전략은 이제 잊어버리세요! Grabber만이 여러분을 새로운 트레이딩의 정점으로 이끌어 줄 수 있습니다. Grabber 전략의 주요 특징: 거래 시간 프레임: M5부터 H4까지 거래 가능한 자산: 어떤 자산이든 사용 가능하지만, 제가 직접 테스트한 종목들을 추천드립니다 (GBPUSD, GBPCAD, GBPCHF, AUDCAD
Advanced Supply Demand
Bernhard Schweigert
4.91 (300)
현재 40% 할인! 초보자나 전문 트레이더를 위한 최고의 솔루션! 이 보조지표는 우리가 다수의 독창적 기능과 새로운 공식을 통합한 독특하고 고품질이며 저렴한 거래 도구입니다. 이 업데이트를 통해 이중 시간대를 표시할 수 있습니다. 더 높은 TF를 표시할 수 있을 뿐만 아니라 차트 TF와 더 높은 TF 모두를 표시할 수 있습니다: 중첩 영역 표시. 모든 Supply Demand 트레이더들이 좋아할 것입니다. :) 중요한 정보 공개 Advanced Supply Demand의 잠재력을 극대화하려면 다음을 방문하십시오. https://www.mql5.com/ko/blogs/post/720245   진입 또는 목표의 명확한 트리거 포인트를 정확히 찾아냄으로 해서 거래가 어떻게 개선될지 상상해 보십시오. 새로운 알고리즘을 기반으로 매수자와 매도자 간의 잠재적인 불균형을 훨씬 더 쉽게 분간할 수 있습니다. 왜냐하면 가장 강한 공급영역과 가장 강한 수요 영역과 과거에 어떻게 진행 되었는지를(이전
GoldRush Trend Arrow Signal
Kirk Lee Holloway
5 (2)
GoldRush 트렌드 화살표 신호 GoldRush 트렌드 화살표 신호 지표는 XAU/USD 시장에서 고속 단기 스캘핑 트레이더를 위해 설계된 정밀한 실시간 트렌드 분석을 제공합니다. 1분 시간대에 특화되어 설계된 이 도구는 명확한 진입점을 표시하는 방향성 화살표를 제공하여 스캘퍼들이 변동성이 높은 시장 환경에서도 자신 있게 거래할 수 있도록 합니다. 이 지표는 PRIMARY 및 SECONDARY 경고 화살표로 구성됩니다. PRIMARY 신호는 추세 방향의 변화를 나타내는 흰색과 검은색 방향성 화살표이며, SECONDARY 신호는 PRIMARY 화살표가 지시하는 방향을 확인하고 잠재적인 거래 진입점을 표시하는 파란색과 빨간색 화살표입니다. 참고: 추세 방향이 변경된 후 PRIMARY 경고 화살표가 단 하나만 표시될 경우, 다수의 SECONDARY 파란색/빨간색 화살표가 표시될 수 있음을 유의해야 합니다. SECONDARY 신호는 신호 기준을 충족하는 어떤 캔들 이후에도 표시
Introduction to Fractal Pattern Scanner Fractal Indicator refers to the technical indicator that makes use of the fractal geometry found in the financial market. Fractal Pattern Scanner is the advanced Fractal Indicator that brings the latest trading technology after the extensive research and development work in the fractal geometry in the financial market. The most important feature in Fractal Pattern Scanner is the ability to measure the turning point probability as well as the trend probabi
Currency Strength Wizard
Oleg Rodin
4.85 (59)
통화 강도 마법사는 성공적인 거래를 위한 올인원 솔루션을 제공하는 매우 강력한 지표입니다. 표시기는 여러 시간 프레임의 모든 통화 데이터를 사용하여 이 또는 해당 외환 쌍의 힘을 계산합니다. 이 데이터는 특정 통화의 힘을 확인하는 데 사용할 수 있는 사용하기 쉬운 통화 지수 및 통화 전력선의 형태로 표시됩니다. 필요한 것은 거래하려는 차트에 표시기를 부착하는 것뿐입니다. 표시기는 거래하는 통화의 실제 강세를 보여줍니다. 지표는 또한 추세와 거래할 때 유리하게 사용할 수 있는 구매 및 판매 거래량 압력의 극한값을 보여줍니다. 지표는 또한 피보나치에 기반한 가능한 대상을 보여줍니다. 표시기는 PUSH 알림을 포함한 모든 유형의 알림을 제공합니다. 구매 후 연락주세요. 나는 당신과 거래 팁을 공유하고 당신에게 무료로 훌륭한 보너스 지표를 줄 것입니다! 나는 당신에게 행복하고 유익한 거래를 기원합니다!
Advanced Currency Strength28 Indicator
Bernhard Schweigert
4.91 (657)
현재 40% 할인 초보자 또는 전문가 트레이더를 위한 최고의 솔루션! 이 지표는 우리가 독점 기능과 새로운 공식을 통합했기 때문에 독특하고 고품질이며 저렴한 거래 도구입니다. 단 하나의 차트로 28 Forex 쌍의 통화 강도를 읽을 수 있습니다! 새로운 추세 또는 스캘핑 기회의 정확한 트리거 포인트를 정확히 찾아낼 수 있기 때문에 거래가 어떻게 개선될지 상상해 보십시오. 사용 설명서: 여기를 클릭  https://www.mql5.com/en/blogs/post/697384 그것이 첫 번째, 원본입니다! 쓸모없는 지망생 클론을 사지 마십시오. 더 스페셜  강력한 통화 모멘텀을 보여주는 하위 창의 화살표 GAP가 거래를 안내합니다! 기본 또는 호가 통화가 과매도/과매도 영역(외부 시장 피보나치 수준)에 있을 때 개별 차트의 기본 창에 경고 표시가 나타납니다. 통화 강도가 외부 범위에서 떨어질 때 풀백/반전 경고. 교차 패턴의 특별 경고 추세를 빠르게 볼 수 있는 다중 시간
Cycle Sniper
Elmira Memish
4.39 (36)
Please contact us after your purchase and we will send you the complimentary indicators to complete the system Cycle Sniper is not a holy grail but when you use it in a system which is explained in the videos, you will feel the difference. If you are not willing to focus on the charts designed with Cycle Sniper and other free tools we provide, we recommend not buying this indicator. We recommend watching the videos about the indiactor and system before purchasing. Videos, settings  and descri
Market Structure Patterns MT4
Samuel Manoel De Souza
5 (18)
Market Structure Patterns   is an indicator based on   smart money concepts   that displays   SMC/ICT   elements that can take your trading decisions to the next level. Take advantage of the   alerts ,   push notifications   and   email messages   to keep informed from when an element is formed on the chart, the price crosses a level and/or enters in a box/zone. Developers can access the values of the elements of the indicator using the   global variables  what allows the automation of trading d
구매 후 저에게 연락하여 이 지표를 기반으로 한 보너스 EA를 받으십시오. Self Optimizing Double MA Strategy는 파라미터 추측을 없애기 위해 설계된 전문가 수준의 트레이딩 도구입니다. 내장된 자동 최적화 엔진으로 구동되며, 통계적 우위를 유지하기 위해 백그라운드에서 수천 개의 파라미터 조합을 시뮬레이션하여 변화하는 시장 조건에 지속적으로 적응합니다. 정적이고 구식인 설정에 의존하는 대신, 이 인디케이터는 자체 로직을 동적으로 업데이트하여 현재 시간대와 종목에 가장 수익성 있는 구성을 찾습니다. 주요 기능 내장된 자동 최적화: 시스템은 단기 MA, 장기 MA 및 RSI 기간을 주기적으로 다시 계산하여, 선택한 업데이트 빈도에 따라 설정이 항상 현재 시장 리듬과 일치하도록 보장합니다. MA 다이버전스 필터: 이동평균선이 활발하게 발산(확장)할 때만 시그널을 검증하는 핵심 추세 강도 지표입니다. 이는 평균선이 수렴하거나 평탄한 횡보장에서는 잘못된 진입을 방지합
Day Trader Master
Oleg Rodin
5 (15)
Day Trader Master 는 데이 트레이더를 위한 완벽한 거래 시스템입니다. 시스템은 두 개의 지표로 구성됩니다. 하나의 지표는 매수 및 매도를 위한 화살표 신호입니다. 얻을 수 있는 화살표 표시기입니다. 2차 지표를 무료로 드립니다. 두 번째 지표는 이러한 화살표와 함께 사용하도록 특별히 설계된 추세 지표입니다. 표시기는 반복하지 않고 늦지 않습니다! 이 시스템을 사용하는 것은 매우 간단합니다. 2색 선으로 표시되는 현재 추세 방향의 화살표 신호를 따라가기만 하면 됩니다. 파란색은 구매 추세입니다. 빨간색은 판매 추세입니다. 파란색 화살표는 매수 신호입니다. 빨간색 화살표는 매도 신호입니다. 추세선의 색상과 일치하려면 화살표의 색상과 신호의 방향이 필요합니다. 화살표 표시기는 주로 시간 간격 M5 및 M15에서 일중 거래를 위해 만들어졌습니다. 그러나 기술적으로 시스템은 다른 시간 간격으로 사용할 수 있습니다. 표시기에는 PUSH 메시지 기능이 있는 팝업 경고가 장착되어 있
Candle Power Pro
Thushara Dissanayake
4.5 (8)
그만큼       캔들 파워 프로       디코딩하도록 설계된 정교한 거래 도구입니다.       실제 거래량 압박, 틱 데이터 불균형, 기관 주문 흐름 역학       측정하여       황소 진드기와 곰 진드기의 싸움       실시간으로. 이 지표는 원시       볼륨 데이터를 실행 가능한 통찰력으로 변환하여   트레이더가 식별할 수 있도록 돕습니다.       스마트 머니 움직임, 유동성 탐색 및 숨겨진 시장 심리학       각 가격 캔들 뒤에 있는       구매자/판매자 볼륨 비율, 분기 패턴 및 볼륨 기반 확인을   통해 격차를 해소합니다.       가격 변동 및 볼륨 분석은   거래자에게 매우 중요합니다.       ICT, SMC 및 기관 거래 방법론   . 기존의 볼륨 지표와 달리,       캔들 파워 프로       에 초점을 맞춘다       각 캔들의 움직임이 기초 자산과 일치하는지 여부를 보여주는   틱 데이터 세분성       황소/곰의 힘  
외환 거래를 한다면, 통화 강도와 통화쌍 상관관계에 대한 상세한 정보를 아는 것은 거래 실력을 한 단계 끌어올리는 데 큰 도움이 됩니다. 상관관계를 분석하면 리스크를 절반으로 줄일 수 있고, 강도 분석을 통해 수익을 극대화할 수 있습니다. 이 지표는 통화 강도 분석과 통화쌍 상관관계를 결합하여 가장 적합한 통화쌍을 선택할 수 있도록 도와주는 하이브리드 접근 방식을 제공합니다. 통화 강도 분석 활용 방법 예를 들어, 당신의 거래 전략이 AUD/JPY 매수 기회를 제공한다고 가정해 봅시다. 하지만 KT 통화 강도 분석을 통해 JPY가 AUD보다 강해지고 있다는 것을 발견했다면, 이 거래는 손실로 끝날 가능성이 높습니다. 이 지표를 사용하면 이러한 손실을 쉽게 피할 수 있습니다. 통화쌍 상관관계 활용 방법 또 다른 예로, 거래 전략이 NZD/USD와 GBP/JPY 두 통화쌍 모두에 대해 매도 기회를 제공한다고 가정해 봅시다. KT 통화쌍 상관관계 분석을 사용하면 이 두 통화쌍 간 상관
CRT Candle Range Theory HTF MT4.   Ultimate CRT Indicator: Advanced ICT Concepts and Malaysian SnR Trading System Discounted   Price   $50  !!     Secure your lifetime access   now   before it switches to   subscription-only ! Master the Market Maker's Footprints with the Most Advanced Candle Range Theory Indicator Unlock the true power of   Smart Money Concepts (SMC)   and trade precisely like the institutions with the   Ultimate CRT Indicator . Built exclusively for serious traders, this indic
Route Lines Prices - 은 가격 방향을 찾는 데 사용되는 지표입니다. 간단한 인터페이스에는 가격 움직임 및 미래 방향 계산을 위한 다양한 알고리즘이 포함되어 있습니다. 이러한 알고리즘에는 사용된 시간대에 따른 변동성 계산 및 가격 평활화 기능이 있습니다. 이 지표는 " Calculating price values " 값을 변경하는 단일 매개변수를 제공합니다. 기본값인 1은 균형 잡힌 자동 계산을 제공하며, 별도의 설정 없이 바로 사용할 수 있습니다. 2에서 500 사이의 값을 수동으로 변경하여 자신만의 거래 시스템에 맞게 지표를 맞춤 설정할 수 있습니다. 이 지표는 M1부터 H4까지의 시간대에서 사용을 권장합니다. 모든 거래 상품에 적용 가능합니다. 신호 화살표는 캔들 종가에 생성되며, 과거 차트에는 다시 그려지지 않습니다. 메인 차트에 동일한 화살표가 표시됩니다. 다양한 유형의 알림을 사용할 수 있으며, 내장된 라인 궤적 카운터는 종가를 기반으로 작동합니다. 이는
Master head and shoulders patterns for better trading decisions A head and shoulders pattern is a chart formation that resembles a baseline with three peaks, the outside two are close in height and the middle is highest. It predicts a bullish-to-bearish trend reversal and is believed to be one of the most reliable trend reversal patterns. It is one of several top patterns that signal, with varying degrees of accuracy, that a trend is nearing its end. [ Installation Guide | Update Guide | Trouble
CRYSTAL HEIKIN ASHI SIGNALS MT4 Professional Trend Detection Indicator with Smart Entry Signals See the Trend. Catch the Move. Trade with Confidence. The professional Heikin Ashi indicator built for traders who want clarity, precision, and EA-ready signal automation. WHAT IS CRYSTAL HEIKIN ASHI SIGNALS? Crystal Heikin Ashi Signals is a professional-grade MetaTrader 4 indicator that combines pure Heikin Ashi candle visualization with an advanced momentum-shift detection system. Designed for both
제작자의 제품 더 보기
SpectorMA
Sergii Krasnyi
5 (1)
차트의 시각적 측면을 향상시킬 뿐만 아니라 활기차고 역동적인 특성을 부여하는 지표를 소개합니다. 이 인디케이터는 하나 이상의 이동평균(MA) 인디케이터를 조합한 것으로, 지속적으로 색상이 변하면서 흥미롭고 다채로운 모습을 연출합니다. 이 제품은 그래픽 솔루션이므로 텍스트에서 수행하는 작업을 설명하기가 어렵고 제품이 무료 일뿐만 아니라 다운로드하면 더 쉽게 볼 수 있습니다. 이 인디케이터는 비디오 편집을 위해 차트의 아름다운 그림을 만들고 싶은 블로거 또는 차트를 생동감 있고 화려하게 만들고 싶은 트레이더에게 적합합니다. MA 선의 색상 팔레트는 무지개처럼 변경되거나 무작위로 변경됩니다(설정된 매개 변수에 따라 다름). MA 지표는 "MA 기간" 매개변수의 단계를 유지하여 독립적으로 정렬되므로 아름다운 그림을 만들 수 있습니다. 이 표시기는 또한 MA 기간을 지속적으로 변경할 수 있으므로 차트에 생동감과 역동성의 효과를 만들 수 있습니다.  관심을 가져주셔서 감사합니다. 좋은
FREE
ScreenshotScript
Sergii Krasnyi
이 표시기는 트레이딩 터미널에서 차트의 스크린샷을 편리하고 빠르게 만들 수 있도록 설계되었습니다. 차트를 특정 디렉토리에 저장하는 과정을 크게 단순화하여 한 번의 클릭으로 활성화되는 차트에 버튼이 있는 편리한 인터페이스를 제공합니다. 인디케이터의 주요 기능은 다음과 같습니다: 버튼을 누르면 차트 스크린샷이 자동으로 생성됩니다. 스크린샷을 저장할 디렉토리를 선택할 수 있습니다. 하나의 차트에서 여러 개의 인디케이터가 작동하는 경우 스크린샷을 구분하기 위한 사용자 지정 접두사. 파일 형식 선택: PNG 또는 GIF. 하나의 차트에서 버튼이 겹치지 않고 여러 개의 지표 인스턴스 지원. 인디케이터 매개변수: 디렉토리 - 스크린샷을 저장할 폴더입니다. 접두사 - 파일을 구분할 수 있는 스크린샷 이름의 접두사입니다. 확장자 - 파일 형식(PNG 또는 GIF). 스크린샷은 “MQL\Files\” 폴더에 있습니다.
FREE
SpectorChart
Sergii Krasnyi
This indicator continuously, smoothly changes the color of candlestick edges and bodies, as well as the color of volumes in real time like a lamp. The indicator is easy to use. The palette of colors is diverse. This product is a graphical solution, so it is difficult to describe what it does by text, it is easier to see by downloading it, besides the product is free. The indicator is suitable for bloggers who want to create a beautiful picture of a chart for video editing or traders who want to
FREE
ZoomChart
Sergii Krasnyi
The ZoomChart indicator displays data from other timeframes on the current chart in the subwindow, acting as a magnifying glass or, conversely, shrinking the chart to display larger timeframes. The ZoomChar indicator automatically tracks the current outermost bar on the chart and moves with the chart as it shifts. The indicator can display data from another financial instrument, not limited to the main chart instrument. The robot carries the function of “mirroring” - The ability to convert c
FREE
ChartOverlay
Sergii Krasnyi
ChartOverlay indicator has two main functions 1. mirroring - i.e. for example, it will make USDEUR from EURUSD 2. displaying the price chart of the selected financial instrument (with selected period)  in the subwindow of the main chart. This tool allows traders to easily analyze the relationship between different currency pairs and assets, offering unique customization and visualization features. Key Features: Price Chart Display: The indicator displays the price chart of the selected instrume
FREE
ZoomChart2
Sergii Krasnyi
The ZoomChart indicator works with two charts - the current chart on which it is launched and the next one. The indicator translates the second chart to the time where the first one is now. Thus, the second chart depicts the same situation on the first chart (where the indicator is launched), but on a different time-frame. In other words, this indicator serves as a magnifying glass or, on the contrary, reduces the chart to display the situation on a larger time-frame. The ZoomChar indicator au
FREE
SpreadChartOscillator is an indicator that displays the spread line of a symbol in the subwindow of the oscillator. In the parameters it is possible to specify another symbol from which the spread line will be broadcast. If the "Symbol" parameter is left empty, the spread line will be displayed from the current symbol on which the indicator is set. This tool is ideal for traders who want to see the spread dynamics in the oscillator format and use it to protect themselves from entering the market
FREE
TickChartOscillator   is an indicator that displays a symbol's tick chart in an oscillator subwindow. It offers flexible customization options, including: ·   The ability to hide the price line in the oscillator. ·   The option to specify a different symbol for tick chart display. If the "Symbol" parameter is left blank, the tick chart will be shown for the current symbol where the indicator is applied. This tool is perfect for traders who want to view tick dynamics in an oscillator format and u
FREE
필터:
Maxim Bazuev
321
Maxim Bazuev 2024.09.20 08:32 
 

사용자가 평가에 대한 코멘트를 남기지 않았습니다

리뷰 답변