 MetaTrader 5
 Experts
 지표
지표
 라이브러리
라이브러리
 유틸리티
유틸리티
 위젯
위젯
 규칙
규칙
MetaTrader 4용 새 기술 지표
 아래 나열된 기술 지표의 시그널은 MetaTrader 4 플랫폼의 거래를 열고 종료하는 데 중요한 역할을 합니다.
지표의 본질은 가격 변화를 예측하기 위한 금융 시그널 값의 수학적 변형입니다.
아래 나열된 기술 지표의 시그널은 MetaTrader 4 플랫폼의 거래를 열고 종료하는 데 중요한 역할을 합니다.
지표의 본질은 가격 변화를 예측하기 위한 금융 시그널 값의 수학적 변형입니다. 
Break and Retest Hunter MT4 is a powerful MetaTrader 5 indicator designed to automatically identify support and resistance levels, breakout structures, and potential retest opportunities in real time. Bonus Indicator: After purchasing Break and Retest Hunter , contact me to receive Trade Indicator Assistant EA completely free as a bonus utility.
$65 for the next 10 copies . Next price is $120. Combining adaptive market analysis, clear BUY/SELL signals, Fibonacci-based profit targets, and a pre

Currency Pulse — MetaTrader 4용 통화 강약 순위 패널 용도 Currency Pulse는 차트 위의 하나의 콤팩트한 패널에서 지금 어떤 통화가 강하고 어떤 통화가 약한지를 여러 시간대에 걸쳐 동시에 보여 줍니다. 이 순위를 바탕으로 통화 간 괴리가 가장 큰 통화쌍을 알려 줍니다. 강한 통화를 매수하고 약한 통화를 매도하는 방식입니다. 인디케이터는 적용된 차트의 종목과 무관하게 작동합니다. MT5 -version: https://www.mql5.com/en/market/product/200977
작동 방식 선택한 통화들은 활성화한 각 시간대에서 서로 비교되어 강한 순서대로 정렬됩니다. 색상 막대는 움직임의 크기를 나타냅니다. Total 열은 모든 시간대를 각 통화의 하나의 종합 점수로 합칩니다. Open chart 열은 순위에서 가장 유망한 통화쌍(강한 통화 대 약한 통화)을 골라 방향(buy 또는 sell)을 표시합니다. 행을 클릭하면 차트가 열립니다. 사용

Elliott Live 는 MetaTrader 5용 인디케이터로, 과거 차트와 현재 봉 모두에서 엘리엇 파동을 자동으로 표시합니다. 완성된 파동은 실선으로, 형성 중인 파동은 점선과 물음표 라벨(예: "3?")로 그려지며, 피보나치 목표 구간과 무효화 레벨도 함께 표시됩니다. MT5-version: https://www.mql5.com/en/market/product/200604
작동 방식 먼저 스윙(ZigZag)을 만듭니다. 가격이 극값에서 ATR × 배수 이상 되돌림하면 반전으로 인식합니다. 마지막 점은 현재의 극값으로, 아직 확정되지 않았으며 움직일 수 있습니다. 이 스윙 위에서 엘리엇 규칙에 따라 충격파 1-2-3-4-5를 찾습니다. 2파는 1파의 시작점을 넘지 않고, 3파는 가장 짧은 파동이 되지 않으며, 4파는 1파의 영역에 들어가지 않습니다. 충격파 다음에는 조정파 A-B-C를, 그다음에는 다음 충격파를 찾습니다. 최근 스윙이 패턴의 일부(예: 1-2)만 이루고 있으

SAYON Performance PRO MT4 is a professional statistics dashboard for MetaTrader 4.
One window, everything about your account: 8 key indicators, balance and equity chart, real equity drawdown, profit calendar, hours, weekdays, long vs short, symbols and advanced statistics. Export the full report to Excel with one click. Launch price – the price will increase soon. It is an indicator: it works on any chart, next to any Expert Advisor. It does not trade and does not change anything on your account

데모 계좌는 당신에게 거짓말을 하고 있습니다. 데모 계좌에서는 주문이 요청한 가격 그대로 체결됩니다. 실계좌에서는 그렇지 않습니다. 뉴스 시간에는 스프레드가 벌어지고, 수수료는 쌓이며, 슬리피지가 모든 거래를 조금씩 갉아먹습니다. 그리고 이 중 어느 것도 MetaTrader 내역에 분명하게 나타나지 않습니다. TravaRisco Real Cost Monitor는 이 종목을 거래하는 데 실제로 얼마의 비용이 드는지 차트 위에 보여줍니다. 표시 항목 1. 스프레드 현재 스프레드: 포인트, 가격, 기준 랏 기준 금액 평균 스프레드: 최근, 현재 시간대, 전체 스프레드가 비정상적으로 높으면 빨간색으로 표시 2. 거래당 비용 (진입 + 청산) 평균 스프레드 비용 거래당 수수료 (내역에서 자동 계산 또는 수동 설정) 평균 슬리피지: 요청 가격과 체결 가격의 차이를 본인의 주문으로 측정 계좌 통화 기준 거래당 총비용 "손익분기점에 도달하려면 가격이 유리한 방향으로 X 포인트 움직여야 합니다" 3
FREE

랏 크기를 더 이상 짐작하지 마세요. TravaRisco Lot Calculator는 선택한 리스크에 맞는 정확한 랏을 차트에 바로 표시합니다. 작동 방식: 패널에 리스크(%)와 손절(포인트)을 입력하면 지표가 즉시 계산합니다: 리스크 금액(계좌 통화 기준) 해당 손절 시 1랏당 손실 브로커의 거래량 단위에 맞춰 반올림한 정확한 랏 반올림 후 실제 리스크 외환, 금, 지수, 암호화폐에서 작동하며 사용 중인 브로커의 틱 가치를 사용합니다. 패널은 영어 또는 포르투갈어를 지원합니다. 거래를 열지 않으며 계산만 합니다. 매개변수: Risk per trade: 거래당 리스크, 잔고 대비 %(기본값 1%) Default stop loss: 초기 손절 포인트(기본값 200) Language: 패널 언어(영어 또는 포르투갈어) X position / Y position: 차트 내 패널 위치 Background color: 패널 배경색 프롭 펌 챌린지를 위한 일일 손실 잠금이 필요하신가요? Tra
FREE

런치 패드 런던과 뉴욕 개장 후 돌파, 재시험으로 확인
런던과 뉴욕 개장 첫 한 시간은 하루의 흐름을 결정짓는 중요한 시간입니다. 가격이 횡보세를 형성하다가 이를 돌파하는 경우가 많은데, 이때 대부분 다시 되돌아와 저항선을 테스트한 후 추가 상승을 시도합니다. 반대로, 일부 돌파는 거짓으로 판명되어 다시 횡보세로 돌아가기도 합니다.
런치 패드는 돌파와 재시험, 이 두 단계를 모두 기다립니다. 횡보세를 벗어나는 첫 번째 캔들이 나타나자마자 바로 진입하지 않고, 가격이 돌파 후 저항선으로 되돌아왔다가 다시 돌파 방향으로 움직일 때까지 기다립니다.
주요 기능
두 가지 거래 시간: 런던과 뉴욕, 각각 활성화 또는 비활성화 가능 자동 일광 절약 시간제 적용: 연중 내내 각 거래 시간은 현지 거래소 시간을 기준으로 설정됩니다. 브로커 시간 자동 감지: 모든 브로커의 서버 시계와 연동되며, 플랫폼 재시작 후에도 정확한 시간을 유지합니다. 수동으로 시간 차이를 설정할 수도 있습
FREE

Adaptive Volume Profile 최근 봉의 볼륨 프로파일(Volume Profile)을 차트 위에 바로 그립니다: 컨트롤 포인트(POC), 가치 영역(VAH / VAL), 고거래량 노드(HVN), 저거래량 노드(LVN), 그리고 선택 가능한 거래량 히스토그램. 가격 행의 크기가 현재 변동성(ATR)에 맞게 조정되므로, 어떤 종목과 시간대에서도 프로파일이 읽기 쉽게 유지됩니다. 주요 기능 POC - 창 안에서 거래량이 가장 많은 가격 수준 Value Area (VAH / VAL) - 선택한 비율의 거래량을 포함하는 가격 범위(기본 70%) HVN / LVN - 고거래량·저거래량 노드(가격이 정체되거나 빠르게 움직이는 경향이 있는 수준)로, 프로파일의 평균 거래량을 기준으로 통계적으로 판별합니다. 인접한 행은 하나의 구간으로 병합되어 차트가 깔끔하게 유지됩니다 적응형 행 너비 - 가격 행은 ATR로 크기가 정해지며 최대 행 수로 제한됩니다 실시간 롤링 프로파일 - 새 봉마다
FREE

Order Block Mitigation Tracker 은(는) 오더 블록(Order Block)을 찾아 차트에 색상 구역으로 그려 줍니다. 오더 블록은 시장 구조를 깨뜨린 움직임이 시작된 캔들로, 상승 돌파 직전의 가장 낮은 캔들 또는 하락 돌파 직전의 가장 높은 캔들입니다. 많은 트레이더가 이 영역을 가격이 되돌아올 때 반응할 수 있는 지점으로 관찰합니다. 인디케이터는 블록을 표시하고 오른쪽으로 연장하며, 가격이 그 블록에 어떻게 반응하는지 추적합니다. 가격이 미티게이션(mitigation)할 때까지 블록은 열린 상태로 유지됩니다. 기능 상승 블록 - 돌파된 스윙 고점과 그것을 돌파한 캔들 사이에서 저가가 가장 낮은 캔들 하락 블록 - 돌파된 스윙 저점과 그것을 돌파한 캔들 사이에서 고가가 가장 높은 캔들 캔들 종가 기준 돌파 - 스윙에 닿기만 하는 꼬리는 돌파로 인정되지 않습니다 블록을 만드는 돌파 선택 가능 - 모든 돌파, CHoCH만(추세 반대, 반전 가능성) 또는 BoS만
FREE

Gotobi Day and Tokyo Fixing Marker MT4 는 MetaTrader 4 차트에 일본의 고토비(五十日), 도쿄 픽싱 시각, 일본 은행 휴일을 표시하고, 다음 고토비를 작은 패널에 보여 주는 무료 인디케이터입니다. 고토비는 매월 5일, 10일, 15일, 20일, 25일과 말일입니다. 이 날이 주말이나 일본 은행 휴일과 겹치면 그 전의 도쿄 영업일로 앞당겨집니다. 많은 일본 기업이 이 날에 대금을 결제하며, 일본 은행들이 일본 시간 09:55에 정하는 기준 환율인 도쿄 픽싱은 특히 USDJPY에서 주목받습니다. USDJPY용으로 만들었지만 모든 종목과 시간 프레임에서 작동합니다. 고토비의 도쿄 픽싱 전후로 거래하거나 그런 아이디어를 테스트할 때, 또는 단순히 다음 고토비가 언제인지 알고 싶을 때 유용합니다. 표시 내용 고토비 : 도쿄의 하루를 덮는 음영 띠(또는 세로선)와 "Gotobi 15", "Gotobi 20 (moved)" 같은 라벨. 툴팁에는 어느 날짜분
FREE

Fair Value Gap Fill Tracker 은(는) 공정가치갭(Fair Value Gap, FVG, 불균형이라고도 함)을 찾아 차트에 색상 구역으로 그려 줍니다. 공정가치갭은 첫 번째와 세 번째 캔들의 꼬리가 겹치지 않는 3캔들 패턴으로, 가운데 캔들이 가격이 매우 빠르게 지나간 구간을 남깁니다. 인디케이터는 이 구간을 표시하고 오른쪽으로 연장하며, 가격이 그 구간에 어떻게 반응하는지 추적합니다. 가격이 이를 채울 때까지 구역은 열린 상태로 유지됩니다. 기능 상승 갭 - 세 번째 캔들의 저가가 첫 번째 캔들의 고가보다 높음; 구역은 이 두 가격 사이에 위치합니다 하락 갭 - 세 번째 캔들의 고가가 첫 번째 캔들의 저가보다 낮음; 구역은 이 두 가격 사이에 위치합니다 ATR(14)의 배수로 설정하는 최소 갭 크기 - 작고 중요하지 않은 갭은 모든 심볼과 시간대에서 자동으로 걸러집니다 세 가지 채움 규칙 - 구역을 관통하는 꼬리, 구역을 관통하는 종가, 또는 첫 접촉 채워진 구역
FREE
Multi Timeframe Average True Range 는 작업 중인 차트에 모든 시간대의 변동성(ATR)을 표시합니다. 예를 들어 M1 차트에서 M15 또는 H1 ATR을 볼 수 있습니다. 실제로 거래하는 시간대의 변동성에 맞춰 손절, 목표가, 필터를 설정하세요. 주요 기능 모든 차트에서 선택한 시간대의 변동성 표시 (M1 ~ MN1) 표준 ATR 또는 NATR (절사 ATR): 평균을 내기 전에 가장 큰 True Range(또는 양쪽 극값)를 제외하므로, 뉴스 캔들 하나가 값을 부풀리지 않습니다 NATR과 비교할 수 있도록 표준 ATR을 보여 주는 선택형 두 번째 선 “Closed bar only” 모드: 선택한 시간대의 마지막 마감된 봉의 값. 봉 내부에서 변하지 않으며 다시 그려지지 않습니다 가격 단위(표준 ATR과 동일) 또는 포인트 단위로 표시 “늘어남” 방지 기능: 차트 시간대가 선택한 시간대보다 크면 차트 시간대로 계산합니다 (끌 수 있음) 선택한 시간대의 히스
FREE

BoS and CHoCH Market Structure 는 시장 구조를 차트에 직접 표시합니다: 스윙 고점과 저점, Break of Structure(BoS), Change of Character(CHoCH). 스윙은 양쪽으로 선택한 수의 봉 중에서 가장 높거나 가장 낮을 때 확정됩니다. 캔들이 마지막 스윙을 넘어 종가로 마감하면 인디케이터는 스윙에서 돌파한 캔들까지 선을 그리고 라벨을 붙입니다. 돌파가 현재 추세 방향이면 BoS, 추세에 반대 방향이면 CHoCH입니다. 기능 BoS (Break of Structure) - 현재 추세 방향으로 마지막 스윙을 넘어서는 종가(추세 지속) CHoCH (Change of Character) - 현재 추세에 반대 방향으로 마지막 스윙을 넘어서는 종가(방향 전환 가능성) 캔들 종가 기준 돌파 - 꼬리가 스윙에 닿기만 한 경우는 돌파로 계산하지 않습니다 상승과 하락 이벤트를 서로 다른 색상으로 표시 ; 네 가지 이벤트 유형(상승 BoS, 상승 C
FREE

Pivot Points Classic and Camarilla 는 클래식 피벗 레벨(P, R1-R3, S1-S3)과 Camarilla 레벨(H1-H4, L1-L4)을 차트에 직접 그려 줍니다. 레벨은 선택한 시간대(기본값 D1)의 이전 기간의 고가, 저가, 종가로 계산되며, 각 기간은 해당 기간 동안 수평선으로 그려지므로 이전 며칠, 몇 주, 몇 달 동안 가격이 레벨에 어떻게 반응했는지 볼 수 있습니다. 기능 클래식 피벗 - 중심 피벗 P와 세 개의 저항선(R1-R3), 세 개의 지지선(S1-S3) Camarilla 피벗 - H1-H4 및 L1-L4의 여덟 개 레벨; Camarilla 트레이더가 가장 주목하는 레벨이므로 H3/L3와 H4/L4는 더 굵게 그려집니다. 클래식에서는 피벗 P와 바깥쪽 레벨 R3/S3가 더 굵습니다 Classic, Camarilla 또는 둘 다 를 같은 차트에 표시; Classic 선은 실선이고 Camarilla 선은 기본적으로 점선 스타일입니다(선 스타일
FREE

MT4용 외환 지표 "8개 종목 CCI", 리페인트 없음. ........................................................... - CCI는 가장 인기 있는 오실레이터 중 하나입니다. - 상품 채널 지수(CCI)는 현재 가격과 과거 평균 가격의 차이를 측정합니다. - 주요 레벨: +/-200. - +200 이상에서는 매도 진입, -200 이하에서는 매수 진입에 적합합니다. - "8개 종목 CCI"를 사용하면 하나의 차트에서 최대 8개 종목의 CCI 값을 제어할 수 있습니다. - 이 지표는 가격 변동 진입과도 함께 사용하기에 매우 좋습니다. Click here to see high quality Trading Robots and Indicators! MQL5 웹사이트에서만 제공되는 오리지널 제품입니다.

MT4용 Crypto_Forex 지표 "Micro M 및 Micro W 패턴 Pro"는 리페인트나 지연 없이 사용할 수 있습니다. - "Micro M 및 Micro W 패턴 Pro" 지표는 가격 변동 거래에 매우 강력한 지표입니다. - 이 지표는 차트에서 Micro M 패턴과 Micro W 패턴을 감지합니다. - 상승 Micro W - 차트에 파란색 화살표 신호(그림 참조). - 하락 Micro M - 차트에 빨간색 화살표 신호(그림 참조). - PC 및 모바일 알림 기능이 내장되어 있습니다. - "Micro M 및 Micro W 패턴 Pro" 지표는 지지/저항선과 함께 사용하기에도 매우 좋습니다. - 모든 시간대에서 사용할 수 있습니다. - 추세 변화 또는 추세 조정의 종료 시점을 감지하는 데 매우 유용한 지표입니다. - 지표에 정보 표시 기능이 있어 해당 통화쌍의 현재 스프레드와 스왑을 표시합니다. - 계좌 잔액, 자본금, 증거금도 표시됩니다. - 정보 표시는 차트의 어느 모서

ApexConverge 는 삼각형 패턴(상승형, 하락형, 대칭형)을 자동으로 찾아 경계선과 음영 영역을 그리고, 돌파한 봉에 화살표를 표시하는 MetaTrader 5용 인디케이터입니다. MT5-version: https://www.mql5.com/en/market/product/200424
작동 방식 인디케이터는 스윙 고점과 저점을 찾아 이를 지나는 두 개의 추세선을 긋고 형태를 검증합니다. 상단이 수평이고 하단이 상승하면 상승형 삼각형, 상단이 하락하고 하단이 수평이면 하락형, 기울기가 비슷한 두 선이 수렴하면 대칭형입니다. 돌파 전까지 가격은 패턴 안에 머물러야 합니다. 패턴은 몇 개의 봉이 지난 뒤에 나타나며( Swing confirmation (bars after) 참조), 확정된 신호는 다시 그려지지 않습니다. 매매 활용법 상승형 (수평 저항): 보통 상방 돌파를 주시합니다. 하락형 (수평 지지): 보통 하방 돌파를 주시합니다. 대칭형 : 중립이며, 돌파 방향을 따라 매매

MT4용 Crypto_Forex 이동평균 가속도( Moving Average Acceleration ) 지표 (리페인트 없음). MA Acceleration은 'MA Speed' 지표의 보조 도구로 설계된 스캘핑용 지표입니다. 이 지표는 물리학 방정식을 기반으로 계산되며, 이동평균선의 가속도를 표시합니다. MA Acceleration을 활용하면 기존의 표준 전략도 한층 더 발전시킬 수 있습니다. SMA, EMA, LWMA 등 다양한 이동평균 유형에 적용 가능합니다. MA Acceleration은 해당 이동평균의 2차 미분값에 해당합니다. 이 지표는 MA Speed 지표의 값이 얼마나 빠르게 변하는지를 보여줍니다. MA Acceleration 값이 0 미만이면 하락 방향으로 가속도가 증가하는 것이며, 0 초과이면 상승 방향으로 가속도가 증가하는 것입니다. 주요 추세 방향으로의 빠른 스캘핑 전략에 MA Speed 지표와 함께 사용하는 것을 권장합니다(MA Speed 값이 0
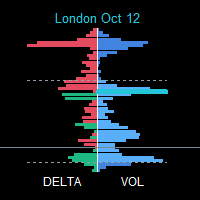
SessionFlowMap — POC 레벨이 포함된 멀티 세션 거래량·델타 프로파일 SessionFlowMap은 외환 거래일의 각 세션(아시아, 런던, 뉴욕, 그리고 선택 사항으로 시드니와 사용자 지정 세션)에 대해 거래량 프로파일과 델타 프로파일(매수와 매도의 불균형)을 만들어 차트에 표시합니다. 각 세션마다 POC(Point of Control, 가장 많이 거래된 가격)와 Value Area(VAH와 VAL, 거래량 대부분이 모인 구간)를 찾아 이 레벨들을 수평선으로 오른쪽으로 연장합니다. 각 세션에서 시장이 어디에 시간과 자금을 썼는지, 어떤 레벨이 다시 중요해질 수 있는지 한눈에 볼 수 있습니다. MT5-version: https://www.mql5.com/en/market/product/200942
작동 방식 각 세션은 고유한 시간대에 따라 M1 히스토리에서 잘라냅니다. 아시아, 런던, 뉴욕, 시드니의 시간은 GMT로 설정하며 브로커의 서버 시간으로 자동 변환됩니다. 사

MQLTeam Currency Power 는 두 통화를 한 차트에 놓고 어느 쪽이 앞서는지 보여 줍니다. 히스토그램은 바스켓의 차이입니다. 표는 그 차이를 끌어당기는 통화쌍을 보여 줍니다. 준비된 예는 유로 대 달러입니다. 두 이름과 통화쌍 목록을 바꾸면 같은 읽기가 어떤 두 통화에도 적용됩니다. 값은 핍입니다. 기본 측정은 빠른 이동평균과 느린 이동평균 사이의 거리입니다. 더 짧은 보기가 필요할 때 캔들 읽기 두 가지가 있습니다. 같은 지표가 MetaTrader 4 와 MetaTrader 5 에서 동작합니다. 읽는 법 표의 각 행은 1열의 통화쌍과 그에 대응하는 2열의 통화쌍입니다. 양수는 그 통화가 그 행에서 앞서 있다는 뜻입니다. Gap 은 통화 1에서 통화 2를 뺀 값입니다. 차이가 음수면 통화 2가 앞서고, 양수면 통화 1이 앞섭니다. 행은 이렇게 읽습니다. EUR −11, USD +17, Gap −28. 달러가 앞서고, 차이가 그 폭입니다. 맨 아래 줄은 바스켓 전체의 세

ValueOrbit은 현재 기간의 '적정 가격'이 어디에 있는지, 그리고 시장이 그로부터 얼마나 멀어졌는지를 보여줍니다. 상황 파악용 도구로, 중앙선 Value Core와 그 주위의 세 쌍의 오빗(±1σ, ±2σ, ±3σ)을 그리며, 패널에서 가격이 얼마나 늘어났는지 알려줍니다. 진입 신호는 제공하지 않습니다. MT5-version: https://www.mql5.com/en/market/product/201292
작동 방식 Value Core는 각 기간(세션, 주, 월)이 시작될 때부터 형성되고, 새 기간이 시작되면 다시 시작되는 기준 레벨입니다. 오빗은 이 레벨로부터의 표준 거리를 σ 단위로 표시합니다. 가격이 코어에 가까울수록 시장은 균형 상태이고, 멀어질수록 과도하게 늘어난 상태입니다. 기간이 바뀔 때 수직 점프가 생기지 않도록 선이 끊깁니다. 사용 방법 차트에 적용하고 투자 스타일에 맞게 Value Anchor를 선택합니다. 데이트레이딩(M1–H1)은 Session, 스

AI ZONE RADAR — 가격 영역으로 보는 지지와 저항 사용하는 플랫폼에 맞는 버전을 선택하세요 이 상품은 MT4 버전이며, MT5 버전도 있습니다. MT5 버전 상품 보기 MT4와 MT5는 별도 Market 상품입니다. 이번 구매에는 선택한 플랫폼용 제품만 포함됩니다. 신호와 함께 가격의 위치도 확인하세요 매수 신호가 나왔지만 바로 위에 저항이 있지는 않나요? 눌림처럼 보이는데 가까운 지지는 어디에 있나요? 선을 더 많이 그린다고 이런 질문이 항상 쉬워지지는 않습니다. AI ZONE RADAR는 주변 가격 영역과 상대 강도를 한 화면에 모아 신호가 나타난 위치를 확인하도록 돕습니다. AI ZONE RADAR는 MetaTrader 4용 차트 분석 지표입니다. 패널, 상태 메시지와 툴팁은 Market의 11개 언어를 지원하며 자동 또는 수동으로 전환할 수 있습니다. English / Russian / Chinese (Simplified) / Spanish / Portuguese

Crypto_Forex 지표 HTF DeMarker for MT4. - 이 지표는 기술 거래자가 진입 및 종료 지점을 찾는 데 사용하는 유용한 도구입니다. HTF는 - Higher Time Frame을 의미합니다. - DeMarker 오실레이터 라인은 이전 최고가와 최저가에 대한 현재 가격 위치를 나타냅니다. - DeMarker는 다른 오실레이터 중에서 가장 효율적인 정기적 발산 신호를 제공합니다. - 매수 과다 영역은 DeMarker가 0.7 이상일 때이고 매도 과다 영역은 DeMarker가 0.3 미만일 때입니다. - 지표에는 모바일 및 PC 알림이 내장되어 있습니다. - 이 지표는 가격 액션 항목이 있는 다중 시간 프레임 거래 시스템 또는 다른 지표와 함께 사용하기에 매우 좋습니다. - HTF DeMarker 지표를 사용하면 더 높은 시간 프레임의 DeMarker를 현재 차트에 첨부할 수 있습니다 --> 이는 전문적인 거래 방식입니다. Click here to see high

MT4용 Crypto_Forex 지표 "행잉 맨 패턴", 리페인트 없음, 지연 없음. - "행잉 맨 패턴" 지표는 가격 변동 거래에 매우 강력한 지표입니다. - 이 지표는 차트에서 하락세 행잉 맨 패턴을 감지합니다. 차트에 빨간색 화살표 신호가 나타납니다(그림 참조). - PC, 모바일 및 이메일 알림 기능을 제공합니다. - "행잉 맨 패턴" 지표는 지지/저항선과 함께 사용하기에 매우 좋습니다. ............................................................................. Click here to see high quality Trading Robots and Indicators! 본 제품은 MQL5 웹사이트에서만 제공되는 오리지널 상품입니다.

MT4용 외환 지표 "INFO Spread Swap Display", 트레이딩 보조 도구. - INFO Spread Swap Display 지표는 부착된 외환 쌍의 현재 Spread와 Swap을 보여줍니다. - 또한 계정 잔액, 자본 및 마진을 나타냅니다. - 차트의 어느 모서리에서나 지표 값을 찾을 수 있습니다. - 색상과 글꼴 크기도 설정할 수 있습니다. ............................................................................. Click here to see high quality Trading Robots and Indicators! 본 제품은 MQL5 웹사이트에서만 제공되는 정품입니다.

Fulcrum Value Profile는 MetaTrader 4용 지표로, 세션마다 틱 거래량 프로파일을 만들고 POC(Point of Control)와 밸류 에어리어를 표시하며, 형성 중인 POC/VAH/VAL을 선으로 그리고, 아직 닿지 않은 POC(naked POC)를 추적하며, 확정 봉에서 두 가지 셋업을 표시합니다: 이전 밸류 에어리어로의 재진입(80% 규칙)과 그 밖에서의 수용(돌파). 주문을 열거나 수정하거나 청산하지 않습니다. 빠른 시작 M5, M15 또는 M30 차트에 지표를 적용합니다. Profile Period = Daily session을 유지하거나 Custom session window를 선택하고 Custom Session Start / Custom Session End를 브로커 서버 시간(시장 감시 창의 시계)으로 설정합니다. 몇 초 안에 최근 완료된 5개 세션이 수평 히스토그램으로 그려지고 카드에 ABOVE VALUE, INSIDE VALUE 또는 BELO

Correlation Radar PRO — Multi-Asset Correlation Dashboard for MetaTrader 4 Short Description: Eliminate market noise and spot price divergences in seconds. Correlation Radar PRO calculates historical, monthly, weekly, and real-time correlations across multiple assets and lets you overlay candles directly on your chart without switching your main symbol. Full Description: Manually switching charts to understand inter-market relationships wastes precious time and leads to missed setups. Correlatio

Every ICT idea in one indicator - market structure, order blocks, fair value gaps, premium / discount and OTE, liquidity sweeps, killzones and SMT - added up into one confluence score, with alerts, a multi-symbol scanner, and a table that tests the signals on your own chart. ICT Pro Honest Stats draws all of it on your chart, checks every closed candle against nine ICT factors, shows the bullish and bearish score in a panel, marks the candles where enough factors line up at an order block or fai

ZZ Impulse helps you see market structure without noise. The indicator builds a ZigZag that separates impulse and correction legs, highlights the last impulse , and draws classic Fibonacci retracement levels (38.2 / 50 / 61.8) plus the Base of that impulse. Optional higher-timeframe candles can be shown on the current chart. What you get ZigZag with Impulse / Correction colouring (or classic mode) Adjustable sensitivity Fib levels on the last impulse: 38.2, 50, 50, 61.8 + Base Higher-timeframe
FREE

SMC Super position - Smart Money Structure & Liquidity Intelligence Professional multi-module market structure, liquidity and trade-planning indicator for MetaTrader 5, designed to combine structural analysis, liquidity behavior, trend context and confirmed signal logic in one compact workspace. The system includes Smart Money structure tools, an independent Master Signal engine, Confluence setups, Scalping analysis, Queen Trend context, multi-timeframe routing and an integrated Signal History d

ATR Stops is an MT4 indicator that shows the size of market volatility. It helps you decide where to place your stop-loss and take-profit, so you avoid the loss from an oversized stop or the profit drawdown from an oversized target. A very practical indicator. Main features A one-line data panel that tells you the size of the volatility A stop-loss reference line that helps you quickly place your stop A take-profit reference line that helps you quickly place your target Parameters ATRPeriod - AT
FREE

WaveForce Linreg Channel draws a linear regression channel on the last N bars, with deviation bands at ±1σ and ±2σ (TradingView-style layout). Features Center regression line ±1σ solid bands, ±2σ dotted bands Adjustable lookback (20–2000 bars) Adjustable σ multipliers, colours and width Optional ray to the right Optional chart label (off by default) How to use Attach to any chart. Set the number of bars for the channel. Tune ±1σ / ±2σ multipliers if needed. Note
This is an analytical tool, not
FREE

ZZ Impulse PRO is an authoring toolkit for reading market structure: two independent fractal ZigZags, Classic and Impulse/Correction modes, non-standard period candles, and full panel control — on a single chart. Concept The market speaks on both lower and higher scales at once. A typical ZigZag often keeps only one of those voices. ZZ Impulse PRO delivers controlled structure : two markups with separate settings, two ways to read waves, a flexible multiplier, and HTF/synthetic candles overlaid

WaveForce PSAR MTF plots Parabolic SAR calculated on a timeframe you choose and maps it onto the chart you are viewing. Features SAR from Chart, M1, M5, M15, M30, H1, H4, D1, W1 or MN1 Adjustable acceleration step and maximum Colour, size and arrow code for dots Two display modes: fill every chart bar (default) show dots only on the open of the SAR timeframe How to use Attach to any chart. Select the SAR timeframe (e.g. H1 on an M15 chart). Fine-tune step / maximum if needed. Note
This is an an
FREE

WPR MTF shows Williams Percent Range for the current chart and optional higher or lower timeframes in a single subwindow. Features Up to 8 %R lines at once (Chart, M1–MN) Adjustable period, colours, styles and widths Classic levels at −20 and −80 Optional text panel with latest values (off by default) How to use Attach to any chart. Enable the timeframes you need (e.g. Chart + H1 + H4). Watch overbought / oversold zones together across timeframes. Note
This is an analytical tool, not an auto-tr
FREE

TimeZone Clock is a tiny MT4 indicator that answers one question at a glance: what is the broker time converted to my local time? On the chart it looks like this: LOCAL 23:58:43 | SERV 15:58:43 | 10-02 SERV is the terminal server time, LOCAL is your own clock, and the trailing MM-DD is the server date. This little tool is useful when you want to describe trades or choose a time period to trade in terms of your local time. Features Local time, server time, server date Time accurate to the second
FREE

CrowdTrap MultiAsset Liquidity MT4 CrowdTrap MultiAsset Liquidity is a technical analysis indicator for MetaTrader 4 designed to identify market structure, liquidity levels, liquidity sweeps, price retests, and potential trading scenarios. The indicator combines multi-timeframe market structure analysis with price action and liquidity-based analysis. Main Features Market Structure Analysis Uses H1, H4, and D1 market data to assess directional bias and identify Break of Structure (BOS) and Change

PRL Levels is a MetaTrader 4 indicator that displays structured and evenly spaced psychological price levels directly on the chart. It is designed to make price structure easier to read visually. It does not open, manage or close trades.
The indicator can be used on Forex symbols, indices and CFDs. Distances are entered in conventional pips for Forex and in direct price units for indices and CFDs. The appropriate unit is detected automatically from the symbol specifications provided by the bro

AlphaTrend Pullback Pro MT4 Trend-following pullback signals, economic news filter, and professional dashboard — all in one indicator. AlphaTrend Pullback Pro transforms trend and correction analysis into clear, actionable visual signals. It identifies the macro market direction on a higher timeframe, waits for a pullback to the moving average, confirms rejection with a trend-aligned close, and triggers the entry point. No repainting on closed bars, no noise, no complexity. Why AlphaTrend Pullba

Enigma Cipher Enigma Cipher is a technical analysis indicator designed to help traders identify potential bullish and bearish market reversals through price pressure, momentum and multiple confirmation conditions. The indicator evaluates the relationship between recent price behaviour and the current signal candle. Additional filters can be enabled to refine the analysis and reduce signals that do not meet the selected conditions. How It Works Enigma Cipher first evaluates market pressure and pr

*Strong Hosoda Pro - Versione M15 GRATUITA*
Strong Hosoda Pro è un indicatore di tendenza e livelli basato sul metodo originale Ichimoku Hosoda.
Questa è la versione GRATUITA, funzionante solo sul timeframe M15. È completamente funzionale per testare la strategia.
*Caratteristiche principali:* - Chiare frecce di ACQUISTO/VENDITA con avviso Livelli dinamici di Take Profit - Grafico pulito, nessuna rielaborazione dopo la chiusura della barra - Basato sulla logica di Tenkan, Kijun, Senkou Spa
FREE

TIRED OF FALSE SIGNALS AND DISAPPEARING ARROWS?
Test the logic of Trend Reverting PRO completely for FREE on EURUSD (M5 & M15) and see the accuracy for yourself!
Hey trader, I know how frustrating it is to look at a beautiful chart history, only to realize the indicator changes its mind during live trading. That’s why I want you to test my algorithm completely risk-free. This is a fully functional free/demo version designed specifically for EURUSD on the M5 and M15 timeframes (works with sta
FREE

Smart Band Classic An adaptive multi-layer trading indicator combining dynamic price zones, intelligent BUY and SELL signals, and professional chart visualization in one streamlined MetaTrader 5 workspace. Smart Band Classic is a technical analysis indicator designed to help traders navigate market movements, recognize potential trading opportunities, and evaluate price behavior through a clean and coordinated visual environment. The indicator brings together an adaptive band system and a propri
FREE

Price Action Scanner PRO is a multi-symbol and multi-timeframe candlestick pattern scanner for MetaTrader 4 . The indicator helps traders save time by monitoring multiple instruments and identifying recent Price Action formations from a single chart. Detected patterns are displayed in a compact dashboard , with direct navigation to the corresponding signal candles. Supported Price Action Patterns The scanner detects five candlestick formations: Pin Bar — bullish and bearish candles with a promi

SMC LEGENDS $56 NOW → $66 NEXT | Price +$10 every 10 copies sold | MT5 VERSION HERE . updates posted regularly | DON'T MISS IT! SMC LEGENDS is a professional institutional-grade Smart Money Concepts (SMC) trading engine for MetaTrader 5 . combining market structure analysis, TPO Market Profile, auto signal alerts, live trade management, and a full trading command center in one indicator. Core Features # Fea

this indicator Draws Two Trend Lines automatically. my intend of use is :- 1 . For Buy Entry Make sure The Blue trend line is in Upward and Trending and also the Redline is in Horizontal.
2 . For Sell Entry Make sure the Red Line is in Downward and its Trending and also the Blueline is in Horizontal.
3. use caution, Technical confirmations is needed always. any info please submit a message.

This is MT4 indicator that automatically finds Edge of Trend where it makes Draw Down.
Examples
1 . Buy if The Two trend lines align up
2. Sell if the two trend lines align down
you can also make likes these
1. Buy if drawdown line is (yellow line) that upwards and Trend (Blue line) is Down 2. Sell if drawdown line is (yellow line) that downwards and the Trend (Blue line) is up
for any comments and contats submit message.

Nexus Trend Pulse – Trend & Signal Indicator for MT4/5 Nexus Trend Pulse is a visual trend analysis and trading signal indicator developed for MetaTrader 4/5. It combines dynamic trend zones, directional signals, stop reference lines, and entry level visualization in one chart interface. Designed for traders who prefer a clear and organized trading environment, Nexus Trend Pulse helps identify market direction, observe price reactions, and recognize potential trading opportunities without overcr

Quantum Enigma Quantum Enigma is a technical analysis indicator based on market structure and price action. It is designed to identify potential Bullish and Bearish setups around established price ranges. The indicator analyses market conditions and can apply several configurable confirmation and filtering conditions before displaying a signal. This allows traders to adjust the balance between signal frequency and selectivity according to their preferred trading approach. How It Works Quantum En

Channel Pro MT4 Identify high-probability reversal zones with a single glance. Channel Pro MT4 combines a dynamic volatility channel with a color-coded momentum trend line to help traders spot potential price reversals before they develop. When price briefly breaks outside the channel and snaps back, the indicator marks the event with a clear arrow signal directly on the chart — no separate window needed. Key Features Non-repainting — all signals are confirmed on the closed bar only Upper and lo

Mechanical Support Resistance automatically identifies potential support and resistance levels using vertical price profiles built from historical Open, High, Low, and Close (OHLC) prices. Most mechanical support and resistance indicators identify levels based on obvious price swings on the chart. Mechanical Support Resistance takes a different approach by analyzing the vertical distribution of OHLC prices to reveal support and resistance levels that are difficult to identify manually through vi

Renko Chart Pro MT4 is a practical Overlay/Panel Renko indicator designed to give traders a cleaner way to read price action without leaving the standard chart environment. Unlike many Renko tools that require separate offline charts or complicated setups, this indicator displays a fully configurable Renko panel directly inside your active MT4 chart .
You no longer need to have endless offline charts which makes shifting through instruments cleaner and more efficient. This is not an indicator I

TraderDesk is an institutional-grade financial spreadsheet and account metrics dashboard meticulously engineered for professional portfolio managers, proprietary firm traders, and systemic asset growth monitors. By integrating a state-of-the-art Time-Weighted Split-Period Capital Engine , TraderDesk transforms your chaotic chart canvas into a beautifully structured, clean financial workspace. It automatically filters out standard candlestick noise, grid line clutter, and price scale bars, allow

*Strong Hosoda Pro - Edizione COMPLETA - Premium*
Strong Hosoda Pro è un indicatore professionale di trend e livelli basato sul metodo originale Ichimoku Hosoda, sviluppato per trader esperti.
Questa è la versione Premium COMPLETA, valida per tutti i tempi, da M1 a D1. Nessuna restrizione.
*Perché Premium?* A differenza degli indicatori standard, combinazione direzione del trend, tempistica di ingresso e livello di take profit in un unico sistema chiaro, basato sulla logica completa dell'Ich

GT Direction Dashboard — Comprehensive User Manual & Technical Guide 1. Executive Summary & Core Purpose The GT Direction Dashboard is a multi-timeframe, multi-metric currency alignment dashboard built for MetaTrader 4. It is designed to solve one of the greatest challenges manual currency traders face: Analysis Paralysis and Information Overload . Rather than manually switching across 6 or 8 timeframe charts ( MN1 down to M5 ) and adding 4 or 5 separate indicators (RSI, ADX, PBR, Volatility, RO

TrendLine Support Resistance with Alerts MT4 Trade the Breakout. Catch the Move. Take your technical analysis to the next level with TrendLine Support Resistance with Alerts , a MetaTrader 4 indicator designed for traders who focus on trendline breakouts. Identify potential trading opportunities with trendlines drawn directly on your chart and clear BUY and SELL arrows that help you spot possible breakout signals. KEY FEATURES Trendline Breakout Signals — Identify potential bullish and bear

MACD MTF Timeframe Independent Colorized is a MetaTrader 4 indicator designed to make MACD momentum easier to read while allowing the MACD calculation timeframe to be completely independent from the chart timeframe. Unlike a standard MACD that always follows the timeframe of the active chart, this indicator can calculate its values from a separately selected timeframe. For example, you can keep an M5 chart open while displaying an H1 or H4 MACD, making it useful for multi-timeframe analysis with
FREE

Know the direction. Know the plan. Know when to stand aside. CS Trend Pro turns a busy chart into a clear decision. It shows which way the market is moving and marks the moment that changes. With every signal it gives you a complete plan: where to enter, where the idea is wrong, and where to take profit. It is built for swing traders and scalpers who move with the swing: take a part of the profit at each target, and stay in for as long as the move lasts. Built on volatility and on support and re

Most FVG indicators draw boxes. This one also checks whether the boxes work. ICT Fair Value Gap FVG Honest Stats draws every fair value gap on your chart and measures, on that chart's own history, how often price came back to a gap and how often the gap held, next to fake boxes of the same size. Free, part of the Honest Stats series. MT5 version | ICT Killzones Honest Stats MT4 (free) | ICT Liquidity Levels Honest Stats MT4 (free) | ICT SMT Divergence Honest Stats MT4 (free) | TrueRisk Trade Pan
FREE

Most killzone indicators draw boxes. This one also checks whether the boxes work. ICT Killzones Honest Stats for MetaTrader 4 draws the four ICT killzones (Asia, London open, New York open, London close) and measures on your own chart how often the day's high or low really formed inside each one, next to what pure chance would give, and how often the London Judas swing really reverses. Free, part of the Honest Stats series. MT5 version | ICT FVG Honest Stats MT4 (free) | ICT Liquidity Levels Hon
FREE

Most liquidity indicators draw the lines. This one also checks whether price respects them. ICT Liquidity Levels Honest Stats draws the levels ICT traders watch: previous day high and low, previous week high and low, and the Asian range high and low. A table measures on your own chart how often price reached each level and how often it turned back there, next to random lines nearby. Free, part of the Honest Stats series. MT5 version | ICT Killzones Honest Stats MT4 (free) | ICT FVG Honest Stats
FREE

Most SMT indicators mark the divergences. This one also checks whether they work. ICT Correlation SMT Divergence Honest Stats compares your chart with a related market (gold with silver, EURUSD with GBPUSD, BTC with ETH, US500 with US100) and marks every SMT divergence. A table measures on your own chart whether price turned after an SMT more often than after a normal new high or low. Free, part of the Honest Stats series. MT5 version | ICT Killzones Honest Stats MT4 (free) | ICT FVG Honest Stat
FREE

Daily Trend Confluence Scanner Daily Trend Confluence Scanner is a systematic multi-indicator trend-following tool designed to spot high-probability trade setups while filtering out market noise. By evaluating market conditions strictly on completed daily candle closes (shift = 1), this indicator provides reliable, non-repainting signals based on four layers of technical confirmation. Key Features 100% Non-Repainting: All calculations freeze upon daily candle close (shift = 1), eliminating

Signal Confirm watches one symbol and tells you when a trend setup has passed a fixed chain of checks. It works on any symbol and any chart timeframe. It reads only the M1 prices, the prices of the oscillator timeframe (M5 by default) and the daily prices your terminal already has, does not use any server, does not send anything out, and does not open, change or close orders. It shows what happened and when; the decision stays with you. What It Does When the chain below is complete, the indicato

QCL RSI Flow Candles — MetaTrader 4 QCL RSI Flow Candles transforms RSI momentum into smoothed Heikin Ashi-style candles in a separate indicator window. Candle bodies, wicks, a directional trend line and reference zones provide a visual framework for assessing momentum, pullbacks and changing conditions. Key Features RSI-based candles: View momentum through candle structure instead of a conventional RSI line. Directional colors: Green candles indicate that the oscillator close is at or above its

Order blocks from any timeframe, with alerts - and a table that tells you honestly whether they work on your chart. ICT Order Blocks Honest Stats draws order blocks from this or a higher timeframe, marks each one fresh, tested or broken, alerts you when price comes back to a fresh block, and measures on your chart's own history how often the blocks held next to fake zones of the same size. Part of the Honest Stats series. Market Structure MT4 | MT5 version | Free: FVG Honest Stats | Free: Liquid

ICT market structure from any timeframe - HH, HL, LH, LL, every BOS and CHoCH, with alerts - and a table that measures how often price really followed each break on your chart. ICT Market Structure Honest Stats labels every swing high and low, draws each break of structure (BOS) and change of character (CHoCH), shows the levels the next break needs, alerts you the moment a new break forms, and measures on your chart's own history how often price went on in the break's direction compared with ran

Multi Oscillator Divergence MT4 – RSI, CCI, MACD, OBV, Stochastic & AO
Multi Oscillator Divergence MT4 는 하나의 강력한 도구에서 6가지 인기 기술 오실레이터를 사용하여 트레이더가 상승 및 하락 다이버전스를 식별할 수 있도록 설계된 고급 Forex divergence indicator 입니다. 여러 지표를 번갈아 사용할 필요 없이, 이 MT4 Divergence Indicator 는 RSI, CCI, MACD, OBV, Stochastic 및 Awesome Oscillator (AO)를 분석하여 잠재적인 다이버전스와 여러 지표의 확인 신호를 차트에서 직접 명확하게 확인할 수 있도록 제공합니다.
Key Features 1. 하나의 인디케이터에 6개의 오실레이터
하나의 MT4 인디케이터에서 RSI, CCI, MACD, OBV, Stochastic 및 AO 를 사용하여 다이버전스를 탐지합니다.

Pivot Tide — 파동 피벗, 자동 추세선, 추세선 기반 추세 방향 판단 Pivot Tide 는 MetaTrader 4용 인디케이터입니다. 차트를 자동으로 파동 단위로 나누고, 각 파동의 고점과 저점에 마커를 표시하며, 이를 이어 추세선을 그리고, 추세선의 상태로 추세 방향을 판단합니다. 모든 내용은 차트 위에 바로 표시되며, 간결한 정보 패널도 함께 제공됩니다. 모든 종목, 모든 시간 프레임에서 사용할 수 있습니다. MT5-version: https://www.mql5.com/en/market/product/199662
기능 파동을 감지합니다. 파동은 두 이동평균선의 관계로 정의됩니다. 빠른 SMA와 느린 LWMA입니다. 빠른 선이 느린 선 위에 있는 동안은 상승 파동, 아래에 있는 동안은 하락 파동입니다. 피벗을 표시합니다. 파동이 끝나면(이동평균선이 교차하면) 그 극값에 마커를 놓습니다. 상승 파동의 고점 또는 하락 파동의 저점입니다. 추세선을 그립니다. 연속된 같은

Wave Markers: 적응형 웨이브 맵과 멀티 타임프레임 대시보드 노이즈가 아닌 시장의 진짜 구조를 보세요. 확정된 스윙 고점과 저점, 이를 잇는 추세선, 그리고 M1부터 W1까지 모든 시간대의 상황을 하나의 패널에서 확인할 수 있습니다. 이 인디케이터는 무엇인가요 Wave Markers는 MetaTrader 5용 차트 구조 인디케이터입니다. 가격의 전환점(스윙 고점과 스윙 저점)을 찾아 깔끔한 화살표로 표시하고, 그 주변에 실용적인 도구를 제공합니다. 추세선, 전체 시간대 표, 그리고 실시간 스프레드와 스왑 표시입니다. "매수"나 "매도" 지시는 내리지 않으며, 어떤 결과도 약속하지 않습니다. 한 가지 일을 꼼꼼하게 합니다. 시장이 실제로 어디에서 반전했는지 보여 주어, 구조를 더 빠르고 일관되게 읽을 수 있도록 돕습니다. MT5-version: https://www.mql5.com/en/market/product/199158 흔한 ZigZag와 다른 이유 전통적인 ZigZa
123456789101112131415161718192021222324252627282930313233343536373839404142434445464748495051525354555657585960616263646566676869707172737475767778798081828384858687888990919293949596979899100101102103104105106107108109110111112113114115116117118119120121122123124125126127128129130131132133134135136137138139140141142143144145146147148149150151152153154155156157158159160161162163164165166167168169170171172173174175176
MetaTrader 마켓은 과거 데이터를 이용한 테스트 및 최적화를 위해 무료 데모 거래 로봇을 다운로드할 수 있는 유일한 스토어입니다.
어플리케이션의 개요와 다른 고객의 리뷰를 읽어보시고 터미널에 바로 다운로드하신 다음 구매 전 트레이딩 로봇을 테스트해보시기 바랍니다. 오직 MetaTrader 마켓에서만 무료로 애플리케이션을 테스트할 수 있습니다.
