MetaTrader 4용 새 기술 지표 - 64
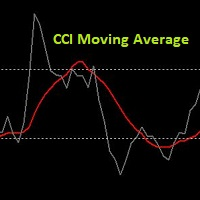
It's a very simple indicator. This is simply the CCI moving average. The CCI Moving Average Indicator allows us to reduce false signals and optimize our trading. The required indicator inputs are: CCI Period, CCI Applied Price, Period of CCI Moving Average and Method of CCI Moving Average. The chart displays the original CCI and its moving average. This is my first indicator that I publish. I hope the indicator will benefit you. The author of this indicator is Tomasz Buliński.
FREE

The Hurricane Cave Indicator shows different trade areas based on price action. It looks in the past and works out patterns that can enforce support and resistance as targets. When price breaks out of a trade area you can target just inside the next trade area. If you can't see the target just go to a slower time frame, it means the price hasn't been there for a long time. The Hurricane Cave Indicator is designed to be an add on to The Hurricane Forex Indicator also available in the Meta Trader
FREE
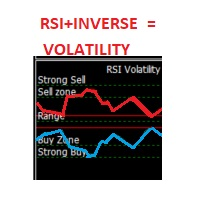
This indicator is an oscillator that shows the RSI (Relative Strength Index) in red and its inverse graph in a light green. Together this shows the volatility of the market (in its default setting). You can also change it to show only the RSI graph. It also gives you the possibility to change its Period. The oscillators zones (80,70,50,30,20) are marked by Strong Sell, Sell Zone, Range, Buy Zone, and Strong Buy respectively.

MT5 버전 | FAQ Owl Smart Levels Indicator 는 Bill Williams 의 고급 프랙탈, 시장의 올바른 파동 구조를 구축하는 Valable ZigZag, 정확한 진입 수준을 표시하는 피보나치 수준과 같은 인기 있는 시장 분석 도구를 포함하는 하나의 지표 내에서 완전한 거래 시스템입니다. 시장과 이익을 취하는 장소로. 전략에 대한 자세한 설명 표시기 작업에 대한 지침 고문-거래 올빼미 도우미의 조수 개인 사용자 채팅 ->구입 후 나에게 쓰기,나는 개인 채팅에 당신을 추가하고 거기에 모든 보너스를 다운로드 할 수 있습니다 힘은 단순함에 있습니다!
Owl Smart Levels 거래 시스템은 사용하기 매우 쉽기 때문에 전문가와 이제 막 시장을 연구하고 스스로 거래 전략을 선택하기 시작한 사람들 모두에게 적합합니다. 전략 및 지표에는 눈에 보이지 않는 비밀 공식 및 계산 방법이 없으며 모든 전략 지표는 공개되어 있습니다. Owl Smart Leve

MetaTrader 4에 대한 공정 가치 갭 지표.
공정 가치 격차는 유명한 스마트 머니 트레이더인 내부 서클 트레이더인 ICT가 가르친 3개 캔들 가격 행동 패턴입니다. 기본적으로 가격이 너무 빨리 움직일 때 차트에 열려 있는 갭입니다. 왼쪽 캔들과 그 옆의 오른쪽 캔들에 틱이 겹치지 않는 중간 캔들의 몸체 부분입니다. 가격이 차트에 공백을 남기면 두 가지를 염두에 둘 수 있습니다. 첫째, 가격은 그 방향으로 갈 수 있는 매우 강력한 모멘텀을 가지고 있고, 둘째, 가격은 일반적으로 그 방향으로 가기 전에 갭을 메우기 위해 되돌립니다.
공정 가치 갭은 가격 행동 거래자 사이에서 가장 일반적으로 사용되며 가격 전달에 비효율 또는 불균형이 있는 경우로 정의됩니다. 이 비효율성은 이전에 채워지지 않은 많은 대기 주문이 있기 때문에 이 가격 불균형을 재조정하기 위해 미래의 가격에 대한 자석이 될 수 있습니다. 거래자는 이 정보를 사용하여 공정 가치 갭을 목표로 하거나 좋은 POI가 되

변화율
공식을 기반으로, ROC = (Close[n] - Close[n-lookback]) / Close[n-lookback] * 100 룩백 기간 동안 통화 쌍 가격 행동의 변화율을 표시하고 최신 변화율 값과 이전 룩백 기간의 변화율을 나타내는 두 개의 전역 변수 SYMBOL_ROC 및 SYMBOL_ROC_LOOKBACK을 제공합니다. iCustom 함수를 사용하여 표시기 호출, iCustom ( "Market/RedeeCash_Rate_of_Change.ex4" , Symbol (), 5 , 0 , 0 ); 그런 다음 전역 변수를 검색합니다. double roc = GlobalVariableGet ( StringConcatenate ( Symbol (), "_ROC" )); double roc_lookback = GlobalVariableGet ( StringConcatenate (Synbol(), "_ROC_LOOKBACK" )); 추세를 확인하기 위해 테스트를 수행하고,
FREE
ICT Template Indicator visualizes and automatically updates all important ICT elements for Scalpers, Day and Swing traders. It allows you too keep your chart clean and bring any elements by just one click to the side buttons. Thanks to mobile notifications on external liquidity levels, you will not miss any opportunity and you don't have to sit behind the screens whole day. Each element has fully customizable colours, width, line types, max timeframe to be shown etc... so you can really tweak y

Scalping indicator 2 in 1. Buying this indicator, you get an automatic robot as a gift! Automatic system for searching for price reversal points. The indicator with dots on the chart of a currency pair shows the likely reversal points of the price movement. A red dot indicates a reversal of the movement down, and a blue dot indicates a reversal in the price movement up. The indicator is great for intraday trading using a scalping strategy. Ideally combined with channel indicators. When the chan
Shows price reversal points on the chart. Works on a period of 1 minute. The red arrow indicates that the price will go down now, and the blue arrow shows that the price will go up now. The accuracy of the signals is up to 93% depending on the currency pair. Works on all currency pairs, including the metals gold and silver. The indicator analyzes the current price position relative to the price range for a certain period in the past. The indicator optimizes its data using mathematical modules a

Average Price Bars (APB) are modified Heikin-Ashi type candlesticks. Heikin-Ashi is a Japanese term translated as 'Average Bar'; therefore, the name, Average Price Bars. Average Price Bars provide a better depiction of current market by eliminating or reducing fluctuations in nominal price action often referred to as “choppiness” of current High, Low, and Close price action.
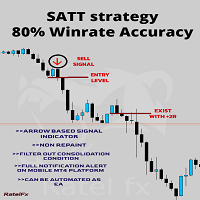
SAT strategy (Systematic Approach Trading Technique)
This is a revolutionary new way of trading the financial market.
This is the top indicator system that provides the most accurate trading signals for both entries and exits.
This system indicator algorithm provides the most accurate and precise signal only during the highly impulsive phase of the market.
This system indicator performs well during a high volume period, which is only the first three hours of a specific session, whether in L

ZigZagSpeed indicator measures the rate of formation of zig and zag over time calculated by the known zig zag indicator. The calculation system is simply calculated by dividing the difference in pips by the number of bars elapsed in the selected time frame. The speed measurements that occurred in the past period will also be displayed on the graph together with the date of occurrence. Velocity numbers are located above or below each zig and zag formation in white. The number shown in yellow rep

This indicator is developed based on the multiple session trading to aid in analysis for all the day traders. The indicator supports all currency pairs as well as other trading instruments like indicies, commodities, metals ,etc. The way the indicator work is by making analysis on your behalf. During asian session that's when the indicator does the calculations and provided trading plans in form of areas on the chart for the current day. And this process happens everyday which allows for hands f

GMMA indicator that looks like a cloud. The GMMA indicator is easy to read, but to make it even more visually pleasing, we made it look like an Ichimoku Chart cloud. Colors have been changed where short-term and long-term overlap.
My other products https://www.mql5.com/ja/users/studiotam/seller
Please reduce the character limit a bit. I have nothing more to write.
FREE
This indicator is intended to help traders to see today's daily range compared to the average daily range. You can change the number of days for the average daily range otherwise you can use 20 as the default. The % Reach will give info about the progress today's range toward the average daily range. Breakout traders, or pullback traders normally will look at base area, in which they might want to know the average daily range as comparison.
The indicator has color code green and red, where the

A Gap often occurs when the price moves with "strength" in a given direction (either up or down). This Gap is formed when, in looking at 3 consecutive candles, the wicks of the 1st and 3rd candles do not overlap. When this happens, the indicator creates a rectangle where the Gap is located. It identifies a zone where the price could potentially go back to (mitigation). The Gap/rectangle is mitigated when the price returns and completely covers the rectangle. Note that the indicator also show

The XR Gartley Pattern MT4 is an indicator which displays and alerts Gartley pattern detected on the candlestick chart. It also displays potential trade with calculated Take Profit and Stop Loss, Timeframe H1. After purchasing XR Gartley Pattern, you can immediately download this indicator from the MT4-MT5 Market and start using it because all features are set to default, is not necessary to change any parameter. In addition, we have created a private group for customers who have purchased one
FREE
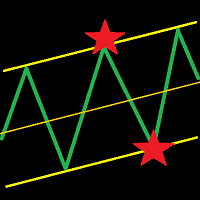
This indicator draws a trend line and a trend tunnel on the chart. You can choose several calculation methods, alerts, notifications, and other settings. It can also draw trendlines from another TimeFrame. You can also use this indicator for your ExpertAdvisor. The current values of the lines are stored in the memory buffer from where the EA can load them. You can trade the price bounce from the upper and lower lines . Settings TimeFrame – trend timeframe Description – show description of line

Hi! Between the given time range. Adds profit and lot. This can be written on the charter in English and Hungarian. The name of the symbol must be entered exactly. Good used for it. :)
Szia! A meg adott idősáv között Összeadja a profitot és lot-ot. Ezt ki írathatjuk Angolul és Magyarul a chartra. Pontosan kell beírni a szimbólum nevét. Jó használatott hozzá. :)
Best Solution for any Newbie or Expert Trader!
Forex Support Resistance is a unique, high quality and affordable trading tool because we have incorporated a number of proprietary features. it calculate highest high and lowest low of Previous X bars with possibility to select timeframe as desired . also it display the values of highest high and lowest low of Previous bar as a comment at the main chart . Imagine how your trading will improve because you are able to pinpoint the exact trigger poi

Easy to use indicator that will help you place your pending and market orders with great accuracy. The indicator plots the order blocks based on how price reacts to current market structure. These key levels represent supply and demand zones and the Smart Blocks Trading System indicator uses price to assess whether an asset is being accumulated or distributed. It can be used on any financial instrument, and on any given time frame.
BoS stands for Break of (market) Structure. The blue and red d

This indicator easily calculates the reward to risk ratio and indicates the stop out level and take profit limit with graphical boxes. Also shows the reward steps with fibonacci levels without changing the fibonacci default levels, this is a lot useful for people who use fibonacci retracement. Very user friendly interface and easily to use with graphical buttons.
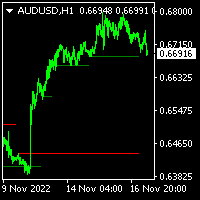
A simple and precise Indicator to identify potential supply and demand zones for price reversals. It was first described in Jason Pearl's Book, " Demark Indicators", published in 2008. It can be used both as Support and Resistance, and can be traded as a Breakout or as a Fakeout, depending on your trading style, and depending on how the candle was closed in proximity to TDST.

Scalper Vault 는 성공적인 스캘핑에 필요한 모든 것을 제공하는 전문 스캘핑 시스템입니다. 이 표시기는 외환 및 바이너리 옵션 거래자가 사용할 수 있는 완전한 거래 시스템입니다. 권장 시간 프레임은 M5입니다. 시스템은 추세 방향으로 정확한 화살표 신호를 제공합니다. 또한 상단 및 하단 신호와 Gann 시장 수준을 제공합니다. 이 시스템은 사용하기가 매우 쉽습니다. 원하는 시장 지역의 화살표만 따라가면 됩니다. 엑시트는 가격이 적정 수준에 도달하거나 시장의 고점 또는 저점 신호가 나타날 때 수행됩니다. 표시기는 PUSH 알림을 포함한 모든 유형의 경고를 제공합니다. 인디케이터 구매 후 연락주세요. 내 개인 거래 권장 사항과 훌륭한 보너스 지표를 무료로 공유합니다! 나는 당신에게 행복하고 유익한 거래를 기원합니다!
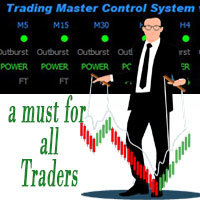
트레이딩 마스터 컨트롤 시스템의 특징
TMCS는 자산의 상태를 한 번에 볼 수 있는 도구입니다. TMCS는 모든 시간 프레임을 보여주고 추세, 거래력을 보여주고 거래 신호에 대한 거래력 경고를 기반으로 계산합니다. 이 표시기는 볼린저 밴드의 돌파를 계산합니다. 또한 매우 중요합니다. 그는 시간 프레임이 일정할 때 실제 거래력이 없음을 의미합니다. 스크린샷과 비디오 자습서의 설명에서 더 많은 것을 참조하십시오.
플랫폼: 메타트레이더4
통화 쌍: 모든 쌍, 지수 및 금속 거래 시간: 24시간 기간: 모든 시간 프레임 지표의 알고리즘
표시기는 모든 시간 프레임의 ADX 전체 추세를 기반으로 계산합니다.
지표는 Tickdata 및 입찰 및 매도 수량을 기반으로 가격 움직임의 힘을 계산합니다. 표시기는 모든 시간 프레임의 볼린저 밴드에서 브레이크아웃을 계산하고 매우 높은 전력과 반전 기회로 폭발할 때를 보여줍니다. 표시기는 모든 정보를 기반으로 평균값을 계산하고 알림, 자산 거래
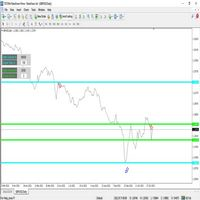
지표 - 가격 채널은 두 개의 독립적 인 가격 채널과 가격대 수준 - (A / B)로 구성됩니다. 이 지표는 가격의 동작과 움직임을 지속적으로 모니터링하고, 채널 수준 (A / B)의 고장을 지속적으로 모니터링하여 레벨을 재정렬하고 최대 및 최소의 극한의 새로운 영역을 고정합니다. 최대 및 최소값의 이전 및 현재 영역을 분석하기 위해 각 채널의 막대 수 (A / B)는 의존하지 않습니다. 그래프에서 표시기는 각 채널에 유용한 정보를 표시합니다 - (A / B) : 1. 각 채널 분석에서 지정된 막대 수. 2. 델타 - 각 채널의 레벨 사이의 거리.
1. 지표 사용의 예 : 구역의 검색 및 갱신 및 새로운 로컬 레벨의 최대 및 최소값 (상단 또는 하단)의 경우 - 채널에서 (a) 범위를 나타냅니다 - (100 - 500) 막대. 동시에, 채널 - (b) 우리는 사용하고 싶지 않은 채로 채널에 있습니다 - (b) - (0) 막대를 나타냅니다. 채널 레벨 - (b) 동시에 그래프에서

Buy and Sell Targets Indicator You can see the buying and selling goals in the box and they are inevitably achieved. It consists of three lines: the first green color sets buying targets, the second red color sets selling targets, and the third blue color is the average price. Trading Method For Buy Trade: The entry point will be where the wavy blue line (representing the average price) is 'broken' by the ascending 'Buy' candle from beneath Please wait until the next candle appears to enter int

BUY INDICATOR AND GET EA FOR FREE AS A BONUS + SOME OTHER GIFTS! ITALO TREND INDICATOR is the best trend indicator on the market, the Indicator works on all time-frames and assets, indicator built after 7 years of experience on forex and many other markets. You know many trend indicators around the internet are not complete, does not help, and it's difficult to trade, but the Italo Trend Indicator is different , the Italo Trend Indicator shows the signal to buy or sell, to confirm the signal t

ICT Core Content Concepts turned into indicator plus all previous tools known from the Position Smart Indicator . This makes it the Full PSI Private Version ( read more ) restricted up to now but available only after the Mentorship Core Content was made public on YouTube. You will find many price action study tools like: Central Bank Dealing Range - CBDR Asian Range FLOUT Profiles and SD targets on the CBRD, Asian Range and Flout both on the wicks and on the bodies Seek & Destroy Profil

Multi-Asset Forex Scanner
This indicator allows you to scan multiple assets at once, sending you configurable alerts when any asset touches daily pivot levels 1, 2 or 3.
The original code was just modified to send alerts to MT4 Desktop, MT4 Mobile or Email. (Credits for the original code go to Carlos Oliveira)
In order to receive mobile or Email alerts you must configure Notifications and Email sections in the MT4 platform.
In addition to pivots, this indicator also shows ATR, Volume, RSI,
FREE
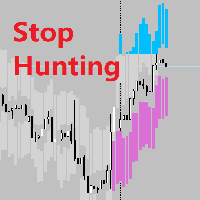
Realtime Stop Hunting Background What Is Stop Hunting? I refer to the definition of Stop Hunting from Investopedia, Stop hunting is a strategy that attempts to force some market participants out of their positions by driving the price of an asset to a level where many individuals have chosen to set stop-loss orders. The triggering of many stop losses at once typically creates high volatility and can present a unique opportunity for investors who seek to trade in this environment. Setting up the
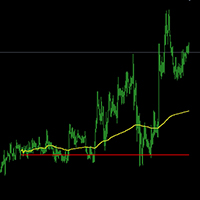
The index by 5 minutes the line graph is very close to the map to get the effect and time Using the method of the index: 1, 5 minutes K-line set into a line chart2, change the color of the white line chart 3, set the background color and the grid Yellow for the average . Red is the zero axis (that is, yesterday's closing price)
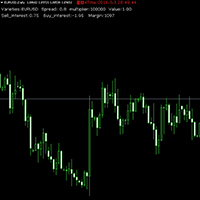
The basic information of the market
The current variety Spread Basis-point Value Empty single overnight interest More than a single overnight interest bond Time to market English version Forex Hedge EA standard edition Forex Hedge Pro EA Advanced version Chinese version Forex Hedge EA cn standard edition Forex Hedge Pro EA cn Advanced version QQ:437180359 e-mail:hl3012@139.com
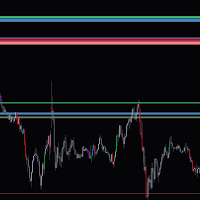
This indicator shows zones based on daily candles in the chart , Make sure you have enough daily bars in the chart before loading the indicator to the chart, These zones can act as both supply and demand zones. The zones are not subjected to repaint. If you have less zones or no zones for current prizes under the default inputs, try increasing the past days input and the zone sizes values gradually. If you have more zones than you need in chart try decreasing the past days and the zone size val

This indicator helps to identify market sessions, It's High/Low, Open Range (OR), range of the sessions in pips and percentage of previous day (change%) under OHLC.
It is also editable for any brokerage market watch time. For traders who use session trading strategies such as Mark B. Fisher ACD it can be super effective, where they can edit OR from the settings to either line or box. We tried to make the settings easier to edit, for traders' use on different markets, charts and brokerage time.

A supply and demand indicator designed with a minimalist trading strategy based on the nature of the market. The Bull zone is a strong support area, and the Bear zone is a strong resistance area. When a Bull zone was breakout, it becomes the "base" of the Bears and vice versa. When the price meets these areas, there is a high probability that the price will turn around, so we call them Obstacles. It is a suitable indicator for traders interested in manual price action and algorithmic trading up
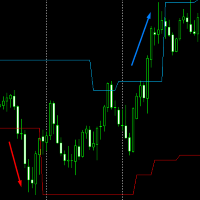
Volatility Channel from JagzFX helps you find breakouts by displaying a channel on the price chart. Volatility Channel is simple to use - there are no parameters - and works on any timeframe. BASIC USE of Volatility Channels The channel can be used as a 'No Trade Zone': you don't trade when the price is inside the channel. However:
When the price breaks above the channel: go Long. When the price breaks below the channel: go Short. The indicator works on all timeframes to suit your trading style.
FREE

Thank you for taking interest in my indicator. I developed this tool over a couple of years, crunching numbers, studying and testing different logics, i finally had it programed in 2020 and now I'm proud to release "RastaWay" indicator to a limited number of serious traders (limited copies available). The system employs a unique logic to attempt to decode market mechanics and translate it into a visual language any trader can understand and use. The edge in this tool is purely of my own conce
Современный индикатор паттернов PPR по торговой стратегии RAIT. Работает по тренду и без него. Имеет настройки таймфрейма для отображения. Можно настроить количество баров для отображения индикатора на графике. Используется несколько паттернов PPR. Индикатор предпочтительно использовать на часовом таймфрейме и выше, но работает и ниже . Паттерны: PPR, PinPPR, OutPPR. Отображаются одной стрелкой.
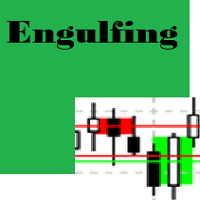
Engulfing Candle Detector
Detectable pattern Double Candlestick Patterns Bullish Engulfing
The first candle is black candle. The second candle opens with a gap below the real body of the black candle but rallies upwards to close above the real body of the black candle. In other words, the second candle's real body completely engulfs the first candle's real body Bearish Engulfing
The first candle is white candle. The second candle opens with a gap above the real body of the white candle but dec
FREE
DESCRIPTION:
Account Information Panel v1.1 is a MT4 (MetaTrader 4) indicator, and it is an excellent tool to track and analyze your investments monthly under an investor's view to help investors/traders understand their investment/trading quickly without spending hours to do manual calculation. FEATURES:
Display a basic information Balance Equity Margin Free margin Margin level Leverage Swap (long/short) Spead Current DD (drawdown) Active positions (long/short, lot, profit/loss) Display week

現在、ホリデーディスカウントで399ドル! 今後値上がりする可能性があります。以下の説明をお読みください。
Ultimate Dynamic Levelsの紹介 - Ultimate Sniper DashboardのBESTエントリーインジケーター! 極めてローリスクなタイムリーエントリーと高RR!!!
アルティメットスナイパーダッシュボードはこちら。 初心者はもちろん、プロのトレーダーにとっても最も重要な能力は、いつどこで相場が転換するかを正確に判断し、いかに安全に参入し、利益を得て退場するかを見極めることです。
アルティメット・ダイナミック・レベルズ・インディケーターは、相場が転換する可能性が最も高い場所を簡単に教えてくれるので、極めてローリスクなトレードを自信を持って行うことができ、同時にチャートをクリーンでシンプルに保ちながら、$$$を稼ぐことができるのです!
アルティメット・ダイナミック・レベルズ・インディケーターは、複数の時間枠で重要な隠れたレベルを一度に見つけるユニークで強力なアルゴリズムを持っています。また、他の典型的なSRインジケーターのように、レベルを再描

MAs COMBO - MT4용 간단하면서도 강력한 이동 평균 지표를 만나보세요! 이 맞춤형 지표는 단순 이동 평균의 스마트한 조합을 기반으로 제작되어 최소한의 노력으로 고확률 거래 설정을 파악하는 데 적합합니다.
거래 초보자라도 이 지표의 직관적인 로직 덕분에 명확하고 수익성 있는 거래 신호를 빠르게 포착할 수 있습니다. 패턴 인식 기능이 매우 직관적이어서 초보자와 숙련된 트레이더 모두 바로 활용할 수 있습니다!
이 지표를 선호하는 이유: 1. 미리 구성된 입력 설정이 제공되어 복잡한 설정 없이 바로 사용할 수 있습니다. 2. 사용자 지정 가능한 색상으로 차트를 원하는 스타일에 맞게 설정할 수 있습니다. 3. 내장된 매개변수가 이동 평균 설정과 관련된 모든 복잡한 작업을 처리하여 시간과 추측을 줄여줍니다.
모든 거래 스타일에 적합: 1. 장기 거래를 원하시나요? 더 높은 시간대에 사용하면 추세 확인과 수익 증대에 효과적입니다. 2. 단기 스캘핑을 원하시나요? 더 낮은 시간대(
FREE

Auto Fibo 는 수동 거래를 향상시키기 위해 개발된 지표입니다. 자동으로 황금 비율을 그려 시간을 절약하고 거래를 촉진합니다. 지표를 그래프에 부착하면 정확한 황금 비율이 자동으로 그려지므로 임계점을 찾아야 하는 수고를 덜 수 있습니다. 인터페이스는 컴퓨터에 따라 밴드의 대략적인 고점과 저점으로 조정됩니다. 이 표시기는 대부분의 시작 및 끝 지점 선택 오류를 수정합니다. 각 밴드에 대해 정확한 가격이 표시됩니다. 警告 私はMQL5.com으로 私のEAを販売するだけ입니다.もし誰かが私のEAを売ってくれと連絡してきたら、それはああにの金が また、もしあなたが私のEAを 外部のウェブサイトから購入した場合、それ는 偽의 바 죤으로 あ り, original의 ゝ と 同じ よ に は 動作 ないこ
FREE
모든 통화 쌍 및 기간에 대한 스캘핑 표시기. 지표는 시장 규칙에 따른 가격 반전 가능성이 있는 지점을 화살표로 표시합니다. 표시기는 신호를 다시 그리지 않습니다. 화살표가 나타나면 표시기가 휴대폰과 이메일로 거래자에게 신호를 보낼 수 있습니다. 표시기는 설정하기가 매우 쉽습니다. 신호 "기간"을 설정하기 위한 매개변수는 하나만 있습니다. 이 매개변수를 변경하면 표시기 신호의 정확도와 숫자가 변경됩니다.
이 지표로 거래하기 위한 준비된 거래 전략: 모든 통화 쌍에 표시기를 설치합니다. 권장 기간 M5, M30, H1. 표시 화살표가 나타나기를 기다리고 있습니다. 파란색 화살표가 나타나면 구매 주문을 엽니다. 빨간색 화살표가 나타나면 매도 주문을 엽니다. TakeProfit은 25포인트로 설정됩니다(주 통화 GBPUSD, EURUSD로 거래하는 경우). StopLoss는 55 포인트를 넣었습니다. 로트 크기는 저울의 크기에 따라 결정됩니다. 잔액 $200당 0.01랏을 추가하는 것

Afidealn - 표시기는 바이너리 옵션을 위해 설계되었습니다!
화살표 표시기 Afidealn은 기간에 최상의 결과를 보여줍니다.
M1 M5 M15는 이제 그만!
파란색 화살표를 위로 올려주세요
빨간색 화살표를 아래로 놓으십시오.
신호는 10-15 초의 지연으로 현재 촛불에 나타납니다.
Afidealn은 이러한 신호 지연으로 인해 여러 지표에서 작동합니다.
다중 통화! 다른 통화 쌍에서 작동하며 결과는 훌륭했습니다.
또한 추천 지표는 뉴스에 매우 민감합니다.
뉴스 중에는 거래하지 않는 것이 좋습니다.
최상의 결과를 얻으려면 2분 동안 거래를 시작하는 것이 좋습니다.
통화 쌍 달러 유로가 그를 위해 최고입니다!
테스트하고 결과를 확인하십시오! LY98 LY98 LY98 LY98 LY98 LY98

BUY INDICATOR AND GET EA FOR FREE AS A BONUS + SOME OTHER GIFTS! ITALO VOLUME INDICATOR is the best volume indicator ever created, and why is that? The Indicator works on all time-frames and assets, indicator built after 7 years of experience on forex and many other markets. You know many volume indicators around the internet are not complete, does not help, and it's difficult to trade, but the Italo Volume Indicator is different , the Italo Volume Indicator shows the wave volume, when market

This indicator will mirror the assets in use in another metatrader, being able to choose the timeframe and a template. This is the Metatrader 4 Client, it needs the Metatrader 4 or 5 Server versions: Metatrader 4 Mirror Chart Server: https://www.mql5.com/en/market/product/88644
Metatrader 5 Mirror Chart Server: https://www.mql5.com/en/market/product/88652 Details of how it works in the video.
FREE
This indicator will mirror the assets in use in another Metatrader, being able to choose the timeframe and a template. This is the Metatrader 4 Server, it can work with Metatrader 4 or 5 Client versions: Metatrader 4 Mirror Chart Client: https://www.mql5.com/en/market/product/88649
Metatrader 5 Mirror Chart Client: https://www.mql5.com/en/market/product/88650 Details of how it works in the video.

This indicator plots another symbol on the current chart. A different timeframe can be used for the symbol, with an option to display in multiple timeframe mode (1 overlay candle per several chart candles). Basic indicators are provided. To adjust scaling of prices from different symbols, the overlay prices are scaled to the visible chart price space.
Features symbol and timeframe input MTF display option to vertically invert chart, eg overlay USDJPY, invert to show JPYUSD
data window values; o
FREE
Forex Flow Equalizer is an indicator that helps to reduce 'noise' in forex price movements. Visit https://www.mql5.com/en/blogs/post/751167 for more detailed explanation. It is programmed to enhance traders' focus, and capacity to monitor or manage multiple instruments of interest on preferred timeframe without their minds being over loaded with data or information, thereby, saving them the mental strength for more important trading decision making. Range Mode: is for traders who like to trade

Normalized indicator. It measures the relative deviation of the price from its moving average. It is extremely reliable. Accurately determine overbought and oversold price areas and divergences. Features. The indicator is applied to the close of the candles. Has a range of -100 to 100. The overbought zone is above 80 and the oversold zone is below -80. Mode: histogram/line. MA method: simple, exponential, smoothed, linear weighted. With softing function. By default the indicator is calculated
this indicator functions to read buffers from other custom indicators, and combine 2 signals from each indicator Instructions 1. you have to know the buffer up or down of the indicator you want to use 2. if the indicator is in the same folder, you just need to enter the name of the indicator in the indicator name column if the custom indicator is in a separate folder, you can type it in the format folder1/folder2/name indicator
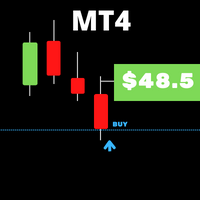
When you work with several assets and have several open positions in assets, it is a little complicated to visualize when profit or profit each active problem is giving, so with this in mind, we develop this indicator where it facilitates the visualization of operations in assets, where you you will be able to open several different resources and you will be able to visualize the individual result of each asset and speed up your decision making in your business.
FREE

Small free indicator to detect certain chart patterns, shoulder head shoulder / reverse, triple top / bottom, cup, flags and others... I designed it a while ago, it detects figures in m1, m5, m15, m30 and h1.
I hope it will be useful to you because I don't trade much with this indicator, I have a few others that I will try to put online quickly maybe you will find it useful, good Trade friends.
FREE
TRACKINGLEVELS (SUPPORTS AND RESISTANCES)
TrackingLevels is a useful indicator that saves considerable time when a trader starts analyzing a chart. This indicator draw on the chart all the resistances and supports that the market is creating. The resistance and support levels are very important, this levels define areas where there can be a considerable accumulation of sell or buy orders. These are a key areas that every trader must know and keep in mind all the time. This indicator helps the

** All Symbols x All Timeframes scan just by pressing scanner button ** *** Contact me to send you instruction and add you in "All Divergences scanner group" for sharing or seeing experiences with other users. Introduction Divergence is a main technique used to determine trend reversing when it’s time to sell or buy because prices are likely to drop or pick in the charts. All Divergence indicator can help you locate the top and bottom of the market. This indicator finds Regular divergences for
KFX RSI Dashboard uniquely monitors RSI levels on multiple currency pairs (selectable by you) at once and displays them in a two-column list of lower timeframe and higher timeframe (selectable by you). The currency pairs are the combinations of the major currencies (USD, EUR, GBP, CHF, JPY, CAD, AUD, and NZD). All the currency pairs are sorted automatically based on RSI Levels from this the indicator allows one of two output options:
1. Currency Strength OR 2. RSI Level
What's the Strat

This Indicator is designed to show past trade entries and exits on calculations from level crossed. It can be used on any chart. It will show past losses, profits and profits minus losses. User can change indicator's basic settings and the results shown will change. Indicator will work on running charts too. Past no. of bars will enable indicator to calculate set no. of past period of candles.
The Cross Period Moving Average Support Resistant Map puts multiple latest updated MA value in the same window.
Useful for trend and breakout traders to identify support and resistance at a glance. Highlighted with multiple line width for each period. MA type : SMA MA price : candle close price MA periods: H1 , H4 , D1 , W1 , MN
**if you have any enquiry, contact me at : pipsstalker1507@gmail.com

Concept
Market arranges in Time upcoming Phases according to the present Results of its Interest. Directing Modulations are an Interaction of immanent Periods, which show in Reference to Time cyclic Activity and to Price leveling Activity. PointZero is a projecting Price Mask of this Concept of Time and Price and categorizing developed Price Movements related to their own Range: how far moved ? indicating their Status by marking special Events: when which Action ? setting the Situation in a fun
FREE

Introduction In the fast-paced world of financial market trading, success often hinges on the ability to spot and leverage trends. Among the various strategies available, momentum trading stands out as a powerful tool for traders seeking to capitalize on market movements. In this article, we will delve into the concept of momentum, its significance in trading, and the numerous benefits it offers to traders. What is Momentum?
Momentum in trading refers to the tendency of assets to continue moving

This indicator will turn the colors of your candles into a trend oriented colored showing 4 different colors based on two moving averages and the slope of the slow moving average. very powerful indicator for all periods of time showing you the direction of the trend to confirm your trades.
Green: Bullish
Dark Green: Bullish Weak
Light red: Bearish Weak
Red: Bearish
For more info:
https://linktr.ee/trader_1st
FREE

You can proof how good this indicator is by comparing this indicator with other support resistance indicators in MQL5.com market. The Automated Support Resistance Screener is a powerful support and resistance custom indicator that can help traders determine the level of support and resistance values simple, easily and accurately. MT4 doesn't provide any support and resistance indicator, making ASRS an essential tool for traders and t his indicator is built using the MQL4 programming language an

Concept
Market arranges in Time upcoming Phases according to the present Results of its Interest. Directing Modulations are an Interaction of immanent Periods, which show in Reference to Time cyclic Activity and to Price leveling Activity. SensorMap is a reflecting Volume Mask of this Concept of Time and Price and apportioning developed Price Movements in an equalized 100 % - Range: how far moved ? indicating their Status by marking special Events: when which Action ? setting the Situation in a
FREE

A pin bar pattern consists of one price bar, typically a candlestick price bar, which represents a sharp reversal and rejection of price. The pin bar reversal as it is sometimes called, is defined by a long tail, the tail is also referred to as a “shadow” or “wick”. The area between the open and close of the pin bar is called its “real body”, and pin bars generally have small real bodies in comparison to their long tails.
The tail of the pin bar shows the area of price that was rejected, and t
FREE
It is a very simple indicator to display daily loss percentage, open position loss percentage, monthly loss percentage and monthly profit percentage. MT5 version
We assure you that we welcome any suggestions to improve this indicator and make the necessary changes to improve this indicator.
You can contact us via Instagram, Telegram, WhatsApp, email or here. We are ready to answer you.

Hi Trader, We are strategy development for Binary and Forex tools, our product have success for binary trading 1 min - 2 min experation. At the moment I build indicator for trading all day, not like Bonosu series with specific time. We launch A-Boss Stats Indicator for trading 1 minute to 5 minutes experation is mean can trade from 1 minutes - 5 minutes. Specification of A Boss Stats trading binary option: Work with all MT4 broker. Chart Time Frame M1 only, can use M5 Experation time for contact

Trend Lines contiuous Signal (FREE one WEEK) This indicator draws current trend line and provides Buy/Sell Signal based on calculations on Higher frame (Trend) and Lower frame(Entry signals)
* You should select the higher and lower frame for indicator calculations * You select the Trend line colors as you prefer * Enable or disable Alerts! Trend lines UP/Down are drawn when a trend is detected Wait for small arrows for entry : *Normally an UP arrow in an UP Trend is a BUY signal : ---you Clos
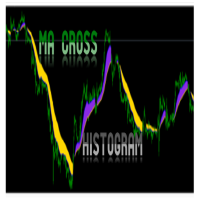
MA Histogram is MT4 Indicator for beginners which plot a histogram after Moving Average Crossover of 2 MAs. The Indicator does not have arrow or alert. It will simply plot on chart the potential Up and Down trend when trend is beginning or ending. It will show a Blue color for potential up trend and Gold color for potential down trend. Recommended pairs: All MT4 pairs including Indices You can change inputs to suit your Moving Average cross parameters and color for histogram.
Get for Forex MT5
MetaTrader 마켓은 개발자들이 거래 애플리케이션을 판매할 수 있는 간단하고 편리한 사이트이다.
제품을 게시하고 마켓용 제품 설명을 어떻게 준비하는가를 설명하는 데 도움이 됩니다. 마켓의 모든 애플리케이션은 암호화로 보호되며 구매자의 컴퓨터에서만 실행할 수 있습니다. 불법 복제는 불가능합니다.
트레이딩 기회를 놓치고 있어요:
- 무료 트레이딩 앱
- 복사용 8,000 이상의 시그널
- 금융 시장 개척을 위한 경제 뉴스
등록
로그인
계정이 없으시면, 가입하십시오
MQL5.com 웹사이트에 로그인을 하기 위해 쿠키를 허용하십시오.
브라우저에서 필요한 설정을 활성화하시지 않으면, 로그인할 수 없습니다.