 MetaTrader 5
 Experts
 지표
지표
 라이브러리
라이브러리
 유틸리티
유틸리티
 위젯
위젯
 규칙
규칙
MetaTrader 4용 새 기술 지표 - 170
 아래 나열된 기술 지표의 시그널은 MetaTrader 4 플랫폼의 거래를 열고 종료하는 데 중요한 역할을 합니다.
지표의 본질은 가격 변화를 예측하기 위한 금융 시그널 값의 수학적 변형입니다.
아래 나열된 기술 지표의 시그널은 MetaTrader 4 플랫폼의 거래를 열고 종료하는 데 중요한 역할을 합니다.
지표의 본질은 가격 변화를 예측하기 위한 금융 시그널 값의 수학적 변형입니다. 
This is a Control Panel for major chart indicators: Moving Averages, Bollinger Bands, Envelopes, PSAR and Fractals. You have the ability to change any input parameters for each indicator. For example:
MA maPeriod = 13; ma_method = MODE_SMA; app_price = PRICE_CLOSE; maColor = Yellow; Bands bbPeriod = 20; bb_dev = 2; bb_Price = PRICE_CLOSE; bbColor = Aqua; This indicator will be helpful for those who like to use many indicators before any decision making.

Description Shows Heikin-Ashi candles (often misspelled Heiken-Ashi) on the chart and can alert when candles change color. The alert is useful for both entry and exit. The number of candles of the new color before an alert is raised can be set. The alert can be controlled interactively, directly from the chart. Also includes bonus indicators of current spread and ask/bid prices in large text, color coded as price changes. Usage Heikin-Ashi candles give a much better insight to the underlying tre

Pivots is an indicator to show pivots for relevant time frames. Besides the pivots the indicator can also show daly open line, the resistance and support levels, the ADR Fibonacci levels and the order of the pivots. Pivots includes an intelligent algorithm to eliminate Sunday candles, but only if your broker provides those. Pivots are significant price levels that may serve as support, resistance or breakout levels Settings textFont - font to use for the labels. textSize - font size. textColor -
Description The product draws lines on the chart to show daily support, resistance and pivot plus weekly and monthly pivot. An alert can be set when the price reaches one of the lines or the price closes above/below it. This can be useful for both entry and exit. The alerts can be controlled interactively directly from the chart.
The product also includes bonus indicators of Average Daily Range (or Average True Range - configurable), current spread and ask/bid prices in large text, color coded a
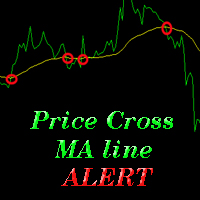
The indicator alerts you when the market price crosses MA line. You can choose any MA line to use via the parameter input tab (see the screenshot below). Parameters (the same as the four parameters you have to choose when you add MA line on a chart): ma_period ma_shift ma_method (0=Simple; 1=Exponential...) ma_apply (0=Close; 1=Open; 2=High; 3=Low...) When the price crosses MA line, it will alert you with a message looking as follows: "Price crossing DOWN MA line, pair: EURUSD Period: 60" or "

메타트레이더 4(MT4)의 "두 이동평균 크로스오버" 인디케이터는 두 이동평균을 표시하고 이동평균이 서로 교차할 때 알려주는 차트 분석 도구입니다. 이 인디케이터는 두 개의 이동평균을 계산하여 표시하는데, 하나는 더 빠르고 다른 하나는 느립니다. 더 빠른 이동 평균이 더 느린 이동 평균 위로 교차하면 강세 신호로 간주되어 잠재적 인 추세 반전 또는 새로운 상승 추세의 시작을 나타냅니다. 반대로 빠른 이동평균이 느린 이동평균 아래로 교차하면 하락 신호로, 추세 반전 또는 새로운 하락 추세의 시작을 나타냅니다. 이 인디케이터는 단순이동평균(SMA), 지수이동평균(EMA), 평활이동평균(SMMA) 또는 선형가중이동평균(LWMA) 등 다양한 유형의 이동평균을 사용하도록 사용자 지정할 수 있습니다. 트레이더는 자신의 트레이딩 스타일과 선호도에 맞게 각 이동평균의 주기를 조정할 수도 있습니다. 이동 평균을 표시하는 것 외에도 인디케이터는 크로스오버가 발생하면 알림을 생성합니다. 트레이더는 크
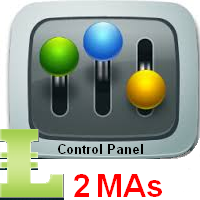
This panel will be very useful for a research of a trading strategy system. The MA-ControlPanel is based on the very popular Moving Averages indicator. You will be able to change the indicator parameters: Period , Shift , Method and Apply Price by clicking on the Up ( /\ ) and Down ( \/ ) buttons. You may choose your favorite colors using parameters BackGround, maColor1 and maColor2. Sometimes, when you will open a rarely used currency pair or timeframe the indicator will not show its value. In

Crossing of market price and moving average with all kinds of alerts and features to improve visualization on the chart.
Features Crossing of market price and Moving Average (MA) at current bar or at closing of last bar; It can avoid same signals in a row, so it can allow only a buy signal followed by a sell signal and vice versa; MA can be set for any of the following averaging methods: Simple Moving Average (SMA), Exponential Moving Average (EMA), Smoothed Moving Average (SMMA), Linear-weigh
The indicator shows you time remaining till completion of the current candlestick of any timeframe you chose, showing struct (see details). Minute: second. The indicator has 3 parameters: TF - this parameter will help you choose timeframe you want, for example, if you want to show remaining time for M30, set TF=30. If you want to show remaining time of the current period you are seeing on chart, set TF=0 (like in default). Local - this parameter will help you choose location on the chart where t

The indicator of a Professional Trader is an arrow indicator for predicting the direction of price movement. I have been working on this indicator since 2014.
You can use this indicator as your main indicator, use its entry signals, and use it as your only indicator to find entry points.
About the product: Recommended TF [H4-D1-W1] . The indicator predicts the direction of the next candle. Fits a variety of tools; Flexibility in settings for different instruments and intervals through the MO
FREE
Zig Zag Swing Detector is a talking indicator tool, that let you track new highs and lows using Zig Zag patterns and allows you to react to new highs and lows. For example for uptrend each time there is higher hi spotted, the strength of the trend is increased. Trend is ended with lower low than the previous one. Be notified by Alerts, Speech and Notifications and be alerted about new highs/lows! You can also setup conditions to open trades automatically on new heights. Speech synthesis allows y

The indicator shows you buy/sell signals and does not repaint. It works well with almost all pairs, while the best ones are GBPUSD, XAUUSD and EURUSD. The product works better on H1 and H4. You can change the parameters in the inputs tab to get the best signals and the best trade results on each pair. You can enable/disable alerts when signal appears. The indicator is easy to use.
Parameters barstrip & Sensitive: amount of bars to process the highest and lowest prices (relates to the internal l

ForexTrendMT4 Indicator: A Reliable Tool for Market Tracking The ForexTrendMT4 indicator offers reliable market trend tracking, filtering out sudden fluctuations and market noise. This tool helps identify trends and signals favorable entry points into the market using arrows. It is suitable for both scalping on shorter timeframes and long-term trading strategies. Based on the principles of technical analysis, ForexTrendMT4 takes into account the cyclical nature of the market. Key Features and A

Lampropeltis is a trend indicator. The algorithm of calculation is based on data from the standard indicators included in the MT4 package and interpretation of patterns formed by these indicators. The settings include a minimum set of parameters: Slow MA - slow MA period; Slow MA method - slow MA smoothing method; Fast MA - fast MA period; Fast MA method - fast MA smoothing method. Change of the signal color to red indicates the possibility of opening a Sell order. Change of the signal color to
FREE

This indicator is based on the classical indicator CCI (Commodity Channel Index) and will be helpful for those who love and know how to use not a visual but digital representation of the indicator. All TimeFrames CCI MT4 indicator shows values from each timeframe. You will be able to change the main input parameters for each CCI for every TF. Example for M1: sTF1_____ = "M1"; Period1 = 13; Price1 = PRICE_CLOSE.

This indicator is based on the classical indicator STOCHASTIC and will be helpful for those who love and know how to use not a visual, but digital representation of the indicator. All TimeFrames Stochastic MT4 indicator shows values from each timeframe (M1, M5, M15, M30, H1, H4, D1, W1 and MN1). You will be able to change the main input parameters for each Stochastic from every TF. Example for M1: sTF1_____ = "M1"; K_Period1 = 5; D_Period1 = 3; S_Period1 = 3; Method1 = MODE_EMA.

This indicator is based on the classical indicator Parabolic SAR and will be helpful for those who love and know how to use not a visual, but digital representation of the indicator. All TimeFrames PSAR MT5 indicator shows values from each timeframe (M1, M5, M15, M30, H1, H4, D1, W1 and MN1). You will be able to change the main input parameters for each Stochastic from every TF. Example for M1: sTF1 = M1 pStep1 = 0.02 pMax1 = 0.2

TMA Currency Meter is the ultimate currency meter. Based on the Triangular Moving Average of all available symbols, this indicator shows which currencies are strong, strengthening, weak or weakening. Experienced as well as novice traders will see the strong and weak currencies in the blink of an eye, and know which trade possibilities to explore further. TMA Currency Meter is a true Multi Timeframe indicator. It is easy to show the currency strengths for a higher timeframe than the chart timefra

Many indicators are based on the classical indicator Moving Average . The indicator All_TF_MA shows crossing of 2 MA from each TimeFrames . You will be able to change main input parameters for each MA for every TF. Example for M1 TF: Period1_Fast = 5 Method1_Fast = MODE_EMA Price1_Fast = PRICE_CLOSE Period1_Slow = 21 Method1_Slow = MODE_SMA Price1_Slow = PRICE_TYPICAL

This multi-timeframe indicator is based on the idea of classical indicator CCI (Commodity Channel Index). As you know, CCI was developed to determine overbought and oversold levels. The CCI does this by measuring the relation between price and a moving average (MA), or, more specifically, normal deviations from that average. This particular indicator shows the modified CCI data from higher timeframe ordered by an input parameter "TF". Green rhombus on the chart represent an UP trend and Red rhom
High, Low, Open, Close — isn't this too much? Sometimes you need a unique history of prices. But if choose one thing, you lose the rest. Smoothing also leads to data loss. Often you lose one of the most important market details: information about extremes. It is due to the preservation of information about the highs and lows, the correct "smoothing" for the history of price is a zigzag. But zigzags also have drawbacks — they do not provide intermediate values. The Price Line indicator solves thi
FREE

Overview This is a very simple indicator that displays the relative strength values of the currencies on te current chart and timeframe. The strength is only calculated for the currencies: AUD - Australian Dollar CAD - Canadian Dollar CHF - Swiss Franc EUR - European Union Euro GBP - Great Britain Pound JPY - Japanese Yen NZD - New Zealand Dollar USD - United States Dollar
These are considered the major currencies in the world. There are 28 distinct combinations of major currency pairs. Other c
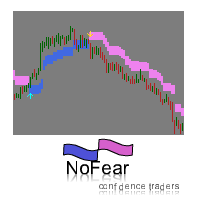
NoFear indicator is based on Advanced Moving Average. It is used in technical chart analysis providing signals whenever a rate change appears that exceeds the upper or lower border. The indicator works very well on trend market. It is easy to find good entry points by blue/violet arrows. The upper and lower bands should be used like support/resistance levels and stop/exit points. All signals do not repaint, and can be used immediately when they are coming. This means we do not need to wait for a
The Zig-Zag indicator is extremely useful for determining price trends, support and resistance areas, and classic chart patterns like head and shoulders, double bottoms and double tops. This indicator is a Multi Time Frame indicator. The indicator is automatically calculate the 3 next available TF and sows ZigZag from those TimeFrames. You cannot use this indicator for the TF greater than D1 (daily).

The MACD offers the best of both worlds: trend following and momentum. Traders can look for signal line crossovers, center-line crossovers and divergences to generate signals. Because the MACD is unbounded, it is not particularly useful for identifying overbought and oversold levels. It is not easy to use any indicator on smaller timeframes because traders cannot not look away from the screen. This classical indicator includes "Alert" function (see screenshots). Keep in mind that this indicator
As we know, МТ4 and МТ5 do not store tick history, which may be necessary to develop trading strategies and market analysis. I have developed a method allowing you to receive tick history very easily. The indicator gathers tick history in real time and writes it to XXXXXX2.hst file, where XXXXXX is a symbol name. This file can be used to create an offline chart or something else. If you use a trading robot, then launch the indicator and control your broker by examining the spread and quotes. All
FREE
Riskscope shows all relevant information about your trades on screen. Information on Stop Loss and Take Profit can be shown as price, pips or exposure. Besides, Riskscope can display a high- and low-watermark of the total of your basket of trades. Settings Riskscope's default settings are good enough most of the time. Nearly all of them are fairly standard. Here are the ones that need some explanation. Monospaced font - set this to the (name of) the font you want to use. A monospaced font looks

Simply drop the indicator to the chart and Fibonacci levels will be shown automatically! The indicator is developed for automatic drawing of Fibonacci levels on the chart. It provides the abilities to: Select the standard Fibo levels to be shown Add custom levels Draw the indicator on the timeframes other than the current one. For example, the indicator is calculated on the weekly period (W1) and is displayed on the monthly period (MN1) Select the timeframes the indicator will be available on Ca

This indicator is based on classical indicators: Commodity Channel Index, Relative Strength Index and Moving Average. I am using this indicator to open a Long position when Red histogram changed to Green histogram beneath zero line and to open the Short position when Green histogram changed to the Red histogram over the zero line . A great advantage of this system lies in the fact that the indicator has no input parameters and adapted to all currency pairs and TimeFrames.

This indicator is designed for M1 time-frame and shows: Sum of ticks when the price goes up (color Green -The major component of a candlestick = the body). Sum of points when the price goes up (color Green -The extension lines at the top of the candle). Sum of points when the price goes down (color Red -The major component of a candlestick = the body). Sum of points when the price goes down (color Red -The extension lines at the lower end of the candle). Plus classical indicator Commodity Channe

EwoMov 지표는 가격 이동 평균 기간이 더 높은 추세를 결정하는 데 유용합니다(200보다 높아야 함).
나는 M5-M30 차트의 스윙 트레이드에 이 지표를 사용하고 있습니다.
이 지표는 계산을 위해 여러 개의 막대를 사용합니다. 모두 외부 매개변수에 저장됩니다. 적절한 값은 5 - 13 - 34이지만 변경할 수 있습니다.
모든 시간대에 준비되어 있지만 M5-H1에는 최선을 다합니다. 이는 다른 시간대에 최적화되도록 설계되었습니다.
스크린샷에서 몇 가지 설명을 찾을 수 있습니다. 이를 사용하려면 EWO 라인, SIGNAL 라인 및 ZERO 라인의 교차점을 찾고 최상의 추세 지표와 함께 진입점을 결정할 수 있습니다.
내 제품에 대한 자세한 내용은 오후를 통해 저에게 연락하실 수 있습니다. 또는 이메일.

This indicator calculates the next possible bar for each currency pair and timeframe. If the next possible Close will be greater than Open, the next possible bar will be in Aqua color. If the next possible Close will be less than Open, the next possible bar will be in Orange color. Of course, the next possible bar will not show the big price movement. This indicator is most useful in the quiet time.

This indicator has only one input parameter - Alerts. If Alerts is true , then Alert message will appear when Long or Short trend starts. Each message contains: time, name of the currency pair and the current timeframe. Green arrow indicates UP trend. Red arrow indicates DOWN trend. This indicator will be helpful when someone is deciding to make Buy or Sell position.
This Indicator will simplify your trading life. The Indicator has no input parameters. Red arrows indicate the beginning of the Down trend and it will be a good time to open a Short position. Green arrows indicate the beginning of the Up trend and it will be a good time to open a Long position.

This indicator is designed for M1 timeframe and shows: sum of ticks when the price goes up divided by sum of ticks when the price goes down (red color); sum of points when the price goes up divided by sum of points when the price goes down (green color). The correlation between the number of ticks and the number of points for each and every minute will give enough data for scalping.

iRSI in iMA is indicator to change color in iMA if iRSI crosses level up (up trend) or crosses level down (down trend). It is a useful tool to track when the upside and the downside iRSI on iMA.
You can to get source code from here.
Parameters MA_Periods — Period for iMA. MA_Method — Method for iMA. RSI_Periods — Period for iRSI. RSI_ApliedPrice — Price used for iRSI. RSI_LevelsUp — Level iRSI for up trend. RSI_LevelsDN — Level iRSI for down trend. BarsCount — How many bars will show the line
FREE

This indicator uses Moving Average to detect markets trend. It's a very useful tool for manual trading. If line is Midnight Blue, indicator detect up trend. If line is Dark Violet, indicator detect down trend. The readings are very simple to use and understand. Indicator works best on H1 timeframe. You can use this indicator with FollowLine to have more accurate signals.
You can to get source code from here .
Parameters BarsCount —How many bars used to show the line. MAperiods —Period of Movin
FREE
iCC in iMA is indicator to change color in iMA if iCCI crosses level up (up trend) or crosses level down (down trend). It is a useful tool to track when the upside and the downside iCCI on iMA.
You can to get source code from here .
Parameters MA_Periods —Period for iMA. MA_Method — Method for iMA. CCI_Periods —Period for iCCI. CCI_ApliedPrice — Price used for iCCI. CCI_LevelsUp — Level iCCI for up trend. CCI_LevelsDN — Level iCCI for down trend. BarsCount — How many bars will show the line. R
FREE

This indicator was inspired by М & W Wave Patterns by A. Merrill. 5 extremums or 4 edges of ZigZag are enough to build M or W pattern at arbitrary offset in the history. The classical approach includes a table of predefined figures of ZigZag waves, which can transform into each other under special rules—so that next edge can be forecasted based on these rules. Unlike to this approach, the indicator analyses available history and builds statistics for all M and W patterns, which differ in their c
This indicator uses Bollinger Bands lines to detect markets trend. It's a very useful tool for manual trading. Furthermore it is possible to use the indicator with ATR as a filter , as well as the option to pop up an alert when a reverse trend occurs. The readings are very simple to use and understand. Indicator works best on H1 timeframe.
You can to get source code from here .
Parameters BarsCount - How many bars used to show the line. BBperiod - Period of Bollinger Bands. BBdeviations - Devi
FREE

VR ATR Pro 는 이전 거래 기간의 통계적 분석 을 기반으로 목표 수준을 결정하기 위한 기술 지표입니다. 이는 선택한 기간 동안의 평균 가격 변동 을 수학적으로 계산하는 데 기반합니다. 통계에 기반한 지표 작동 원리 이 지표의 작동은 가격의 일일 움직임 관찰에 기반합니다: 각 거래 기간은 특정 변동폭 을 특징으로 합니다 — 가격은 시가를 기준으로 위아래로 일정 포인트 거리를 이동합니다. 마찬가지로, 각 새로운 거래 기간이 시작될 때 가격이 조건부 "주행 거리" 를 가지고 있다고 가정할 수 있습니다... 간단한 수학적 계산을 통해 평균값 이 결정됩니다... 이 평균값은 보장된 것은 아니지만, 현재 기간에서 가능한 움직임 크기를 나타내는 기준 역할을 합니다. 따라서 이 지표는 다음과 같은 원리를 적용합니다: 선택한 기간 동안의 역사적 가격 변동 을 분석하고, 통계적 평균값 을 계산하여 차트에 수준을 표시합니다. 이를 통해 트레이더는 현재 금융 상품의 강도 와 "주행 거리" 를 이해
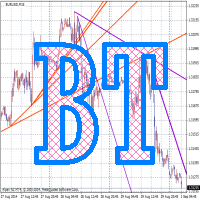
Broken Trends is an indicator for scalpers and intraday traders. The indicator selects and displays trend levels on the chart in the real time mode. The indicator reacts to price momentum: it starts searching for the trends as soon as the momentum amplitude exceeds the threshold set in a special parameter. The indicator can also play a sound when the price crosses the current trend line. In normal mode, the indicator shows only one (last found) upward and one downward trend, but there is an adva
FREE

Introduction to Harmonic Pattern Scenario Planner
The present state of Forex market can go through many different possible price paths to reach its future destination. Future is dynamic. Therefore, planning your trade with possible future scenario is an important step for your success. To meet such a powerful concept, we introduce the Harmonic Pattern Scenario Planner, the first predictive Harmonic Pattern Tool in the world among its kind.
Main Features Predicting future patterns for scenario

This is a multi-timeframe (MTF) indicator displaying support and resistance lines. Support and Resistance lines are calculating automatically from three higher timeframes (TF). Traders may use Support and Resistance to enter positions and update a Stop Loss value.
Input Parameters bPeriod - use this parameter to optimize indicators for each timeframe; VisibleBars - for how many Bars (from the current one) the indicator's lines will be visible. Any changes are possible.

The main purpose of this indicator is to show 2 lines of possible Trailing Stop Loss values: Yellow/Aqua line for Trailing Stop Loss closer to the current price Orange/Blue line for more risky (but more profitable) Trailing Stop Loss. If the line (looks like a staircase) changed the colors from Yellow to Aqua (line #1) and/or from Orange to Blue (line #2) accordingly this mean that we have a situation when a trend changed its course to the opposite. So, this Indicator can be useful to open pos

This Indicator is based on the classical indicator "Relative Strength Index". IT draws 2 lines: Main blue line with input parameter RSIPeriod . Signal red line. Buy when the main line (Blue) falls below a specific level = 30 and then rises above that level and main line rises above the signal line (Red). Sell when the main line (Blue) rises above a specific level = 70 and then falls below that level and main line falls below the signal line (Red).
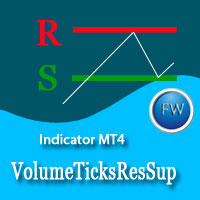
The market price is moved by the market makers with large amounts of equity. The only way to understand intentions of big players is to track their activity by concentration of volumes on one level or another. Volume Ticks ResSup draws a level with the maximum concentration of a tick volume since the beginning of a day. In most cases, such level is an actual support or resistance level. Parameters ColorLevelSupport - support line color; ColorLevelResistance - resistance line color; BarsDayCount
SMARTMASS INDICATOR This indicator is different from all known volume indicators. It has a significant distinction; it is an algorithm that relates price movement to volume, attempting to find proportionality and efficient movement while filtering out noise and other movements that are more random and do not follow a trend or reversal. Ultimately, it reveals the true strength of the movement, indicating whether it has genuine support from bulls or bears or if it's merely a high-volume movement

Do you use dynamic ranges (like Bollinger Bands or Envelopes) in your trading? A fixed period is usually used for such calculations. But is such approach relevant to the very nature of the market? In fact, the price chart consists of a series of successive processes - trends and flats. In this case, we can talk about the internal development logic inside a single process only. Therefore, the nature of the market is better described by dynamic ranges designed for the processes occurring "here and
FREE

MACD Converter is an analogue of the MACD Message with more advanced functionality: It has two signal lines: Signal Line 1 and Line 2, bar outlines are colored according to Line 1, it also triggers the trend notifications. MACD Converter converts the parameters of Fast MA, Slow MA and Signal Line 1 and Line 2 lines from the interval specified in the settings (Convert Time Frame) to smaller timeframes. This allows receiving a signal for making a decision within the specified (Convert Time Frame)

Summary This indicator is based on RSI and Momentum indicators. It also considers moving averages of these two indicators. The three indicators have adjustable settings. The arrows do not repaint since the indicator only uses confirmed values and waits for the candle to close before painting an arrow. The indicator is also able to alert when arrows appear. There are 3 types of alerts - Popup, Email and Mobile Push Notifications. The arrows can be used in the EA and the inputs can also be optimiz
FREE
Do you use dynamic ranges (like Bollinger Bands or Envelopes) in your trading? Usually such calculations use a fixed period, but does it reflect the nature of the market? In fact, the price chart consists of a series of successive processes - trends and flats. In this case, we can talk about the internal development logic inside a single process only. Accordingly, the dynamic ranges built for the process occurring "here and now" suit the nature of the market better. The Growing Bands indicator u
The indicator is designed for easy construction of synthetic charts based on data of various financial instruments. It will be useful both arbitrage and pair trading, as well as for analysis purposes. Its main advantage is simplicity and clarity. Each chart is given as a common mathematical formula. For example, if you want to plot the spread (difference) between EURUSD and GBPUSD with coefficients 4 and 3, then set the following formula: EURUSD * 4 - GBPUSD * 3 The resulting chart is shown in t

Summary This indicator is based on the MA applied to the RSI indicator. It draws arrows at the confirmed crosses of the MA over the RSI line. When the MA crosses upwards, then a buy arrow is displayed and vice versa. The arrows do not repaint since the indicator only uses confirmed values and waits for the candle to close before painting an arrow. The indicator is also able to alert when arrows appear. There are 3 types of alerts - Popup, Email and Mobile Push Notifications.
Inputs All inputs a
FREE

Summary This indicator is based on the MA applied to the Momentum indicator. It draws arrows at the confirmed crosses of the MA over the Momentum line. When the MA crosses upwards, then a buy arrow is displayed and vice versa. The arrows do not repaint since the indicator only uses confirmed values and waits for the candle to close before painting an arrow. The indicator is also able to alert when arrows appear. There are 3 types of alerts - Popup, Email and Mobile Push Notifications.
Inputs Al
FREE

세계 주요 시장의 현재 시간을 표시하는 표시기. 또한 현재 세션을 표시합니다. 사용하기 매우 쉽습니다. 차트에서 많은 공간을 차지하지 않습니다. VirtualTradePad 와 같은 Expert Advisor 및 기타 패널과 함께 사용할 수 있습니다. 차트에 아날로그 시계가 표시된 버전입니다. 친애하는 친구 및 EA 사용자 여러분, 리뷰 섹션에 귀하의 평가를 추가하십시오. Forex 소프트웨어의 모든 업데이트는 무료입니다 ! 이것은 무료 거래 유틸리티입니다! 다른 특징들: 입력 매개변수에 옵션이 있습니다. 버튼 위에 마우스를 놓으면 팁 표시/숨기기, 팁의 언어를 선택할 수도 있습니다. 영어/러시아어; 닫기 버튼은 응용 프로그램을 중지합니다. 최대화/최소화 버튼은 차트의 창을 축소/확장합니다. 창은 차트에서 이동할 수 있습니다. 이렇게 하려면 창 상단 닫기 및 최소화 버튼 근처를 클릭한 다음 창을 원하는 위치로 이동합니다. Expforex,Vladon,Indicat
FREE
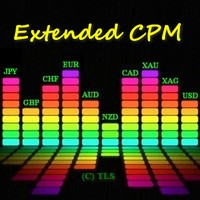
알고리즘은 Currency Power Meter 표시기의 아이디어를 기반으로 합니다. 이 버전에서 표시되는 값의 수는 무제한이며 코드가 더 간결하고 빠르며 현재 막대의 값은 표시기 버퍼를 통해 얻을 수 있습니다. 표시가 보여주는 것 : 얇은 밴드와 통화 앞의 위쪽 숫자는 지난 N시간 동안의 상대 강도 지수를 보여주고(N은 변수 '시간'의 매개변수에서 설정됨), 더 넓은 밴드는 일일 지수를 보여줍니다. 입력 매개변수에서 지정하는 이 통화를 사용하는 통화 쌍이 많을수록(중개인이 쌍에 대한 견적을 제공한다고 가정) 인덱스에 가중치가 더 많이 부여됩니다(그러나 "비주요" 또는 이국적인 통화 쌍에 주의할 수 있습니다. 전체 그림을 왜곡). 예를 들어 EURUSD만 지정하면 유로에 대한 상대 지수는 이 쌍만을 기준으로 계산되고 EURGBP를 추가하면 유로 지수는 두 쌍을 기반으로 계산되어 더 많은 가중치를 얻게 됩니다. 데이터 활용 방법 : 지수 값이 낮거나 높을수록 중요한 뉴스가 없을
FREE
This indicator monitors the vital constants of your trading account to keep it healthy and away from excessive risks. It monitors all trades, absolute exposure, account floating point and leverage currently in use, using different color codes for your interpretation. [ Installation Guide | Update Guide | Troubleshooting | FAQ | All Products | Get Help ] Amazingly easy to understand The indicator is clean and simple It calculates exposure by pairs and currencies Keep your used leverage contr
FREE
NewsMomentum is an indicator that monitors the market between the specified hours and sends an alert to potentially buy or sell when the momentum of the market increases such that there may be a reaction to the news for the observed currency pair. As always, it is best to confirm these movements with other factors such as support and resistance breaks. This indicator works on any timeframe but it is recommended to be used on a smaller timeframe, such as M5, due to the speed at which the news inf

히트맵 표시기 이 히트맵 표시기를 사용하면 Market Watch에서 선택한 모든 기호의 "히트맵"을 표시할 수 있습니다. 이 버전에서는 시장에 대한 간략한 개요를 제공할 수 있는 최종 일일 종가와 관련된 가격 변동률 을 보여줍니다. 거래자가 다른 모든 통화 쌍과 비교하여 통화가 얼마나 강한지 식별하는 데 도움이 되는 도구입니다. 이것은 시각적 도구이며 Expert Advisors 내에서 사용할 수 없습니다. 이러한 의미에서 자동화된 거래자 대신 임의 거래자를 위한 도구입니다. 따라서 자동 거래에 이 도구를 사용하는 데 관심이 있는 사람들에게는 불행히도 이것이 불가능합니다. Bovespa Brazil Exchange와 같은 주식 또는 선물 시장에 특히 유용합니다.
설정 히트맵 표시기에서 사용자 정의할 몇 가지 설정이 있습니다. <머리> <바디> 최대 허용 기호는 200개입니다. Market Watch에 200개가 넘는 기호가 포함되어 있으면 처음 200개만 표시됩니다. 많은 기호를

IceFX Heatmap is a special indicator that shows the places where the price has been staying and ranging over the past few days. These sites will be displayed in a "Heatmap style", with which you can clearly see the main formed bands. The main rates (where the price has "lingered/stayed" much) are indicated in bright colors (in case of black-and-white view) or red color (in case of color view).
Settings Days - the number of days the heat(map) is calculated for. Resolution - resolution rate. 10 =
FREE

Indicator finds most prominent extremums (highs and lows) in history and displays their price levels for currently visible range of prices. 8 levels are shown at most. This is a tool for those who used to lookup the history for important levels formed by reversal points outliers. If price scale is changed manually or adjusted automatically for changes in time scale, indicator visualize all found levels (if any) inside visible area. The width (importance) of a level depends from a number of times

Monster Harmonics Indicator is a harmonic pattern indicator. It recognizes Gartley, Bat, Crab, Butterfly, Cypher, White Swan, Black Swan, Shark and several other patterns. Projected patterns that are not yet completed are recognized, too. Monster even shows the PRZ (Potential Reversal Zone). Users can add their own user defined patterns to Monster. Besides the current pattern, Monster also shows all patterns in the symbols history. Monster will provide alerts for developing patterns. Introduced

The difference between the arithmetic and geometric means at the specified range. Since the greater is the difference between the values, the greater the resulting figure is, actually the indicator shows volatility fluctuations. The arithmetic mean of a certain number of values is the sum of the values divided by their number. The geometric mean is the root of the power of the number of values extracted from the product of these values. If all values are equal, the arithmetic mean and th

MonsterDash Harmonic Indicator is a harmonic pattern dashboard. It recognizes all major patterns. MonsterDash is a dashboard that displays all detected patterns for all symbols and (almost) all timeframes in sortable and scrollable format. Users can add their own user defined patterns . MonsterDash can open and update charts with the pattern found.
Settings MonsterDash's default settings are good enough most of the time. Feel free to fine tune them to your needs. The color settings are for thos

The difference between the arithmetic and geometric means at the specified range. Since the greater is the difference between the values, the greater the resulting figure is, actually the indicator shows volatility fluctuations. The arithmetic mean of a certain number of values is the sum of the values divided by their number. The geometric mean is the root of the power of the number of values extracted from the product of these values. If all values are equal, the arithmetic mean and th
FREE
An indicator of patterns #50 and #51 ("Triple Bottoms", "Triple Tops") from Encyclopedia of Chart Patterns by Thomas N. Bulkowski.
Parameters: Alerts - show alert when an arrow appears Push - send a push notification when an arrow appears (requires configuration in the terminal) PeriodBars - indicator period K - an additional parameter that influences the accuracy of pattern shape recognition. The smaller the value is, the smoother the row of peaks/valleys should be, so fewer patterns will b
An indicator of pattern #54 ("Dead cat bounce") from Encyclopedia of Chart Patterns by Thomas N. Bulkowski.
Parameters: Alerts - show alert when an arrow appears Push - send a push notification when an arrow appears (requires configuration in the terminal) PeriodBars - indicator period GapSize - minimum gap size in points ArrowType - a symbol from 1 to 17 ArrowVShift - vertical shift of arrows in points Auto5Digits - automatic multiplication of GapSize and ArrowVShift by 10 when working w
An indicator of pattern #55 ("Dead cat bounce, inverted") from Encyclopedia of Chart Patterns by Thomas N. Bulkowski.
Parameters: Alerts - show alert when an arrow appears Push - send a push notification when an arrow appears (requires configuration in the terminal) PeriodBars - indicator period GapSize - minimum gap size in points ArrowType - a symbol from 1 to 17 ArrowVShift - vertical shift of arrows in points Auto5Digits - automatic multiplication of GapSize and ArrowVShift by 10 when

An indicator of patterns #24, #25, #26 and #27 ("Head and Shoulders", "Complex Head and Shoulders") from Encyclopedia of Chart Patterns by Thomas N. Bulkowski.
Parameters: Alerts - show alert when an arrow appears Push - send a push notification when an arrow appears (requires configuration in the terminal) PeriodBars - indicator period K - an additional parameter that influences the accuracy of pattern shape recognition. The smaller the value is, the smoother the row of peaks/valleys should
MetaTrader 마켓 - 트레이더를 위한 로봇 및 기술 지표는 거래 터미널에서 바로 사용할 수 있습니다.
The MQL5.community 결제 시스템은 MQL5.com 사이트의 모든 등록된 사용자가 MetaTrader 서비스에서 트랜잭션을 수행할 수 있습니다. 여러분께서는 WebMoney, 페이팔, 또는 은행 카드를 통해 자금을 예치하거나 인출하실 수 있습니다.
