MetaTrader 4용 새 기술 지표 - 70

Magic Lines MT4 is an indicator which can be categorized as trend, levels and channels type. It draws a colored line which is colored in green and red depending where last close is. The value at the current open bar should not be taken into account. This part of the indicator can give us a sense whether it is trending up or down or its going sideways. Magic Lines indicator also draws blue top and bottom levels which can be taken into account for breakouts and false breakouts. A sideway zone shou
AI Signal is an indicator that is a ready to made scalping system that doesn't repaint
Instructions: Load indicator. Use arrows as entries in trends and stay out of sideways markets. Trade with the larger trend and trade only active volatile hours Buy blue arrow above yellow and exit at red arrow or at discretion. Sell red arrow below yellow and exit at blue arrow or at discretion.
Easy to follow and is based on trends. The indicator works on all time frames and assets. Use at your own d

Indicator help you recognize trend quickly ( recommended to use TF M30-Daily ) Parameters: Alert when have signal Push Notification to MT4 mobil2 Benefits Easy to use. input parameters is simple The ability to use as filter for any strategy. It work on stock, index, oil, gold, and on all time frames. It has the function of push-notifications, and sound alerts. Importance : Non Repainting Indicator

Diagnosis of major and minor pivot
Trend detection
with many signals
Can be used in all symbols
Can be used in all time frames
Settings:
Back Show: The number of candles it displays
If you need any adjustments, or have any questions or suggestions, message me
How to trade:
Blue: sell signal
Red: buy signal
Blue and red at the same time: no signal
Exit signal: Opposite signal

Forecasting the future by combining trend and average price
with many signals
Can be used in all symbols
Can be used in all time frames
Settings:
BackShow: The number of candles displayed
Osi: Main setting, the larger the number, the longer the trend
If you need more settings, or have any questions or suggestions, message me
How to trade:
Blue: sell signal
Red: buy signal
Blue and red at the same time: no signal
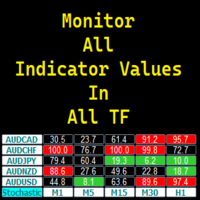
ALL in ONE Indicator Display Indicator values in all Timeframes Display Multiple Symbols/Pairs Fully customizable Click any value/box to open the chart of the corresponding symbol and timeframe Attach multiple instance of the program to display other indicator values Flexible Dashboard Positioning in chart You may request more indicators or additional feature for future updates!

NOTE: NEXT PRICE WILL BE 550$ Dear Trader I hope you have been eagerly waiting and looking for a tool to improve your trading. I am so glad to introduce my other product to you called Trend Shooter Index. The main goal of this tool is to help traders shoot the trend (target the trend) from the bottom or from the top of the trend for maximum profitability. How is the Indicator designed
This tool is designed to show the following Red arrows pointing down for sell signals. Blue arrows pointing up f

Forex trading support timer: - This is an indicator that supports a trader's trading process. - Before placing a BUY or SELL order, it is advisable to observe what the current time is like, to get the best position when trading. Function of indicator: - Display information about candle closing time of different timeframes (M1,M5,M15,H1), best used when Scalping. - Show market spreads. - Show TimeZone Trading. - Displays the remaining time of a session.
FREE

UR 트렌드소진
UR TrendExhaustion은 매개 변수 값이나 기타 설정을 다루고 싶지 않은 트레이더를 위한 최고의 솔루션입니다. 모든 사람이 쉽고 시각적으로 이해할 수 있습니다.
UR TrendExhaustion 사용의 이점:
매개변수 없음 차트에서 진행되는 상황을 가장 잘 설명하는 3개의 선이 있습니다: Trend Exhaustion Line, Whale Money Line 및 Retail Money Line. 인터페이스는 양쪽 극단(빨간색 영역)에서 어느 한 라인의 소진을 보여줍니다. 최고의 장점: 쉽고 모든 자산에 맞게 조정됩니다. 도구 업데이트를 최신 상태로 유지하고 빠진 것이 있다고 생각되면 요청을 보낼 수 있는 특별한 텔레그램 채팅이 있습니다!
왜 UR TrendExhaustion인가?
나는 내 경력 전반에 걸쳐 많은 종류의 지표를 코딩해 왔으며 차트에서 다른 도구 없이도 거래할 수 있는 이 간단하면서도 최고의 (imo) 도구를 코딩하기 위해 모든

UR 볼륨트렌드
UR VolumeTrend는 볼륨 측면에서 진행 중인 추세를 보여주는 가장 명확한 볼륨 표시기입니다. UR TrendExhaustion과 같은 다른 지표와 완벽하게 작동하여 로컬 고점과 저점을 나타냅니다.
단 2개의 매개변수로 제한됩니다. 값이 높을수록 더 긴 추세가 표시됩니다. 기울기 극단은 잠재적 반전을 포착하기 위해 가능한 볼륨 소진을 보여줍니다. 두 줄 - 거래량 추세 및 평균입니다. 최고의 장점: 쉽고 모든 자산에 맞게 조정됩니다. 도구 업데이트를 최신 상태로 유지하고 빠진 것이 있다고 생각되면 요청을 보낼 수 있는 특별한 텔레그램 채팅이 있습니다!
왜 UR VolumeTrend인가?
거래량이 추세를 파악하는 데 중요하다는 데 모두 동의할 것입니다. 이 오실레이터는 사용하기 쉬운 하나의 표시기로 압축된 모든 볼륨 도구의 합계입니다. 보기 편한 방식으로 양수/음수 양을 보여줍니다. 뒤의 인터페이스는 볼륨이 과거에 비해 소진될 가능성이 있는지 또는

DYJ 카멜레온은 추세 추적 및 역추세 시스템을 기반으로 합니다. DYJ 카멜레온은 높은 확률의 지시기이다.이 지표는 독특한 혼합 지표를 사용하여 복잡한 지표와 사용자의 판단력을 결합시킨다. 이 지표는 가장 선진적인 Ma 교차와 방차 알고리즘이다. 이 표시기는 거래자의 가장 좋은 진입 및 종료 위치를 표시하는 컬러 방향 화살표를 표시합니다. 입장은 BUY 신호이며, 동시에 그것은 지난번 입장 셀의 퇴장 신호이기도 하다. 너는 우편이나 핸드폰을 통해 신호 통지를 받고 핸드폰을 통해 수동으로 창고를 개설할 수 있다 매개 변수 InpPeriod = 50 -- Period InpPrice = PRICE_TYPICAL – 가격 적용 방법, 선호도와 거래 습관에 따라 더 좋은가격 방법 InpMethod = MODE_SMA - 4가지 MA 모드 방법, MODE_SMA,MODE_EMA,MODE_SMMA,MODE_LWMA

UR 다이버전스스포터
UR DivergenceSpotter는 다년간의 경험의 결과이며 때로는 가장 쉬운 방법이 최고입니다. 몇 가지 지표 사이에는 좋은 상관 관계가 있지만 일치하지 않을 때 가격이 "재조정"을 시도하고 UR DivergenceSpotter에서 신호를 받는 순간입니다.
UR Divergence Spotter 사용의 이점:
매개변수 없음 양초가 생성된 후 다시 칠하지 않음 신호가 더 이상 유효하지 않을 때 신호를 보냅니다(즉, 거래를 더 오래 유지할 수 있고 손절매를 BE로 설정하고 그대로 두거나 일부 이익을 취하거나 완전히 청산할 수 있음을 의미합니다!). 이 지표는 다년간의 경험과 관찰의 결과입니다. 견고하고 테스트되었습니다. 더 나은 결과와 더 안전한 신호를 위해 더 높은 시간 프레임(h1/h4)에서 사용하는 것이 가장 좋습니다.
추가로 더 나은 신호 정확도를 위해 UR TrendExhaustion 또는 UR VolumeTrend와 같은 다른 지표와 함

"Scalping trading strategy" - the indicator was created for trading using the scalping system. "Scalping trading strategy" shows on the chart with an arrow where the price will go now. After the indicator draws an arrow, the price will go in the direction of the arrow by at least 20 points. This is enough for us to trade effectively. "Scalping trading strategy" does not redraw its signals. The indicator has many different modes of operation. It can draw an arrow both at the beginning of a new c
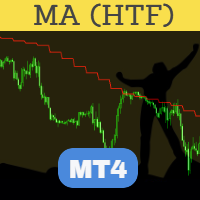
Perfected MA (Moving Average) HTF (Higher Time Frame) is perhaps the most advanced and reliable HTF indicator. Highly optimized in terms of execution, the indicator comes with standard settings of the MA indicator which is supplied with the MT4 platform. Place the indicator on the chart, any timeframe. You may select a higher time frame in indicator inputs. The same indicator can be used on a chart multiple times to draw MA from multiple timeframes or for different MA values. A must-have tool t
FREE

Price pivot points H1 - an indicator that shows price pivot points on the H1 timeframe with an accuracy of up to 95%. 95 signals from 100 will accurately indicate the place of the price reversal in the opposite direction. The indicator does not redraw its values. Suitable for trading on any currency pair. It can be used for both intraday scalping and long-term trading. Price pivot points H1 shows signals as arrows. When the price reverses, the indicator will draw an arrow on the chart. If the p

indicators to facilitate analysis based on Oma Ally's BBMA strategy by displaying CSAK (CSD), CSM and Extreme labels on the chart 1. Displays the Bollinger Band line 2. LWMA 5-10 High and Low 3. EMA 50 4. Fibonacci 5. MHV . area 6. Alert & Show labels BBMA consists of the use of 2 indicators: Moving Averages Bollinger Bands BBMA consists of 3 types of entries: Extreme MHV Re-Entry Moving Average Settings: There are 5 MAs used in the system: 2 High Moving Averages, 2 Low Moving Averages and
FREE

This is a Multi pair and Multi time frame dashboard. The founder of the system is Mr. Oma Ally, which is a system based from Bollinger Band and Moving Average(BBMA). BBMA consists of the use of 2 indicators: Moving Averages Bollinger Bands BBMA consists of 3 types of entries: Extreme MHV Re-Entry Rejection EMA50 This Dashboard Help you to scan current Extreme, Reentry setup, Rejection EMA50 and also MHV How to read signals:
find the same color in 3 different timeframes in succession
For exampl
FREE

Professional Support&Resistance Indicator. This indicator is primarily intended for professional use by brokers. There are countless options to choose from and it is one of the best tools in the stock market today. The indicator is optimized for use with EAs.
For programmers to retrieve output index value is for MQL4; (EXAMPLE)
bool buySNR=false,sellSNR=false;
char count=100;
char limit=1;
char dist=3;
for(short cnt=0;cnt<=count;cnt++)
{
double snr_middle=iCustom(NULL,TF_,"::Indicators\\SN
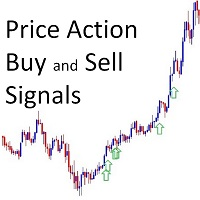
Buy and Sell Arrows On The Chart According To Price Action Sends Alerts On MT4 To Your Phone To You Email
Does NOT repaint. Works on any pair, any timeframe.
10 Activations allowed so you are free from limitations. MT5 Version here . For spreads from a tiny 0.1pip RAW/ECN Accounts, click here . Check out my Waka Esque EA signal here: >> High Risk Settings or Medium Risk Settings .
When you get a signal, all you need to do is check the previous structue highs and lows to use as your

Fractal Structures Breakout Trader !!SPECIAL PRICE FOR THE FIRST 10 COPIES!!
A next generation powerfull indicator which brings a new approach to fractal theory Indicator tries to scan and find the fractal breakouts. Momentum, price action and harmonic calculations are also used to complete the algo. Advantages: No Repaint Works on all chart timeframes. Works for every instrument including Currency Pairs, Gold, Oil, Commodities, Indices, Stocks and Cryptocurrencies. Easy to use. User and CPU fr
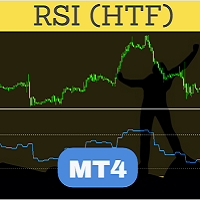
Perfected RSI (Relative Strength Index) HTF (Higher Time Frame) is perhaps the most advanced and reliable HTF indicator. Highly optimized in terms of execution, the indicator comes with standard settings of the RSI indicator which is supplied with the MT4 platform. Place the indicator on the chart, any timeframe. You may select a higher time frame in indicator inputs. The same indicator can be used on a chart multiple times to draw RSI from multiple timeframes or for different RSI period values
FREE

This is a regression tree indicator for MT4/MT5.
This indicator classificate nodes on the time period so that the deviation becomes smaller,
and displays regression line and channel for each node.
It's free!
Attached CartDemo.ex4 and CartDemo.ex5 is a Demo version and has the following limitations:
Can't use HighSpeed method (default method is RandomForest)
Maximum number of bars is 260 (increase from 200)
There is no expiration date and can be started many times, but it stops after an hour.
FREE

The Spots Indicator can be used for Entering and Exiting your trades based on the common candlestick patterns such as: engulfing, hanging man, doji etc. It is designed to publish desktop and mobile notification every time a signal is triggered. However, it is worth noting that this indicator is recommended to be used with other indicator for confirming the entries. It is best to use it with the Investment Castle Trend Lines indicator and the Supply and Demand indicator
FREE

Robin Scalper indicator is calculated based on advanced algorithm of several indicators.
The algorithm provides highly reliable entry points, and its simple settings allow using it for all symbols, time frames and trading styles.
Signals are generated at the closing of a bar and are not repaint .
Setting Parameters : Indicator Name - Indicator Name. Trend Period - Trend Period of the indicator. Filter - Signal smoothness. EMA fast Filter - Fast EMA filter. EMA slow Filter - Slow EMA filt
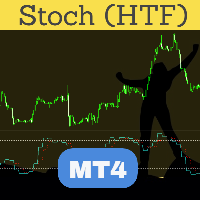
Perfected Stochastic HTF (Higher Time Frame) is perhaps the most advanced and reliable HTF indicator. Highly optimized in terms of execution, the indicator comes with standard settings of the Stoch indicator which is supplied with the MT4 platform. Place the indicator on the chart, any timeframe. You may select a higher time frame in indicator inputs. The same indicator can be used on a chart multiple times to draw Stoch from multiple timeframes or for different Stoch values. A must-have tool t
Индикатор iVeles_Trend_X_II - использует специализированный расчет текущих цен графика. Очень качественно и своевременно показывает смену направления, более того, отображаемая цена индикатора может быть использован в качестве уровня принятия решения. Работает качественно на любом ТФ и с любым инструментом. Параметры: period - период расчетов average - усреднение МА method - применяемый метод shift - сдвиг показаний
Индикатор iVeles_Perfect_Oscilator является опережающим и одним из самых лучших осциляторов на сегодняшний день, использует специализированный расчет текущих цен графика. Очень качественно и своевременно показывает смену направления, очень точный подход к уровням перекупленности и перепроданности, что позволяет своевременно принять решение по сделке. Работает качественно на любом ТФ и с любым инструментом. Параметры: period_Osc - период расчетов average_Osc - усреднение МА method_Osc - прим
AlgoKing Chandelier Exit Indicator (MT4)
The Chandelier Exit Indicator is a volatility based indicator that maximizes returns using the Average True Range (ATR) value and the highest high or lowest low of a period. Benefits Should be used as a trailing stop. Helps you exit a position when you have a respectable profit. Identifies a high probability of a trend reversal when the price moves against the prevailing trend by a distance equal to 3x the average volatility. Join the AlgoKing Lightning

极大的提升了交易感官,一目了然的走势展示,简洁高效。 极大的突出展示了行情的趋势脉络,跟随时间周期适应变化,替用户交易者研判了行情走势,简洁高效 同时我们还提供了主窗口和副窗口的展现,有需要可以联系我作者本人,感谢支持。 像传统的renko,又不是传统的renko,技术在发展,同样的砖图可以有不一样的绘制和计算展现。 希望可以帮到大家的交易,再次感谢。
极大的提升了交易感官,一目了然的走势展示,简洁高效。 极大的突出展示了行情的趋势脉络,跟随时间周期适应变化,替用户交易者研判了行情走势,简洁高效 同时我们还提供了主窗口和副窗口的展现,有需要可以联系我作者本人,感谢支持。 像传统的renko,又不是传统的renko,技术在发展,同样的砖图可以有不一样的绘制和计算展现。 希望可以帮到大家的交易,再次感谢。

This Indicator is a very Simple Method to make profit from the market! it has two arrow directions up and down. you can easily buy when you see up arrow and close it when you see down arrow. you can use it for Binary Options too! you also can use it with other indicators like Heiken Ashi and Ichimoku to make a complete System of Trading. it has just two Input Options: nBars: The Number of Candles you want to see the Signals for. ShowPanel: to display or not to display the Panel DoAlert: to Send

Indicator Support and Resistence plain in your chart seven lines; Red line=Resistence 3. Red line=Resistence 2. Red line=Resistence 1. Yellow line= Pivot. Green line= Support 1. Green line= Support 2. Green line= Support 3. adattable in all timeframe (minute 1, minute 5, minute 15, minute 30, Hour 1, Hour 4,Day 1,Week 1,Mounth 1); Buy under support and sell over the resistence;
***SALE NOW ON***
We've all been there, searching for that profitable trade wading through 25 pairs but missing out because we didn't see it in time.
This is why I say trade simple trade effective and why I designed this scanner to keep watch on the markets that are trending and where a pullback could be able to happen.
Features:
Automatically looks at up to 28 pairs at the same time to save you from having to. Easily adjustable EMA settings to your own critera (Fast, Mid and slow settings
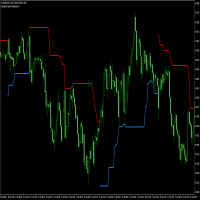
TP Trend Bars Indicator is a trend following technical indicator which is based on price action focusing on the swing highs and lows.
This indicator plots 2 types of lines. The first line is a dotted line, represnting the short-term trend. The second line is a solid line, representing the long term trend
Lines which are below the price action when on a bullish trend and above the price when the trend is bearish The solid line also changes color to indicate trend direction
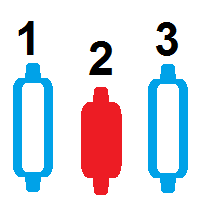
촛대 카운터 표시기 이 표시기는 모든 시간대의 차트에 있는 양초를 계산합니다. mt4에서 다운로드할 수 있는 무료 바 카운터 촛대 카운터는 더 큰 차트 안에 얼마나 많은 양초가 있는지 계산합니다. 이 촛대 카운터를 사용하면 자동 촛대 카운트를 할 수 있습니다. 자동으로 막대를 다운로드하고 계산할 수 있는 무료 촛대 카운트 표시기 bar counter to count the bars count candle counter indicator mt4 count candle MT5용 캔들 카운터 이 지표에 관심이 있는 경우 계속 개선할 수 있도록 댓글을 남겨주세요. chosdae kaunteo pyosigi i pyosigineun modeun sigandaeui chateue issneun yangcholeul gyesanhabnida. mt4eseo daunlodeuhal su issneun mulyo ba kaunteo chosdae kaunteoneun deo keun chateu a
FREE

MT4용 주기 식별자 표시기는 거래자가 매수 및 매도 포지션을 열 수 있는 조건이 언제인지 식별할 수 있도록 필터링된 가격 조치 신호를 생성합니다.
Cycle Identifier MT4 지표는 단기 및 장기 거래자 모두에게 적합한 맞춤형 지표입니다. 사이클 식별자 MT4는 거래자가 매수 및 매도 포지션을 열 수 있는 조건이 언제인지 식별할 수 있도록 필터링된 가격 조치 신호를 생성합니다.
작동 방식 주기 식별자 MT4 표시기는 진동하는 회색 선을 그리는 기본 차트 아래에 별도의 표시기 차트에 표시됩니다. 이 회색 선은 시장 추세와 추세 모멘텀을 보여주기 위해 각각 녹색과 빨간색 막대가 동반되는 상승 및 하락 스파이크가 특징입니다.
백그라운드에서 지표는 SMA(Smooth Moving Averages), RSI(Relative Strength Index) 및 가격 조치 필터 지표의 조합을 사용합니다. 이를 통해 지표는 시장 추세를 식별하고 강도(모멘텀)를 분석하며 잘못된 신호도
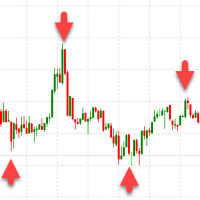
Scalping trader - the indicator is designed for intraday trading (scalping). Does not redraw arrows. Shows possible price reversals on the chart with arrows. The accuracy of the signals is approximately 96%. That is, in 96% after the arrow appears on the screen, the price will go in the opposite direction by at least 40 points for the GBPUSD pair. The trading strategy is very simple. We are waiting for the arrow to appear on the chart. After the arrow appears, open an order in the direction of

VIP signal for binary options.
This indicator was created specifically for binary options. Set up for profitable work in binary options.
Try this indicator if you want to trade binary options profitably.
The terms of trade are very simple. We are waiting for directions. We open a deal on the current timeframe in the direction.
< < < Indicator non repaint > > >
Many users have already rated it positively. The results will surprise you too.
According to the test results, this indicator per

Provides Regression Channel on the current chart. Combined by Trend of Moving Averages and Multi timeframes Oscillator Indicators: CCI, RSI, Stochastic, and MACD with specific working logic . It could make us easier to identify swing high-low as an entry point, the retracement area while following the current trend. Consists of 2 types of signal, main and secondary. The main signal will draw very clearly triangle and lines on the chart with the word " BUY" or 'SELL'. and the secondary is the sta

This Beautiful Real Entry indicator is designed for signal trading. This indicator generates trend signals.
It uses many algorithms and indicators to generate this signal. It tries to generate a signal from the points with the highest trend potential.
This indicator is a complete trading product. This indicator does not need any additional indicators.
The indicator certainly does not repaint. The point at which the signal is given does not change.
The indicator has a pips counter.
The best indicator for Binary Options is now available at the MQLMarket, this version is already configured and optimized to operate with Binary Options, Forex and Cryptocurrencies. It is composed of a momentum algorithm that looks for better opportunities in the market, bringing you the best points to open your positions with low risk and high proportion of gain.
The MQL version can also be incorporated into the MT2 signal automator.
Product features Common signals (Oscillator) Super

Version History Date Version Changes 07/08/2022 1.00 Initial Release Description The Aroon indicator is a technical indicator that is used to identify trend changes in the price of an asset, as well as the strength of that trend. In essence, the indicator measures the time between highs and the time between lows over a time period. The idea is that strong uptrends will regularly see new highs, and strong downtrends will regularly see new lows. The indicator signals when this is happening, and
FREE
Version History Date Version Changes 07/09/2022 1.10 Initial released Description The RedeeCash RSI is your typical RSI indicator with the three latest RSI calculations exposed as global variables for easier integration with scripts and expert advisors. Code Sample To invoke this indicator from an EA or script, call the iCustom metatrader function, iCustom ( Symbol (), PERIOD_CURRENT , "Market/RedeeCash RSI" , 14 , 1 , 0 ); string RSIVarName = StringConcatenate ( Symbol (), "_rsi" ); string RSIP
FREE

The indicator automatically sets trendlines on the really important points directly on the chart. Timeframe, color and style of the lines can be adjusted. Notification of a breakout above or below the line via a smartphone is possible.
Input Parameters TimeFrame : Choose timeframe Formation : Choose swing, Shoulder head shoulder or long term formation Alerts : true = alert is on SendEmail : Send message to email address
SendNotifications : Send message to smartphone or tablet
AlertAtClose : A
Индикатор iVeles_Channel_Extremum_II_MTF вычисляет точки слома направлений движения цены на установленном в параметрах ТФ, на основе этих точек и выбранного их количества строится основной канал цены, который можно использовать в качестве уровней поддержки и сопротивления для меньшего ТФ, на котором установлен индикатор. В зависимости от направления движения основного тренда рассчитывается средняя линия канала по уровню Фибоначи, от которой, как правило, идет отскок в сторону тренда. Также по ур
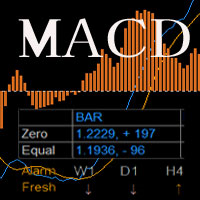
MACD with two lines and bar,
Predict the price, moniotr all period, play sound when it changed.
If there is any other need, contact me.
MACD = [stockPrices,12]EMA - [stockPrices,26]EMA signal = [MACD,9]EMA divergence = MACD – signal User Inputs Fast EMA Period - Fast moving average line, the default period is 12. Slow EMA Period- Slow moving average line, the default period is 26. Signal SMA Period - set signal period , the default period is 9.
Индикатор iVeles_MACD_Pro представляет симбиоз обычного индикатора MACD или разницу показаний между двух динамических МА, рассчитанных по текущим ценам инструмента. Сигнальная линия отсутствует, но ее заменяет более точные динамические облачные уровни.
Хорошо показывает разворотные моменты, позволяет точно определять дивергенции. Имеет цветовое сопровождение изменения показаний.
Параметры: period_Fast - период быстрой МА period_Slow - период медленной МА price_Bar - применяемая цена level -
Индикатор iVeles_RSI представляет собой обычный RSI, привязанный к нулевой отметке . В отличии от обычного RSI, наложены уровни сигнала в виде облака, что заметно расширяет области применения данного индикатора.
Очень хорошо показывает разворотные моменты, так же позволяет точно определять дивергенции.
Параметры: period - период RSI price - применяемая цена level - уровень облака
Индикатор iVeles_RVI представляет собой обычный RVI, с пересчитанными и приведенными значениями . В отличии от обычного RVI, наложены уровни сигнала в виде облака, что заметно расширяет области применения данного индикатора.
Очень хорошо показывает разворотные моменты и циклы тенденций, так же позволяет определять дивергенции.
Параметры: period - период RVI price - применяемая цена level - уровень облака
Индикатор iVeles_DeMarker представляет собой обычный DeMarker, с пересчитанными и приведенными к нулю значениями . В отличии от обычного DeMarker, наложены уровни сигнала в виде облака, что заметно расширяет области применения данного индикатора.
Очень хорошо показывает разворотные моменты и циклы тенденций, так же позволяет определять дивергенции.
Параметры: period - период DeMarker level - уровень облака
Индикатор iVeles_CCI представляет собой обычный CCI . В отличии от обычного CCI, наложены уровни сигнала в виде облака, что заметно расширяет области применения данного индикатора.
Очень хорошо показывает окончание трендов, разворотные моменты и циклы тенденций, так же позволяет определять дивергенции.
Параметры: period - период CCI price - применяемая цена level - уровень облака
Индикатор iVeles_Moment представляет собой обычный Momentum, с пересчитанными и приведенными к нулю значениями . В отличии от обычного Momentum, наложены уровни сигнала в виде облака, что заметно расширяет области применения данного индикатора.
Очень хорошо показывает разворотные моменты и циклы тенденций, может применяться как основной сигнал для входа в позицию.
Параметры: period - период Momentum price - применяемая цена level - уровень облака

What is the Overlay Chart Indicator? The Overlay Chart indicator is exactly as its name suggests. It is a custom technical indicator which overlays another price chart over the current price chart window. It allows traders to overlay another currency pair over one pair which allows them to compare price movements and the characteristics of price action. It then plots a grid to indicate the price of the overlaid currency pair for better reference. It also plots the open, high, low, and close pric

The indicator rely on The Toby strategy >> The mother candle which is bigger in range than the previous six candles.
A vertical line shows the last Toby Candle with the targets shown up and down. The strategy is about the closing price out of the range of the toby candle to reach the 3 targets..The most probable to be hit is target1 so ensure reserving your profits and managing your stop lose.
FREE

FinArk Support and Resistance is an indicator that will detect support and resistance zone that are drawn on the chart by automatic. Supply Demand uses previous price action to identify potential imbalances between buyers and sellers. This trend detection indicator will compliment any strategy and can also be used as an independent tool.
We can enter in good price with this Indicator, in order to follow the strong demand on the current instrument.

이 표시기는 ogive 모양을 기반으로 합니다. 이러한 모양은 공기 역학 및 우주 기술에 사용됩니다. 총알도 일종의 타원형입니다. 기술 지표에서 이러한 형식을 사용하면 지표의 민감도와 안정성 사이의 절충안을 달성할 수 있습니다. 이는 적용 시 추가적인 가능성을 제공합니다. 표시 매개변수: iType - ogive 형식의 유형입니다. iPeriod - 표시 기간. iFactor 는 포물선 및 지수 형식에 사용되는 추가 매개변수입니다. 유효한 값은 0 - 255입니다. iFactor = 0이면 지표가 단순 이동 평균으로 퇴화합니다. iChannel - 가격이 움직이는 상위 및 하위 채널을 구축할 수 있는 매개변수입니다. 유효한 값은 -128부터 127까지입니다. 값이 양수이면 위쪽 채널이 그려지고 음수이면 아래쪽 채널이 그려집니다. 이러한 매개변수를 결합하여 다른 결과를 얻을 수 있습니다. 지표는 시장의 추세 가격 움직임을 추적하는 데 사용할 수 있습니다. 채널을 구축하면 가격이 움직
이것은 무료 제품이므로 필요에 따라 사용하시면 됩니다!
긍정적인 별 5개 평가를 남겨주시면 정말 감사하겠습니다! 감사합니다!
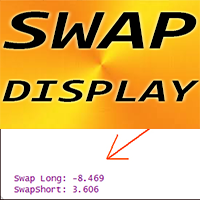
여기를 클릭하여 고품질 트레이딩 로봇과 지표를 확인하세요! ........................................................................ MT4용 외환 지표 SWAP 디스플레이, 훌륭한 보조 거래 도구.
- SWAP 디스플레이 지표는 외환 쌍의 롱 및 숏 거래에 대한 현재 SWAP을 첨부된 위치에 표시합니다. - 차트의 어느 모서리에서나 SWAP 디스플레이 값을 찾을 수 있습니다. - 색상과 글꼴 크기도 설정할 수 있습니다. - 각 거래자는 1일 이상 거래를 열어 둘 때 SWAP을 알아야 합니다. 이 MQL5 웹사이트에서만 제공되는 오리지널 제품입니다.
FREE

Hma Vvm Hull은 모든 시장에서 작동하는 전문 지표이며 통화 쌍을 거래할 때 특히 효과적이며 추세를 변경하는 초기 추세를 보여줍니다. 표시기에는 다양한 거래 방법 및 거래 전략과 함께 성공적으로 사용할 수 있는 많은 설정이 있습니다. 하나의 차트에 매개변수가 다른 여러 지표를 설치할 수 있습니다. 다양한 맞춤형 알림을 통해 거래자는 항상 시장 상황을 제어하고 적시에 시장에 대한 올바른 진입점을 찾을 수 있습니다.
지표를 사용하면 수익성 있는 거래의 수를 크게 늘릴 수 있음을 알 수 있습니다.
지표와 거래하는 세 가지 주요 방법이 있습니다.
1. 가격이 표시선을 돌파한 직후에 포지션을 엽니다.
2. 첫 번째 롤백에서 라인 재도색 신호를 받은 후 시장에 진입합니다.
3. 추세를 따라 모든 후속 풀백에 대한 항목.
설정:
TimeFrame - 시간 프레임 설정. 현재 - 현재 TF. 또한, 1분에서 1개월까지.
TimeFrameAuto - 더 높은 시간 프레임의 데
이 지표는 고전적인 Zigzag 지표가 만든 각 가격 스윙마다 위아래 화살표를 표시합니다. Zigzag가 새로운 스윙 저점을 만들면 녹색 화살표가 표시되며, 새로운 스윙 고점을 만들면 빨간색 화살표가 표시됩니다.
기능
고전적인 ZigZag에 비해 스윙 지점을 더 효과적으로 표시합니다. 차트 패턴이 형성되는 것을 미리 파악하는 데 도움이 됩니다. 여러 시간 프레임에서 Zigzag 방향을 보여주는 다중 시간대 스캐너 포함. 모든 MetaTrader 알림 기능 포함.
입력값 깊이(Depth): Zigzag 전환점에서 고려되는 캔들의 수를 결정하는 정수값입니다. 편차(Deviation): 방향이 바뀌기 전의 백분율 편차입니다. 백스텝(Back Step): Zigzag 고점/저점 사이의 최소 캔들 수입니다. MTF 스캐너: 여러 시간 프레임에서 ZigZag 방향을 표시합니다. 알림 설정
단점 Zigzag는 리페인트되고 지연되는 특성을 가진 지표입니다. 따라서 이를 기반으로 하는 화

이 지표는 RSI의 과매수/과매도 영역 위와 아래로 이동한 막대 수를 기준으로 강세/약세 시장 상태를 표시합니다. 녹색 히스토그램은 강세(매수) 힘을 나타내며, 빨간색 히스토그램은 약세(매도) 힘을 나타냅니다.
특징
새로운 거래 진입에 사용할 수 있으며, 다른 전략이나 지표를 통한 거래 확인에도 활용할 수 있습니다. 멀티타임프레임 스캐너를 포함하여 모든 시간 프레임에서 강세/약세 힘을 분석합니다. 초보 트레이더가 강세/약세 힘을 활용하여 진입을 확인하고 자신감을 높이는 데 이상적입니다. 모든 MetaTrader 알림 기능 포함.
입력 매개변수 기간: RSI의 과매수/과매도 수준을 식별하는 데 사용되는 기간. 막대 기간: RSI의 과매수/과매도 수준 위/아래에 포함될 막대 수. 과매도 수준: RSI에서 과매도 수준을 결정하는 값. 과매수 수준: RSI에서 과매수 수준을 결정하는 값. MTF 스캐너: 사용 가능한 모든 시간 프레임에서 신호를 가져오는 멀티타임프레임 스캐너. 알
SSL은 Semaphore Signal Level(세마포 신호 레벨)의 약자로, 각각 고가와 저가에 적용된 두 개의 이동 평균선을 통해 가격을 따라가는 밴드를 형성하는 지표입니다. 매수 신호: 종가가 상단 이동 평균선 위에서 마감될 때. 매도 신호: 종가가 하단 이동 평균선 아래에서 마감될 때.
주요 기능 모든 시간 프레임에서 새로운 신호를 감지하는 다중 타임프레임 스캐너 내장. 전통적인 SSL 채널을 간단하게 구현하여 추세 방향을 손쉽게 파악 가능. 모든 MetaTrader 경고 기능을 포함합니다.
SSL 계산 방식 상단 라인: 캔들의 고가에 적용된 이동 평균선. 하단 라인: 캔들의 저가에 적용된 이동 평균선.
매수 진입: 종가가 SSL 상단 라인 위에서 마감될 때. 매수 청산: 종가가 SSL 하단 라인 아래에서 마감될 때.
매도 진입: 종가가 SSL 하단 라인 아래에서 마감될 때. 매도 청산: 종가가 SSL 상단 라인 위에서 마감될 때.

이 인디케이터는 2005년 Alan Hull이 개발한 고전적인 HMA를 수정하고 향상시킨 버전입니다. 세 가지 가중 이동 평균(WMA)을 조합하여 지연을 줄이고 더 빠르고 부드러운 추세 반응을 제공합니다. 매수 진입: HMA가 빨간색에서 파란색으로 바뀌며 상향 기울기를 가질 때. 매도 진입: HMA가 파란색에서 빨간색으로 바뀌며 하향 기울기를 가질 때.
특징 모든 시간 프레임에서 새로운 신호를 탐지하는 다중 시간대 스캐너 포함. 전통적인 이동 평균에서 흔히 발생하는 지연 문제를 HMA는 효과적으로 줄입니다. 신규 추세의 시작과 종료를 효과적으로 식별합니다. 모든 MetaTrader 알림 기능을 지원합니다.
HMA 공식 Hull 이동 평균은 아래 세 가지 WMA 계산식을 통해 산출됩니다: WMA1 = P × WMA WMA2 = P/2 × WMA Raw HMA = (2 × WMA1) - WMA2 Final HMA = Raw HMA의 WMA(√P) P = 기간 WMA = 가중 이동

This indicator receives tick data from the terminal and then averages it with three moving averages. This will allow you to catch the trend even inside the M1 candle. The sliding parameters can be adjusted manually. You can also specify the indicator drawing depth.
In order for the indicator to start working, place it on the chart and let it work for several minutes - for normal operation, it needs to collect an array of quotes. This product is designed for aggressive trading, but it is also u

Witch Hat for Binary Options is an indicator for binary options based on analysis of Bollinger Bands and RSI, using a modulated strategy with indicator settings using complex filters. This indicator never repaints, it has an almost accurate answer for you to make the entries.
There are two ways for you to analyze your entry, when an arrow appears you have more than 90% chance of hits, and the other way is the lines that it automatically draws and its trend line.
It has surprisingly strong sup
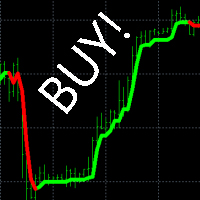
"Buy Sell Alert" - an indicator that shows the trader where the trend is going and when to open a deal. If the indicator draws a green line on the chart, we open a buy order. If the indicator draws a red line on the chart, we open a sell order.
Benefits of the indicator: latency percentage less than 3% signal accuracy over 96% does not redraw its values to build a trading strategy, it is enough to use this one indicator. very easy to set up works on all currency pairs and all times Description

"M1 Scalping Turbo" - indicator for intraday scalping. With this indicator, you can trade on M1, M5, M15, M30, H1 timeframes. We recommend currency pairs GBPUSD, EURUSD, USDJPY, USDCHF, USDCAD, EURAUD, EURCAD, EURNZD, GBPCAD, GBPAUD.
Trading rules:
The indicator shows with arrows on the chart when you need to open a deal, in which direction to open a deal, where to put TakeProfit and StopLoss. Lot size is up to you. We recommend using no more than 10% of the deposit for 1 trading transaction

Работа индикатора показана в видео во время тестирования на исторических данных. Индикатор поддержек сопротивлений в основном создавался для H4, хотя возможна работа и на других таймфреймах. Присутствует алерт появления очередной поддержки или сопротивления. Также в индикатор встроены восходящая поддержка и нисходящее сопротивление, которые неплохо себя показали. Есть возможность отключения лишнего. Для удобства на экран выведены кнопки, которые работают онлайн. https://youtu.be/UHhM1J-sX2E

This Real Super Trend Signal indicator is designed for signal trading. This indicator generates trend signals.
It uses many algorithms and indicators to generate this signal. It tries to generate a signal from the points with the highest trend potential.
This indicator is a complete trading product. This indicator does not need any additional indicators.
The indicator certainly does not repaint. The point at which the signal is given does not change.
The indicator has a pips counter.

Trendfinder SMA With Zone and Alert are Colored candlesticks showing the trend based on two SMA as Signal and two SMA as a Buy and Sell Zone and the slope of the slow moving average. This indicator will give you the color change on the next bar on the confirmation candle and will provide alert on Buy and sell signal, when it enters the buy and sell zone and when the market test the buy or sell zones as support or resistance and will never repaint . This indicator has the following: 2 SMA for th
FREE

GM Reverse Indicator works on Fibonacci along with some other tweaks
-> It is programmed to automate 100% when the market fluctuates This indicator I use to find support points. It really works and I want to share it with you.
-> Simply attach the GM Reversal Indicator to any chart you want. The larger the timeframe, the better the signal quality (you should use with the timeframe from H4) -> This is my signal : https://www.mql5.com/en/signals/1415444
Please leave me a positive review, if th
FREE
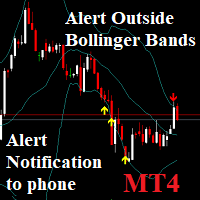
Notifications outside of Bollinger Bands: Send phone Notification and window alerts when price breaks out of Bollinger bands Low & High. You can set the value Alert, Notification. And On OFF Alert on Terminal, Notification on Smartphone. Notifications - Client Terminal Settings - MetaTrader 4 Help
How to Setup MT4/MT5 Mobile Alerts Right to Your Phone (forexschoolonline.com)
MetaTrader 마켓은 거래 로봇과 기술 지표들의 독특한 스토어입니다.
MQL5.community 사용자 메모를 읽어보셔서 트레이더들에게 제공하는 고유한 서비스(거래 시그널 복사, 프리랜서가 개발한 맞춤형 애플리케이션, 결제 시스템 및 MQL5 클라우드 네트워크를 통한 자동 결제)에 대해 자세히 알아보십시오.
트레이딩 기회를 놓치고 있어요:
- 무료 트레이딩 앱
- 복사용 8,000 이상의 시그널
- 금융 시장 개척을 위한 경제 뉴스
등록
로그인
계정이 없으시면, 가입하십시오
MQL5.com 웹사이트에 로그인을 하기 위해 쿠키를 허용하십시오.
브라우저에서 필요한 설정을 활성화하시지 않으면, 로그인할 수 없습니다.