MetaTrader 4용 새 기술 지표 - 73
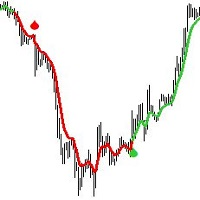
Introducing the Tear Drop Indicator: Your Gateway to Confident Forex Trading.
The Tear Drop Indicator is a powerful MetaTrader 4 tool designed to simplify trend identification and streamline entry point selection. Built upon customized Moving Average principles, this intuitive indicator offers traders an unparalleled advantage in navigating the forex market.
Key Features: 1. Customized Moving Average: The Tear Drop Indicator harnesses the power of customized Moving Averages, providing traders
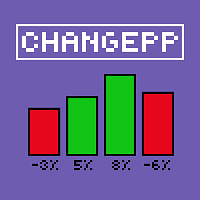
About the ChangePP indicator
The ChangePP indicator displays the percentage price change for the selected period according to the selected parameters and builds the corresponding bars in the indicator subwindow.
Clicking on a bar or pair name opens the corresponding chart with the period specified in the input parameters.
Without a doubt, the ChangePP trading indicator will be useful for traders using the correlation of currency pairs, as well as for analyzing the situation on the market.
FREE
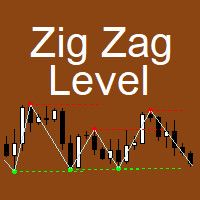
The indicator implements the author's approach to the construction of the popular "Zig-Zag" indicator.
The advantages of the "ZIgZag Level" indicator is that it filters out market noise and shows levels.
"ZIg Zag Level" is based on peaks and troughs, displays levels.
These levels can be disabled and configured.
The indicator displays the price of the level, the price tag can be disabled.
The "zigzag" line between the points can also be disabled.
The indicator has a built-in notification s

TrendMMK is an extremely simple indicator. The Buy and Sell signal changes as soon as the indicator flips over the closing price. When the TrendMMK closes below the Price, a Buy signal is generated, and when the TrendMMK closes above the Price, a Sell signal is generated.
TrendMMK is a trending indicator, and like all trending indicators it works well in trending markets. However, it does give lesser false signals than a lot of other indicators and hence if you are an intraday trader who want
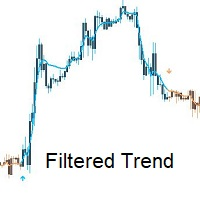
Introducing Filtered Trend: Your Reliable Companion in Forex Trading.
Filtered Trend is a powerful MetaTrader 4 indicator that revolutionizes trend identification and entry point selection in the forex market. Built upon customized Moving Average principles, this intuitive indicator offers traders a simple yet effective tool for navigating the complexities of currency trading.
Key Features: 1. Customized Moving Average: Filtered Trend leverages customized Moving Averages to provide traders wit
MACD Pro - Features a built-from-scratch overhauled MACD indicator - Signals Buy and Sell Zones - Uses an exceptional noise cancelling filter - Signals up trends and down trends - Precise and accurate signals
MACD Pro is an indicator built from the ground up and is designed to signal optimal buy and sell zones. Take buy trades in the buy zones and sell trades in the sell zones. It includes a noise cancelation feature which rivals the best products on the market.
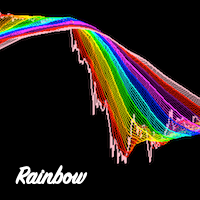
Rainbow Ribbon - Rainbow MA bands - Useful for spotting trend changes - Useful for spotting trend slopes - Useful for spotting trend acceleration - Ability to choose ribbon colors, moving averages, and distances - Provides colorful rainbow ribbons to show an array of moving averages
Rainbow Ribbon is an extremely useful indicator, it has been designed to make it easy to spot the trend and also changes within the trend before they occur. It can be used many different ways and provides the abili

KT Candlestick Patterns Scanner is a Multi-Symbol and Multi-Timeframe scanner that fetches and shows various candlestick patterns on 28 currency pairs and 9 time-frames concurrently . The scanner finds the candlestick patterns by loading the KT Candlestick Patterns indicator as a resource in the background.
Features
The scanner can find the candlestick patterns on 252* combinations of symbols and time-frames from a single chart. Open the signal's chart loaded with a predefined template with a s
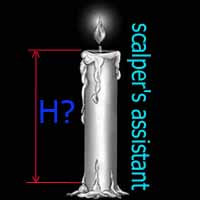
Индикатор "TakeOver" простой в использовании, создавался он для удобства определения разницы между открытием и закрытием текущей свечи. "TakeOver" рекомендуется применять в скальпинге с различными стандартными индикаторами МТ4, к примеру Envelopes, ZigZag, RSI и т.д. В настройках по умолчанию установлены уровни 200 и -200, но вы можете самостоятельно изменить. Один из примеров обнаружения входа в открытие сделки изображено на скриншоте, SELL если свеча закрылась выше уровня Envelopes и гистогра
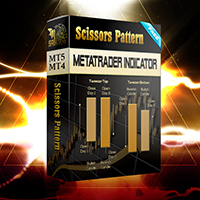
Configure scaffolding charts and signals based on the scissor pattern, which works great at low times.
Buy and sell signs based on 2 previous candle patterns
It works on the active time form, and when detecting the pattern in 4 time frames, 5 minutes, 15 minutes, 30 minutes and one hour, the alert can be set to notify us of the formation of this pattern.
MetaTrader version 5 click here
How to use:
When there is an opportunity to buy or sell, the marker places a scissors mark on the candlest

Tra le tecniche alternative di trading più utilizzate dagli investitori, uno spazio interessante va dato alla strategia Ichimoku cloud che si basasulle nuvole (kumo).
Queste ultime sono il vero fulcro del sistema di trading Hichimoku Kinko Hyo. Molti erroneamente pensano che l’Ichimoku Kinko Hyo sia un semplice indicatore trend following, mentre invece è un vero e proprio sistema di trading completo .
Infatti grazie a UN SOLO grafico (sia pure molto complesso) ci dà una visione completa

This indicator is very useful for day traders or short term traders. No need to calculate the number of pips manually, just look at the chart and you will see the Virtual Take Profit / Virtual Stop Loss target line and evaluate whether the entry point is feasible to reach the intended target or not.
Enter the intended Take Profit / Stop Loss pips for your trade. The indicator will display Virtual Take Profit / Virtual Stop Loss lines for you to easily see if the target is feasible or not.
FREE

KT MACD Alerts는 MetaTrader에서 제공되는 표준 MACD 지표를 기반으로 한 맞춤형 구현입니다. 다음 두 가지 이벤트 발생 시 알림을 제공하며 차트에 수직선을 표시합니다: MACD가 0선을 위로 돌파할 때 MACD가 0선을 아래로 돌파할 때
기능 모든 시간 프레임에서 MACD 방향을 보여주는 MTF(멀티 타임프레임) 스캐너가 내장되어 있습니다. MACD의 0선 상단 및 하단 크로스 신호에 따라 거래하는 트레이더에게 적합합니다. 알림과 함께 수직선을 자동으로 표시하여 교차 지점을 더 쉽게 식별할 수 있습니다. 가볍고 최적화된 코드로 설계되어 메모리와 시스템 자원을 거의 소모하지 않습니다. 팝업, 알림음, 이메일, 푸시 알림 등 MetaTrader에서 제공하는 모든 알림 방식을 지원합니다.
MACD의 역사 MACD(Moving Average Convergence Divergence, 이동 평균 수렴 확산 지표)는 주식 및 외환 시장에서 널리 사용되는 기술적 분석
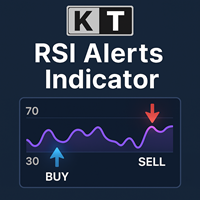
KT RSI Alerts는 RSI(상대강도지수) 오실레이터의 사용자 맞춤형 버전으로, 다음의 네 가지 사용자 지정 이벤트에 대한 신호와 알림을 제공합니다: RSI가 과매수 구간에 진입할 때 RSI가 과매수 구간에서 벗어날 때 RSI가 과매도 구간에 진입할 때 RSI가 과매도 구간에서 벗어날 때
기능 RSI의 과매수/과매도 구간 내 움직임을 기반으로 거래 전략을 구성하는 트레이더에게 매우 적합합니다. 가볍게 설계된 인디케이터로 시스템 자원을 거의 소모하지 않습니다. MetaTrader의 모든 알림 기능을 완벽하게 지원합니다.
RSI(상대강도지수)의 역사 RSI는 J. Welles Wilder가 개발하였으며, 1978년에 출판된 『New Concepts in Technical Trading Systems』와 같은 해 6월 발행된 Commodities 잡지에 처음으로 소개되었습니다. RSI는 모멘텀 오실레이터로 분류되며, 가격 움직임의 속도와 강도를 측정합니다. 상승 종가와 하락 종가

이동 평균은 이동 중에 변경됩니다. 표시기는 이동 평균을 계산할 기간을 자동으로 선택합니다. 움직임이 방향성 일수록 평균화 기간이 길어집니다. 추세가 느려지면 이동 평균의 기간이 감소하고 더 빨라집니다. 이를 통해 추세 변화에 더 빨리 반응 할 수 있습니다.
표시기는 추세 또는 추세 반전 지점에서 잘 작동합니다. 옆 방향으로 표시기는 다른 방법으로 사용할 수 있습니다(예:빠르게 움직이는 표시기가 느린 표시기를 위쪽으로 교차 할 때).이 신호는 판매 신호입니다. 또는 채널을 사용하여 대략적인 구매 또는 판매 영역을 결정할 수 있습니다. 설정에서 채널 표시를 활성화 할 수 있습니다.
매개 변수:
자동 계산을위한 막대-이 막대 수에 대해 표시기는 극단을 찾고 마지막 극단의 시간에 따라 이동 평균의 기간을 계산합니다.
승수-이동 평균의 차이를 설정합니다.
속도-이동 평균의 전환 속도를 한 기간에서 다른 기간으로 변경합니다.
채널-채널 표시를 활성화 또는 비활성화합니다.
인
FREE

KT Heiken Ashi Alert는 표준 Heiken Ashi 캔들에 기반하여 매수 및 매도 화살표를 표시하고 다양한 알림을 생성하는 유용한 트렌드 보조 도구입니다. Heiken Ashi를 거래 전략에 통합하고 싶은 트레이더에게 필수적인 도구입니다. Heiken Ashi가 하락 상태에서 상승 상태로 전환되면 매수 화살표가 표시됩니다. Heiken Ashi가 상승 상태에서 하락 상태로 전환되면 매도 화살표가 표시됩니다. 모바일 알림, 이메일, 사운드, 팝업 알림 모두 지원됩니다.
Heiken Ashi란? Heiken Ashi(平均足)는 일본어로 "평균 바"를 의미하며, 기존의 일본식 캔들보다 트렌드를 더 쉽게 파악할 수 있도록 설계된 차트 유형입니다. 이 캔들은 진입과 청산 전략 모두에 활용될 수 있으며, 색상이 바뀌면 종종 시장 방향의 전환을 의미합니다.
중요 포인트
Heiken Ashi Alerts를 단독으로 사용하는 것은 추천하지 않으며, 다른 보조 지표와 함께 사용하는
KT Pip Counter 는 실시간으로 핵심 데이터를 표시해 주는 간단하면서도 유용한 지표입니다. 수익·손실, 스프레드, 잔여 시간 같은 정보를 한눈에 파악할 수 있어, 급변하는 장세에서도 침착하게 대응하고 의사결정 속도를 높일 수 있습니다.
특징
현재 손익을 통화, 핍, 퍼센트로 동시에 표시. 실시간 스프레드를 표시. 현재 캔들이 마감될 때까지 남은 시간을 알려줌. 손익 상황에 따라 색상을 자동 변경. 텍스트 위치와 레이아웃을 자유롭게 설정 가능. CPU 사용량이 매우 낮아 플랫폼이 느려지지 않음.
입력값 Account P&L: true이면 계좌 전체 손익, false이면 현재 종목 손익만 표시. 색상 및 글꼴 크기 설정. Show After Current Bar: true이면 캔들 종료 후 정보 표시, 아니면 차트 구석에 고정. 나머지 입력값은 직관적으로 이해 가능.

KT Pivot Points는 최신 데이터를 기반으로 일간, 주간, 월간 피벗 레벨을 차트에 자동으로 표시합니다. 피벗 포인트는 외환 시장을 포함한 기술적 분석에서 널리 사용되는 지표입니다.
주요 기능
가격이 피벗 레벨에 도달하면 알림을 전송합니다. 각 피벗 레벨 종류별로 완전한 사용자 지정이 가능합니다. 일간, 주간, 월간 피벗 레벨을 깔끔하게 표시합니다. CPU 자원을 적게 사용하여 빠르게 계산됩니다. 차트상의 다른 지표들과 호환됩니다.
피벗 포인트란? 피벗 포인트는 전일의 고가, 저가, 종가의 평균을 이용하여 계산됩니다. 이 계산된 피벗 포인트를 기반으로 향후의 지지 및 저항 수준을 예측할 수 있으며, 이는 해당 수준 근처에서의 가격 움직임을 판단하는 데 도움이 됩니다. 일반적으로 가격이 피벗 포인트 위에서 거래되면 강세 심리를, 아래에서 거래되면 약세 심리를 나타냅니다.
피벗 계산식
피벗 레벨을 계산하기 위해 전일, 주간 또는 월간의 고가, 저가, 종가 데이터를
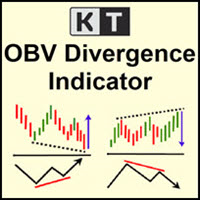
KT OBV Divergence는 가격과 OBV(온밸런스 볼륨) 오실레이터 사이에 형성되는 일반 및 숨겨진 다이버전스를 표시합니다.
기능
비대칭 다이버전스는 정확도를 높이고 시각적 혼란을 줄이기 위해 자동으로 제외됩니다. 추세 전환 및 추세 지속 전략 모두에 활용 가능합니다. Expert Advisor에 완벽히 통합 가능한 구조로 설계되었습니다. 진입 신호뿐만 아니라 청산 신호로도 활용할 수 있습니다. MetaTrader의 모든 알림 기능을 지원합니다.
다이버전스란 무엇인가요?
기술적 분석에서 일반적으로 가격이 더 높은 고점을 만들면 오실레이터도 더 높은 고점을 만들어야 하며, 가격이 더 낮은 저점을 만들면 오실레이터도 같이 낮아져야 합니다. 이와 같은 정상적인 관계가 무너질 때, 가격과 오실레이터 간에 다이버전스가 발생한 것으로 봅니다. 다이버전스는 크게 두 가지 유형이 있습니다: 일반적인 강세 다이버전스: 가격은 더 낮은 저점을 만들지만, 오실레이터는 더 높은 저점을 만듭

KT Currency Strength Meter는 주요 외환 통화쌍에 적용된 종합적인 수학 공식을 통해 각 통화의 강세와 약세를 측정하는 인디케이터입니다. 고정된 기간 동안의 양봉과 음봉을 기반으로 통화의 강도를 계산하며, 이 데이터를 기반으로 알고리즘이 가장 강한 통화와 가장 약한 통화를 실시간으로 정렬하고 지속적으로 업데이트합니다.
장점
강한 통화에 대해 약한 통화를 매수하려는 잘못된 신호를 걸러내어 거래 전략을 즉시 개선할 수 있습니다. 의도하지 않은 헤지나 과도한 거래를 방지할 수 있습니다. 강세 통화에 대해 약세 통화를 매수하는 등의 고위험 역추세 거래를 피할 수 있습니다. 서로 상쇄되는 포지션을 필터링할 수 있습니다. 가장 최근 데이터를 기반으로 실시간 업데이트가 이루어집니다. 가볍고 최적화된 코드로 CPU 리소스를 최소화하여 다른 전략이나 인디케이터의 작동에 영향을 주지 않습니다. 각 통화는 고유 색상으로 표시되어 시각적으로 빠르게 구분할 수 있습니다. 복잡한 설정 없
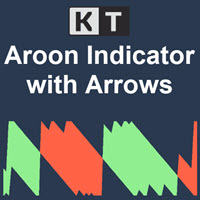
KT Aroon 오실레이터는 1995년 Tushar Chande가 처음 개발한 원래 Aroon 오실레이터를 수정한 버전입니다. 이 지표는 최근 고가와 저가 사이의 시간 간격을 측정하고, 이를 기반으로 시장 추세의 방향과 강도를 계산합니다. 가격은 상승 추세에서는 새로운 고점을 연속으로 형성하고, 하락 추세에서는 새로운 저점을 형성한다는 개념에 기반해 작동합니다. 매수 신호: Aroon Up 라인이 Aroon Down 라인을 상향 돌파할 때.
매도 신호: Aroon Down 라인이 Aroon Up 라인을 상향 돌파할 때.
특징
Aroon 신호를 가격 차트에 표시하는 위/아래 화살표가 표시됩니다. 시장 추세를 효율적으로 보여줍니다. 차트가 복잡하지 않고 깔끔하게 구성됩니다. 모든 MetaTrader 알림 기능을 지원합니다.
입력 설정 기간: Aroon Up 및 Aroon Down 라인을 계산할 기준 기간입니다. 화살표 표시: True로 설정 시, 새로운 신호가 발생할 때마다 차트
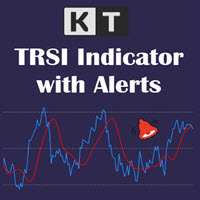
KT TRSI는 RSI(상대강도지수), EMA(지수이동평균), SMA(단순이동평균)를 조합하여 만든 오실레이터입니다. 기존의 RSI와 비교했을 때, SMA의 평활화 기능 덕분에 TRSI는 잘못된 신호에 덜 민감합니다. 또한, 모든 종류의 MetaTrader 알림 기능을 완벽히 지원합니다.
간단한 진입 규칙
매수: 파란 선(RSI)이 빨간 선(TRSI)을 상향 돌파할 때. 매도: 파란 선(RSI)이 빨간 선(TRSI)을 하향 돌파할 때.
고급 진입 규칙 매수: 파란 선(RSI)이 과매도 수준 아래로 내려갔다가 다시 위로 올라가며 빨간 선(TRSI)과의 상승 교차가 발생할 때. 매도: 파란 선(RSI)이 과매수 수준 위로 올라갔다가 다시 아래로 내려가며 빨간 선(TRSI)과의 하락 교차가 발생할 때.
TRSI를 사용할 때는 다른 보조 지표들과 함께 확인 신호를 병행하는 것이 중요합니다.
TRSI 공식
트리플 EMA = RSI의 EMA를 세 번 반복 적용한 값. TRSI = 트리플

KT Bollinger Bands Alert는 기존 볼린저 밴드 지표를 개선한 버전으로, 가격이 밴드에 닿을 때 알림을 제공하며 각 밴드에 개별적인 가격 태그가 표시됩니다.
알림 이벤트
현재 가격이 볼린저 밴드의 상단 밴드에 닿을 때 현재 가격이 볼린저 밴드의 중간 밴드에 닿을 때 현재 가격이 볼린저 밴드의 하단 밴드에 닿을 때
기능 각 밴드에 대해 별도의 알림 이벤트 제공 반복적이고 성가신 알림을 방지하기 위한 사용자 지정 시간 간격 설정 가능 더 나은 분석을 위해 각 밴드에 가격 태그 추가 최소한의 CPU 자원만 사용하는 순수 자체 개발 코드 모든 Metatrader 알림 방식 포함
입력값 히스토리 바 수: 계산에 사용할 캔들 수 볼린저 밴드 기간 편차 이동 적용 가격 밴드 색상 알림 간 최소 시간 (분) 알림 설정
볼린저 밴드에 대해 더 알아보기 볼린저 밴드는 1980년대 John Bollinger에 의해 개발되었습니다. 이 지표는 기본적으로 세 개의 이동 평균으로 구성

KT Forex Volume은 통화쌍의 매수 및 매도 거래량을 컬러 히스토그램 형태로 표시합니다. 거래량은 자산에 대한 매수 및 매도 거래로 구성됩니다. FX 시장에서: 매수량이 매도량보다 많으면 해당 통화쌍의 가격은 상승하는 경향이 있습니다. 매도량이 매수량보다 많으면 해당 통화쌍의 가격은 하락하는 경향이 있습니다.
주요 기능 틱 볼륨 데이터를 활용하여 나쁜 거래를 피할 수 있습니다. 시장 내 큰 자금을 움직이는 플레이어의 방향에 따라 거래할 수 있도록 도와줍니다. Metatrader의 모든 알림 기능이 포함되어 있습니다.
틱 볼륨 활용하기 기타 시장과 달리, 현물 외환 시장은 중앙 집중식이 아니기 때문에 개인 트레이더가 실제 볼륨 데이터를 얻는 것은 매우 어렵습니다. 2011년 베테랑 외환 트레이더 Caspar Marney가 발표한 연구에서는 틱 볼륨과 실제 거래량 사이에 높은 정확도와 상관관계가 있다고 결론지었습니다.
히스토그램 계산 공식
KT Forex Volume 지표
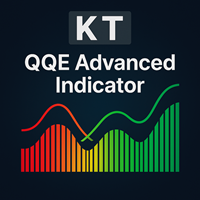
KT QQE Advanced 는 클래식 QQE 오실레이터를 색상 히스토그램과 빠른·느린 Trailing Line(TL) 로 재구성하여 더 정확하게 표현한 개선 버전입니다.
기존 QQE 와 달리, KT QQE Advanced 는 히스토그램 형태에 과매수/과매도 레벨을 표시해 추세의 과열 여부를 직관적으로 확인할 수 있습니다.
활용
MTF 스캐너로 모든 시간대에서 매수·매도 신호를 즉시 탐색. 트렌드 방향을 더욱 정확히 파악. 과매수·과매도 구간을 탐지. 가격 모멘텀을 가시화.
입력값 RSI 기간 스무딩 기간 MTF 스캐너 알림 설정
QQE란? QQE는 Quantitative Qualitative Estimation 의 약자로, 초‑스무딩 RSI 와 ATR 을 결합해 만든 오실레이터입니다. 일반 RSI 대신 Wilder RSI 를 사용하며, 이는 특수한 EMA 방식으로 평활화됩니다. Wilder 평활식 = 이전 MA + (1/n × (종가 − 이전 MA))
Ready trading strategy. The indicator shows price reversal points on the chart. In places of a possible price reversal, the indicator draws an arrow. If the indicator draws a green arrow, then the price will move up. If the indicator draws a red arrow, then the price will move down. The indicator also draws an average line on the chart. It is displayed in yellow. With a probability of 95%, if the indicator draws a green arrow, and the price is below the line, then in the near future the price w

Trading with the help of the MACD indicator has become even more convenient. Flexible settings will help you choose what you really need in your trading. Use the strategy that you need - the indicator uses 3 strategies. Download the demo right now! I recommend watching my advisor - Night Zen EA Subscribe to my telegram channel, link in my profile contacts - my profile See also my other products on mql5.com - my products Advantages of the indicator: In this indicator, the interpretation of th
FREE
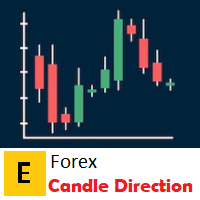
Simple indicator that supports decision makers. You will have the candles directions for different timeframes on your screen. That will allowed you to be one more scenario to analyze before you open your orders. In case you would like to have more details, just let me know.. so we can add it to the chart. Multicurrency that in inform you the directions for multi-timeframes!

MACD divergence indicator finds divergences between price chart and MACD indicator and informs you with alerts (popup, mobile notification or email). Its main use is to find trend reversals in the chart. Always use the divergence indicators with other technical assets like support resistance zones, candlestick patterns and price action to have a higher possibility to find trend reversals. Three confirmation type for MACD divergences: MACD line cross zero level Price returns to previous H/L Creat
FREE
The key level supply and demand indicator is the first supply and demand indicator with options to change settings to show different zones, giving you the choice to pick the zones you see are being respected the most and saving the settings.
Advantages
The key level supply and demand DOES NOT REPAINT unlike other supply and demand currently in the market. This gives you a massive advantage to scroll back and see how price reacted on previous levels. The key level supply and demand has the opt

About the Lyne indicator
Lyne is a Metatrader 4 (MT4) indicator, the essence of which is to transform the accumulated historical data.
The Lyne indicator makes it possible to detect various features and patterns in price dynamics that are invisible to the naked eye.
Based on this information, traders can anticipate further price movement and adjust their strategy accordingly.
This indicator has proven itself in the scalping strategy. The indicator works without repainting.

Levels Pro System рассчитывает канал движения цены, учитывая волатильность инструмента, бары и тренд, - и на основании расчетных данных показывает тренд и чертит уровни поддержки/сопротивления в очень удобном визуальном представлении. В индикатор встроена система определения критических точек (критических баров), которая позволяет трейдеру значительно проще выявлять истинный пробой уровня, ложный пробой, отскок от уровня, возможный сигнал на ранней стадии движения цены итд. Таким образом, торгов
Этот индикатор является уникальным в своём роде, больше всего подходит для скальпинга на XAUUSD а также для торговли на более старших таймфреймах!
Уведомление сообщит самые важные точки входа, поэтому следует торговать по тренду. Идеален для скальпинга! The Best Trend Signals - трендовый мультивалютный индикатор, может использоваться на любых финансовых инструментах валюта, криптовалюта, металлы, акции, индексы. Рекомендуемый тайм-фрейм M15, M30, H1, H4, D1.
Как торговать с помощью индикатора
FREE
40% off. Original price: $50
ATR Scanner Pro is a multi symbol multi timeframe volatility scanner that monitors and analyzes Average True Range indicator value in up to 28 symbols and 9 timeframes in 3 modes : ATR value: As a volatility dashboard it shows the ATR indicator value in all pairs and timeframes and signals when the ATR value reaches a maximum or minimum in a given duration. Short term ATR/Long term ATR ratio: It shows ratio of 2 ATRs with different periods. It's useful in detecti

"The trend is your friend" is one of the oldest and best-known sayings in financial markets. However, this message only represents half of the picture. The correct saying should be, "The trend is your friend only until it ends." KT Trend Filter solves this problem by clearly indicating the start of an Uptrend and Downtrend using an averaging equation on the price series. If the trend direction is not clear, it shows the trend as sideways showing the uncertainty in the market.
Features
Get a big
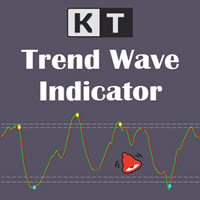
KT Trend Wave is an oscillator based on the combination of Price, Exponential, and Simple moving averages. It usually works great to catch the short term price reversals during the ongoing trending market. The bullish and bearish crossovers of the main and signal lines can be used as buy/sell signals (blue and yellow dot). It can also be used to find the overbought and oversold market. The buy and sell signals that appear within the overbought and oversold region are usually stronger.
Features

This indicator detects trade direction and sends notification to your mobile phone so that you can enter/exit a trade without having to be seated in front of desktop computer all day and night. Although you have to execute/send an order yourself, you can setup rules through the setting made available for proper lots size base on the available balance/fund you are trading with. The opportunity to take a profit at the right time and set reasonable stop loss that will not be overwhelming and gett

DayNight HighLow is base on support and resistance levels, as well as averages of highs and lows. It detects trade direction and sends notification to your mobile phone so that you can enter/exit a trade without having to be seated in front of desktop computer all day and night. Although you have to execute/send an order yourself, you can setup rules through the setting made available for proper lots size base on the available balance/fund you are trading with. The opportunity to take a profit

DayNight moving averages along with support and resistance make a remarkable difference if properly utilized This indicator detects trade direction and sends notification to your mobile phone so that you can enter/exit a trade without having to be seated in front of desktop computer all day and night. Although you have to execute/send an order yourself, you can setup rules through the setting made available for proper lots size base on the available balance/fund you are trading with. The opport
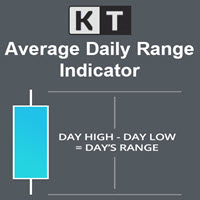
KT Average Daily Range(ADR) shows the upper and lower levels using the average daily range covered by the currency pair or the instrument. The average daily range is calculated using the chosen period in the input settings. ADR High: ADR upper level is found by adding the average daily range value to the current day's low.
ADR Low: ADR lower level is found by subtracting the ADR value from the current day's high.
Features
It shows the ADR levels with several other helpful information benefici
KT Fisher Transform is an advanced version of the original Fisher Transform oscillator equipped with divergence detection, crossover alerts, and many more features. Originally it was developed by John F. Ehlers. It converts the asset's price into a Gaussian normal distribution to find the local extremes in a price wave.
Features
A light-weighted oscillator that efficiently identifies the upward and downward crossovers and marks them using vertical lines. It also finds regular and hidden diverg
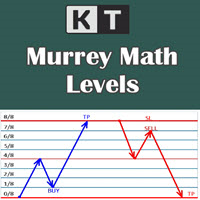
It shows the Murrey Math levels on chart and also provides an alert when price touch a particular level. T. Henning Murrey, in 1995, presented a trading system called Murrey Math Trading System, which is based on the observations made by W.D Gann.
Applications
For Murrey Math lovers, this is a must-have indicator in their arsenal. There is no need to be present on the screen all the time. Whenever the price touches a level, it will send an alert. Spot upcoming reversals in advance by speculatin
KT Candle Timer shows the remaining time in the closing of the current bar. You can use the bar closing time for multiple purposes, including time and trade management during the trading hours.
Features
It also shows the Symbol spreads along with the remaining time. It offers two convenient timer display positions, i.e., chart corner or next to the current bar. From colors to text size, it offers full customization according to user preferences. It is optimized to work without using extensive c

KT Bullish Bearish shows the bullish/bearish regime of the market in the form of a colored histogram representing both of the market states alternately. Bull Market (Blue Histogram): A bull market indicates an uptrend when an instrument price rises over a continued period like days, months, or years. Bear Market (Red Histogram): A bear market indicates a downtrend when an instrument price rises over a continued period like days, months, or years.
Applications
It prevents trading against the big

KT SuperTrend is a modified version of the classic SuperTrend indicator with new useful features. Whether its Equities, Futures, and Forex, the beginners' traders widely use the Supertrend indicator. Buy Signal: When price close above the supertrend line.
Sell Signal: When price close below the supertrend line.
Features
A multi-featured SuperTrend coded from scratch. Equipped with a multi-timeframe scanner. The last signal direction and entry price showed on the chart. All kinds of MetaTrader
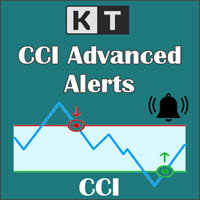
KT CCI Alerts is a personal implementation of the Commodity Channel Index (CCI) oscillator that provide signals and alerts on four custom events: When CCI enter in an overbought zone. When CCI exit from an overbought zone. When CCI enter in an oversold zone. When CCI exit from an oversold zone.
Features A perfect choice for traders who speculate the CCI movements within an overbought/oversold zone. Lightly coded without using extensive memory and resources. It implements all Metatrader alerts.

The Vortex Indicator was first presented by Douglas Siepman and Etienne Botes in January 2010 edition of Technical Analysis of Stocks & Commodities. Despite its based on a complex implosion phenomenon, the vortex is quite simple to interpret. A bullish signal is generated when +VI line cross above the -VI line and vice versa. The indicator is mostly used as a confirmation for trend trading strategies. The Vortex was inspired by the work of Viktor Schauberger, who studied the flow of water in tur
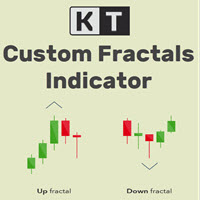
KT Custom Fractals is a personal implementation of the Fractal indicator first introduced by Bill Williams. With KT Custom Fractals you can choose a custom number of bars to allow to the left and right side of the fractal. For example, you can display the fractals that have "three" successive bars with the highest high in the middle and one lower high on both sides , or you can display the fractals that have "Eleven" consecutive bars with the lowest low in the middle and five higher lows on bot

KT Fractal Channel Breakout draws a continuous channel by connecting the successive Up and Down fractals. It provides alerts and also plots the Up and Down arrows representing the bullish and bearish breakout of the fractal channel.
Features
If you use Bill Williams fractals in your technical analysis, you must also include it in your trading arsenal. It can be very effective and useful for stop-loss trailing. A new market trend often emerges after a fractal channel breakout in a new direction.
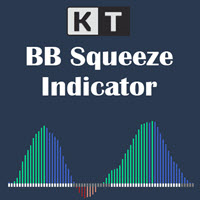
KT BB Squeeze measures the contraction and expansion of market volatility with a momentum oscillator, which can be used to decide a trading direction. It measures the squeeze in volatility by deducing the relationship between the Bollinger Bands and Keltner channels. Buy Trade: A white dot after the series of gray dots + Rising momentum above the zero line.
Sell Trade: A white dot after the series of gray dots + Rising momentum below the zero line. Markets tend to move from a period of low vola

Day Trader Master 는 데이 트레이더를 위한 완벽한 거래 시스템입니다. 시스템은 두 개의 지표로 구성됩니다. 하나의 지표는 매수 및 매도를 위한 화살표 신호입니다. 얻을 수 있는 화살표 표시기입니다. 2차 지표를 무료로 드립니다. 두 번째 지표는 이러한 화살표와 함께 사용하도록 특별히 설계된 추세 지표입니다. 표시기는 반복하지 않고 늦지 않습니다! 이 시스템을 사용하는 것은 매우 간단합니다. 2색 선으로 표시되는 현재 추세 방향의 화살표 신호를 따라가기만 하면 됩니다. 파란색은 구매 추세입니다. 빨간색은 판매 추세입니다. 파란색 화살표는 매수 신호입니다. 빨간색 화살표는 매도 신호입니다. 추세선의 색상과 일치하려면 화살표의 색상과 신호의 방향이 필요합니다. 화살표 표시기는 주로 시간 간격 M5 및 M15에서 일중 거래를 위해 만들어졌습니다. 그러나 기술적으로 시스템은 다른 시간 간격으로 사용할 수 있습니다. 표시기에는 PUSH 메시지 기능이 있는 팝업 경고가 장착되어 있

Market Trend Catcher indicator analyzes the duration of trend movements and, with a certain development of the current trend, offers market entry points in the form of arrows with recommended profit targets. The indicator is very easy to use and does not require a lot of information to understand how it works. It has a minimum of settings and is transparent in understanding the principle of its operation, fully displaying the information on the basis of which it makes decisions on recommending e

KT Volume Profile은 Y축에 히스토그램 형태로 거래량 누적 데이터를 시각화하여, 특정 시간대 및 가격 수준에서의 거래 활동을 확인할 수 있게 해주는 도구입니다. 이 기능은 트레이더가 거래가 집중된 가격 구간을 식별하는 데 매우 유용합니다.
볼륨 프로파일에서의 POC (Point of Control)
POC는 전체 프로파일 중 가장 많은 거래량이 발생한 가격 수준을 나타냅니다. 일반적으로 주요 지지 또는 저항 영역으로 활용되며, 시장이 본격적인 방향 전환 전에 되돌림을 보이는 핵심 레벨로 작용할 수 있습니다.
주요 기능 사용법이 매우 간단합니다. 사각형을 차트에서 드래그 앤 드롭하면 실시간으로 볼륨 프로파일이 업데이트됩니다. 가격이 POC를 돌파할 경우 알림을 설정할 수 있습니다. 처음부터 경량화된 코드로 설계되어 CPU 및 메모리 자원 사용이 최소화됩니다.
입력 설정 볼륨 소스: 틱 볼륨 / 실제 거래량 프로파일 색상: 히스토그램 막대의 색상 박스 너비:
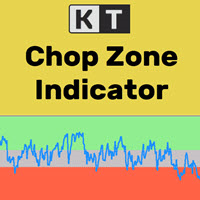
금융 시장은 약 30%의 시간 동안에만 뚜렷한 추세를 형성하고, 나머지 70%의 시간 동안은 횡보 구간에서 움직이는 것이 잘 알려진 사실입니다. 그러나 대부분의 초보 트레이더는 시장이 현재 추세 중인지, 아니면 박스권(횡보) 상태인지 판단하기 어렵습니다. KT Chop Zone은 이러한 문제를 해결해줍니다. 시장의 상태를 시각적으로 세 가지 구역으로 나누어 표시합니다: 하락 구간, 상승 구간, 그리고 Chop Zone (횡보 구간)입니다.
기능
횡보장에서의 거래를 피함으로써 즉시 거래 품질을 향상시킬 수 있습니다. 출구 신호로도 사용할 수 있습니다. 예를 들어, 매수 포지션이 Chop Zone에 진입하면 포지션을 정리할 수 있습니다. 전문가용 자동매매(EA)와 완벽하게 호환됩니다. EA에 쉽게 추가하여 전략을 개선할 수 있습니다. 모든 MetaTrader 알림 기능이 포함되어 있습니다.
입력 파라미터 메인 기간: 오실레이터에 사용하는 정수 값입니다. 권장 값은 10에서 30 사

Transition Angle is an arrow indicator for identifying potential entry points. I like it, first of all, because it has a simple mechanism of work, adaptation to all time periods and trading tactics. Suitable for trading on low timeframes because it ignores sudden price spikes or corrections in price action by reducing market noise around the average price. Works on all currency pairs and on all timeframes. Ready trading system. Take Profit is bigger than Stop Loss! Works on all currency pairs an

The Request indicator shows periods of steady market movement. The indicator shows favorable moments for entering the market. The intelligent algorithm of the indicator determines the trend, filters out market noise and generates trend movement signals. You can use the indicator as the main one to determine the trend. The indicator can work both for entry points and as a filter. Uses two options for settings. The indicator uses color signaling: red - when changing from descending to ascending, a

Forex indicator Storm Genezzis is a real trading strategy with which you can achieve the desired results. As soon as the Storm Genezzis indicator is installed, the main indicators at the price of the traded pair will immediately begin to be recalculated, based on the postulates of technical analysis. In addition, when potential entry points are detected, visual indicators in the form of arrows are shown in the terminal, which is convenient because it allows you to be aware of when it is profita

If you do not yet have your own trading strategy, you can use our ready-made trading strategy in the form of this indicator. The Bullfighting indicator tracks the market trend, ignoring sharp market fluctuations and noise around the average price, filters out market noise and generates entry and exit levels. The indicator shows potential market reversal points. Works on all currency pairs and on all timeframes. Simple, visual and efficient trend detection. It will help in finding entry points in

The main use of the Predominant indicator is to generate buy and sell signals. The indicator tracks the market trend, ignoring sharp market fluctuations and noises around the average price. I like it, first of all, because it has a simple mechanism of work, adaptation to all time periods and trading tactics. Created on the basis of a regression channel with filters. We display the signals of the Predominant indicator on the chart of the price function using a mathematical approach.
You can tra
The indicator is designed for fast scalping. The principle of operation of the indicator is based on the direction of the Moving Average.
The period and sensitivity of the Moving Average can be adjusted for yourself in the indicator settings. I recommend watching my advisor - Night Zen EA
Subscribe to my telegram channel, link in my profile contacts. Advantages of the indicator: The free version is full, there are no additional purchases The arrows are not redrawn, the signal comes after co
FREE

The Analytical cover trend indicator is a revolutionary trend trading and filtering solution with all the important features of a trend tool built into one tool! The Analytical cover indicator is good for any trader, suitable for any trader for both forex and binary options. You don’t need to configure anything, everything is perfected by time and experience, it works great during a flat and in a trend.
The Analytical cover trend indicator is a tool for technical analysis of financial markets

Smart Moving Averages Indicator Smart Moving Averages is an exclusive indicator for Metatrader platform.
Instead of calculating moving averages for the selected chart time frame, the Smart Moving Averages indicator gives you the opportunity to calculate moving averages independently from the chart time frame.
For instance you can display a 200 days moving average in a H1 chart.
Inputs of the indicator are:
Timeframe : timeframe to be used for the calculation of the moving average Period : m
Buy Sell Signal Low TF gives buy/sell signals and alerts with up and down arrow at potential reversal of a pullback or a trend continuation pattern in low timeframe. This is an indicator which gives signals based on trend => It works best in trend market with the principle is to ride on the trend not trade against the trend.
The components of Buy Sell Signal Low TF: - The trend is determined by SMMA 13 , SMMA 21 and SMMA 35 ( can be changed manually to suit your preference). - The signal is b
FREE

OBOS indicator OBOS Indicator is an exclusive indicator to spot entries based on price action.
The OBOS Indicator is both effective and user friendly.
Indicator uses simple color codes and levels to indicate Overbought and Oversold conditions. No more headache.
The OBOS Indicator will only gives you indication when there are possible entries. Means you only get useful information.
Inputs of the indicator are:
MaxBars : number of bars to display in your chart Smoothing period : number of ba

It is a new indicator that frames the price movement and tracks it. It consists of oscillation channel and its center line CL . For its calculation it is only necessary to introduce the amplitude of the channel. Because of this, it is a non-lagging indicator as it is not calculated based on a number of previous candlesticks. It removes any level of noise , showing the underlying price movement cleanly via the center line . It allows you to easily identify the beginnings and ends of the trend ,

The Quality trend indicator expresses the ratio of the strength of a trend or the speed of its growth (fall) to the degree of its noisiness or a certain norm of amplitudes of chaotic fluctuations of a growing (falling) price. The position of the indicator line above zero shows an increasing trend, below zero - a falling trend, the fluctuation of the indicator line near zero shows a flat. If the indicator line begins to fluctuate rapidly around zero and approach it, then this indica

Trend Direction Up Down indicator Trend Direction Up Down is part of a series of indicators used to characterize market conditions.
Almost any strategy only works under certain market conditions.
Therefore it is important to be able to characterize market conditions at any time: trend direction, trend strength, volatility.
Trend Direction Up Down is an indicator to be used to characterize trend direction (medium term trend):
trending up trending down ranging Trend Direction Up Down is based

Market Momentum Alerter Market Momentum Alerter will inform you about danger to operate in the market.
Imagine you see a very nice setup (Forex, Stocks, Indices) and you decide to place your trade...
And you finally lose your trade and don't understand what happened.
This can happen due to big operations in the market carried out by banks and big institutions.
These operations are invisible for most people.
Now with the Market Momentum Alerter you will be able to detect those operations...

Matrix Indicator Matrix Indicator is a simple but effective indicator.
Matrix indicator displays usual oscillators indicators in a user friendly color coded indicator.
This makes it easy to identify when all indicators are aligned and spot high probability entries.
Inputs of indicator are:
Indicator: RSI, Stochastic, CCI, Bollinger Bands Param1/Param2/Param3: usual settings for the indicator ValueMin: Oversold level for oscillator ValueMax: Overbought level for oscillator The indicator can

Signals are not redrawn! All signals are formed on the current bar. The Cci Rsi Arrows MTF indicator is based on two indicators CCI and RSI. Represents entry signals in the form of arrows.
All signals in the MTF mode correspond to the signals of the period specified in the MTF. It is maximally simplified in use both for trading exclusively with one indicator, and for using the indicator as part of your trading systems. The peculiarity of the indicator is that the timeframe of the indicator ca
MetaTrader 마켓은 거래 로봇과 기술 지표들의 독특한 스토어입니다.
MQL5.community 사용자 메모를 읽어보셔서 트레이더들에게 제공하는 고유한 서비스(거래 시그널 복사, 프리랜서가 개발한 맞춤형 애플리케이션, 결제 시스템 및 MQL5 클라우드 네트워크를 통한 자동 결제)에 대해 자세히 알아보십시오.
트레이딩 기회를 놓치고 있어요:
- 무료 트레이딩 앱
- 복사용 8,000 이상의 시그널
- 금융 시장 개척을 위한 경제 뉴스
등록
로그인
계정이 없으시면, 가입하십시오
MQL5.com 웹사이트에 로그인을 하기 위해 쿠키를 허용하십시오.
브라우저에서 필요한 설정을 활성화하시지 않으면, 로그인할 수 없습니다.