 MetaTrader 5
 Experts
 지표
지표
 스크립트
스크립트
 라이브러리
라이브러리
 보관함
보관함
당사 팬 페이지에 가입하십시오

OHLC Reality Check - at what stop distance does your backtest start lying? - MetaTrader 5용 스크립트

I trade on live accounts myself, so I build EAs the way I'd want to run them.
What I build:
• Expert Advisors and indicators for MetaTrader 4 and 5 (MQL4 / MQL5)
- 조회수:
- 26
- 평가:
- 게시됨:
-
 이 코드를 기반으로 한 로봇이나 지표가 필요하신가요? 프리랜스로 주문하세요
프리랜스로 이동
이 코드를 기반으로 한 로봇이나 지표가 필요하신가요? 프리랜스로 주문하세요
프리랜스로 이동


1분 OHLC 데이터를 기반으로 한 모든 백테스트는 한 가지 암묵적인 가정을 전제로 합니다. 바로 캔들봉 내에서 강세봉의 경우 시가-저가-고가-종가 순서로, 약세봉의 경우 시가-고가-저가-종가 순서로 가격이 움직였다는 가정입니다. OHLC 데이터는 가격의 이동 경로를 기록하지 않기 때문에 무언가를 가정해야만 합니다. 실제 티크 데이터는 가격의 이동 경로를 기록합니다.
이 가정은 거래를 마감하는 바가 스톱과 타겟을 모두 터치할 때만 중요합니다. 이때 주문이 거래의 성패를 결정하므로, 테스터는 추측에 의존할 수밖에 없습니다. 이 스크립트는 그 추측이 틀리는 빈도를 측정합니다.
작동 원리. 매 M1 봉마다 가상 브래킷 거래를 개설합니다(봉 시가보다 한 단계 위, 한 단계 아래, 둘 다 동일한 거리). 가격이 그 중 하나에 도달할 때까지 전진합니다. 마감 봉이 한 단계에만 닿았다면 결정할 사항이 없습니다. 두 레벨 모두에 닿은 경우, 스크립트는 테스터의 가정과 해당 분의 실제 티크 움직임을 비교합니다.
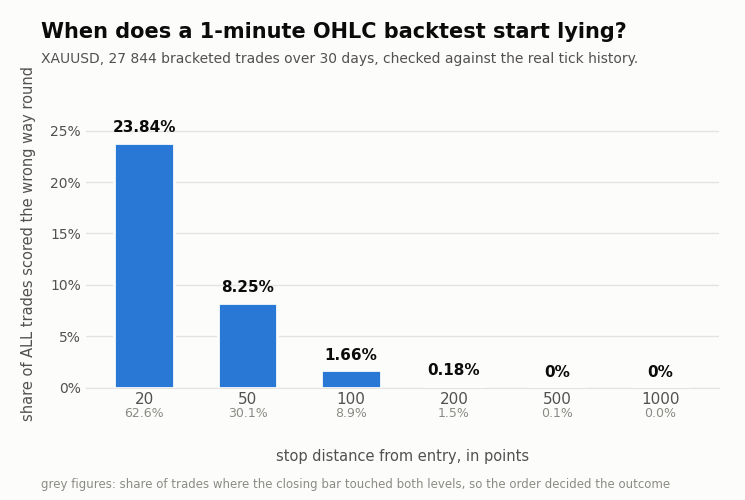
결과는 브래킷의 폭에 전적으로 좌우되므로, 스크립트는 여러 거리를 순차적으로 테스트하여 곡선을 출력합니다. XAUUSD에서 30일 동안 27,844건의 가상 거래를 수행한 결과:
- 20포인트 스톱 - 거래의 62.6%가 경쟁 상태, 23.84%가 예상과 다른 방향으로 종료
- 50포인트 스톱 - 30.1%가 논란의 여지가 있었으며, 8.25%가 잘못된 결과
- 100포인트 스톱 - 8.9%에서 가격 변동이 발생, 1.66%에서 예상과 다른 결과
- 200포인트 스톱 - 1.5%에서 스톱이 발동되었으며, 0.18%가 잘못된 결과
- 500포인트 스톱 - 0.1%가 논란의 대상이 되었으며, 0.00%가 잘못된 결과
- 1,000포인트 스톱 - 이의를 제기한 거래 없음, 잘못된 거래 없음
"이견이 있는"이란 거래를 마감한 캔들이 두 수준 모두에 닿아, 주문이 결과를 결정한 경우를 의미합니다. "잘못된"이란 테스터가 가정한 주문이 틱의 움직임과 정반대였던 모든 해결된 거래 중 차지하는 비율을 말하며, 즉 승리가 손실로 기록되거나 그 반대의 경우를 의미합니다.
따라서 정직한 결론은 “OHLC는 항상 거짓이다”나 “OHLC는 괜찮다”가 아닙니다. 거짓에는 임계값이 있으며, 이 임계값은 종목마다 다르며, 이에 대해 논쟁하기보다는 11초 만에 측정할 수 있습니다.
입력 매개변수. InpSymbol (빈 값 = 차트 심볼), InpDays, InpBrackets (스윕할 스톱 거리, 포인트 단위), InpHorizonBars (미해결로 간주되기 전까지 거래가 열려 있을 수 있는 기간), InpStepBars(N 바마다 매매를 개시하며, 성능이 낮은 시스템에서는 이 값을 높여야 함) 및 InpWriteCSV가 있습니다. InpWriteCSV는 해결되지 않은 모든 매매 내역을 진입 시간, 청산 바, 모델 예측 결과 및 실제 티크 데이터와 함께 나열하므로 개별 사례를 검토할 수 있습니다.
이 기능은 과거 데이터만 읽어들입니다. 주문을 체결하거나 오픈 포지션을 수정하지 않습니다.
해당 종목의 실제 틱 시계열 데이터가 필요합니다. 먼저 ‘종목’ 창에서 데이터를 다운로드해야 하며, 그렇지 않으면 분쟁 중인 거래를 판정할 수 없습니다.
MetaQuotes Ltd에서 영어로 번역함.
원본 코드: https://www.mql5.com/en/code/77063
 CGoldSymbol - find the broker's gold and size the position correctly on it
브로커가 어떤 명칭으로 부르든 상관없이 ‘골드’ 심볼을 감지하고, 계약 사양을 임의로 가정하지 않고 터미널에서 직접 읽어오며, 계좌 통화로 표시된 위험 금액을 해당 브로커에 맞는 정확한 랏 크기로 변환합니다.
Trade Excursion Report: MFE and MAE of every closed trade, to CSV
청산된 거래 건당 한 줄의 CSV 파일을 내보내며, 여기에는 거래 내역서에는 포함되지 않는 수치들이 포함됩니다: 해당 거래에서 나타난 최대 미실현 이익(MFE), 견뎌낸 최대 미실현 손실(MAE), MFE 중 실제로 실현된 금액, 거래가 진행된 바(bar) 수, 그리고 보유 기간입니다. ‘Trade Excursion’ 지표와 동일한 측정 기준이지만, 차트에 표시하는 대신 파일로 출력됩니다. 이 데이터에 대해 물어볼 가치가 있는 질문들은 차트만으로는 답할 수 없기 때문입니다. 예를 들어, 포착 비율은 진입 시각에 따라 달라지는가? 조기 청산한 거래가 가장 오래 보유한 거래인가? 월요일에 발생한 손실 거래의 MAE는 금요일과 다른가? CSV 파일이 생성되면 피벗 테이블 하나로 이러한 질문에 대한 답을 얻을 수 있습니다. 출력 결과는 헤더 행이 포함된 세미콜론으로 구분된 형식으로, MQL5\Files 폴더에 저장되며 어떤 스프레드시트 프로그램에서도 열 수 있습니다. 측정 한계: 편차는 선택한 시간대의 봉 고점과 저점에서 산출되며, 봉 내부의 가격 변동 경로는 알 수 없습니다. ‘봉’ 열은 각 거래의 해상도를 나타내며, 요약 값은 단일 봉 거래를 평균화하지 않고 별도로 집계합니다.
 Broker Clock Auditor
Reads the server clock from the symbol's own H1 history. The forex and CME week closes at 17:00 New York, so the server time of every weekly close gives the server's UTC offset for that week. Over 60 weeks it flags irregular closes, dates every clock change and tests it against the US and European daylight saving calendars, cross-checks TimeTradeServer minus TimeGMT, and lists the server time of the London, New York, Tokyo and Sydney opens for the coming weeks. Writes every close to CSV. Read only: no trade function, no DLL, no network.
DailyLossGuard — Hard Daily Loss Protection
DailyLossGuard — Hard Daily Loss Protection (Prop-Firm Challenge Essential)