당사 팬 페이지에 가입하십시오
- 조회수:
- 81
- 평가:
- 게시됨:
-
이 코드를 기반으로 한 로봇이나 지표가 필요하신가요? 프리랜스로 주문하세요 프리랜스로 이동
실제 작성자:
ggekko
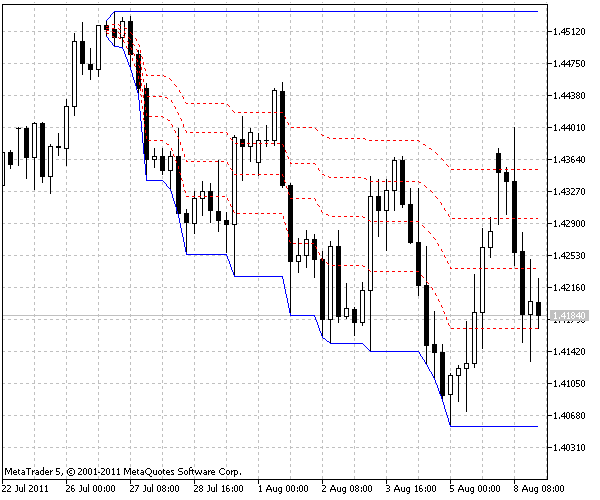
이 인디케이터는 피보나치 되돌림 개체를 그릴 필요 없이 사용자가 정의한 수의 막대에 대해 차트에 피보나치 되돌림 레벨을 표시합니다.
사용자가 되돌림에 사용할 막대 수를 지정하면 인디케이터가 최고 고점과 최저 저점을 추적하고 그에 따라 레벨을 표시합니다.
새로운 고점이 새로운 저점보다 더 최근인 경우 지표는 상승 추세로 간주하고 되돌림 시 가격이 지지를 받을 수 있는 레벨을 표시합니다. 저점이 고점보다 최근에 형성된 것이라면 하락 추세로 간주하고 선은 가격이 되돌아갈 경우 저항에 부딪힐 수 있음을 나타냅니다.
원래 아이디어와 코드는 2011.04.11 mql4.com의 코드 베이스에 게시되었습니다.

MetaQuotes Ltd에서 영어로 번역함.
원본 코드: https://www.mql5.com/en/code/445
 Auto Tp
자동 TP 및 SL 설정: "자동 TP 및 SL 설정"(이익실현 및 손절매) 기능은 모든 트레이딩 전략에서 중요한 도구로, 위험 및 보상 관리를 자동화하도록 설계되었습니다. 이 기능을 사용하면 수익 확보(TP) 또는 손실 제한(SL)을 위해 거래를 자동으로 청산해야 하는 고정 가격 수준을 정의할 수 있으므로 지속적인 수동 모니터링이 필요 없습니다. 이 기능을 활성화하면 특정 핍 수, 잔고 비율 또는 기술 수준 등 사용자 지정 매개변수에 따라 각 포지션에 사전 정의된 이익실현 및 손절매 수준이 자동으로 포함됩니다. 이렇게 하면 시간을 절약할 수 있을 뿐만 아니라 갑작스러운 시장 움직임과 감정적인 의사결정으로부터 트레이딩을 보호할 수 있습니다.
 TicksShort
틱을 저장하기 위한 짧은 형식입니다.
