|
8+ 年
経験
|
32
製品
|
147
デモバージョン
|
|
0
ジョブ
|
0
シグナル
|
0
購読者
|
👑 理論物理学者、プログラマー、15年の経験を持つトレーダー。
----------------------------------------------------------------------
💰 生産された製品:
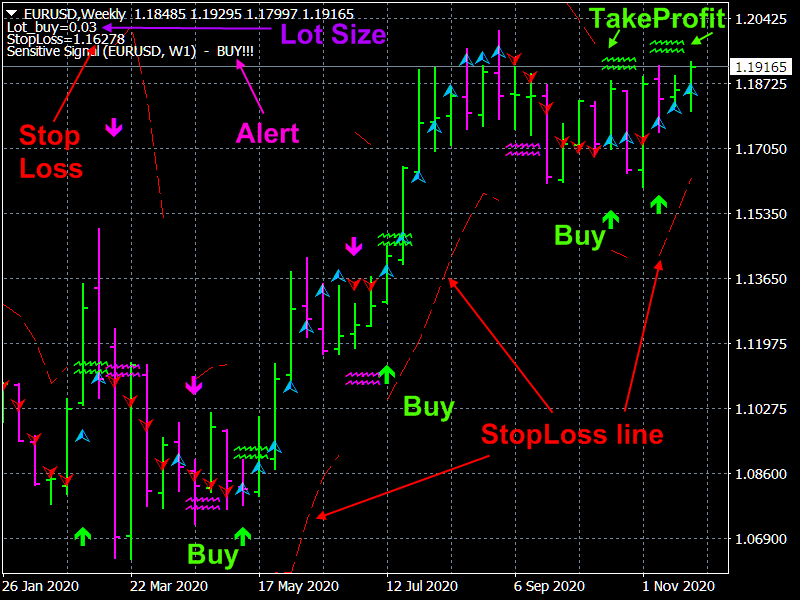
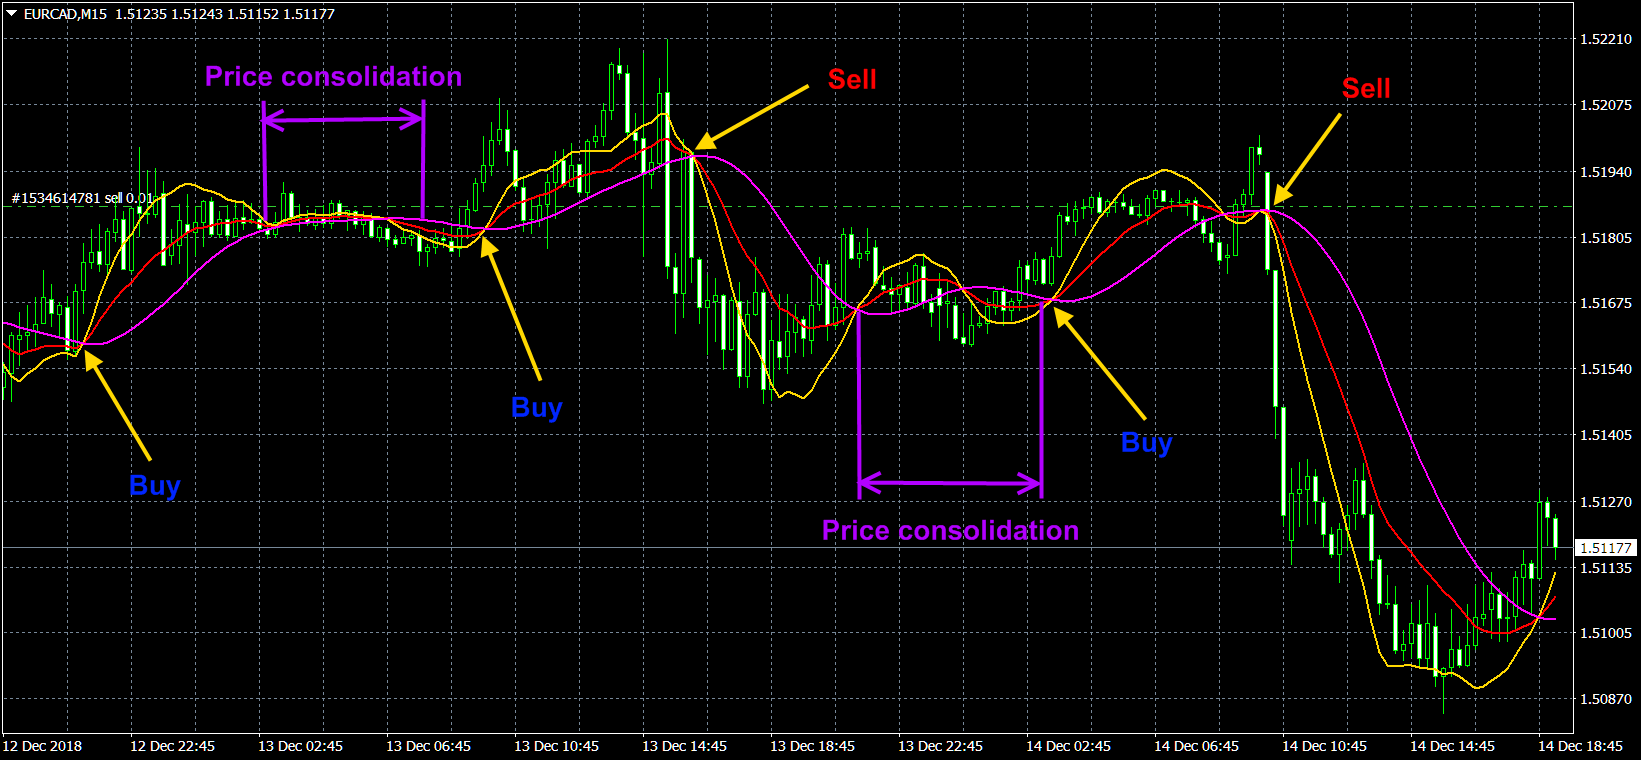
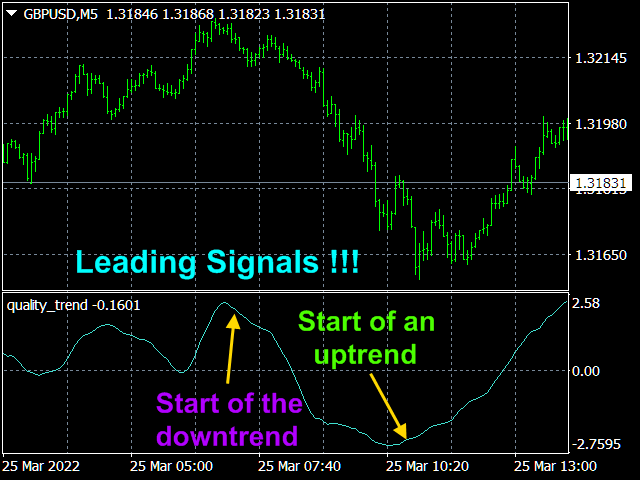
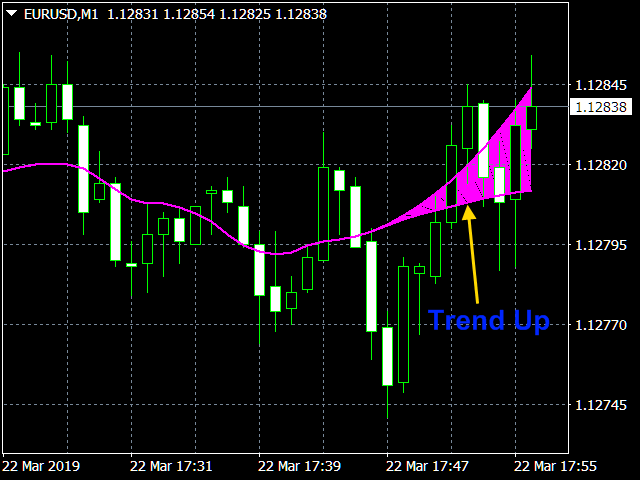
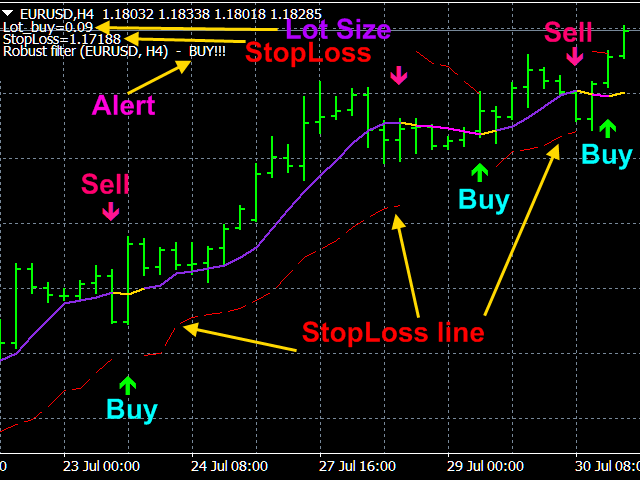
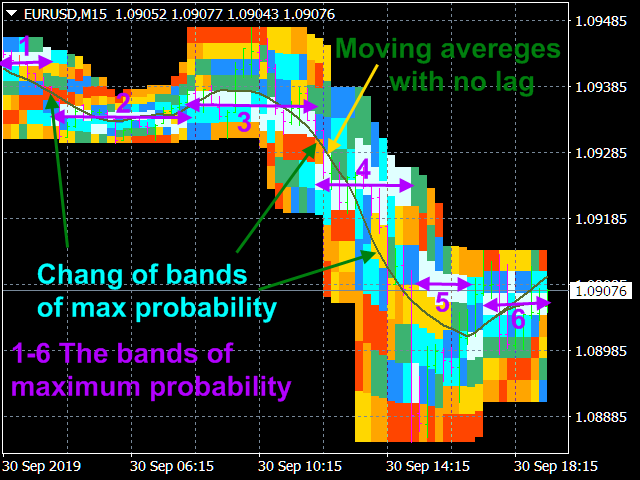
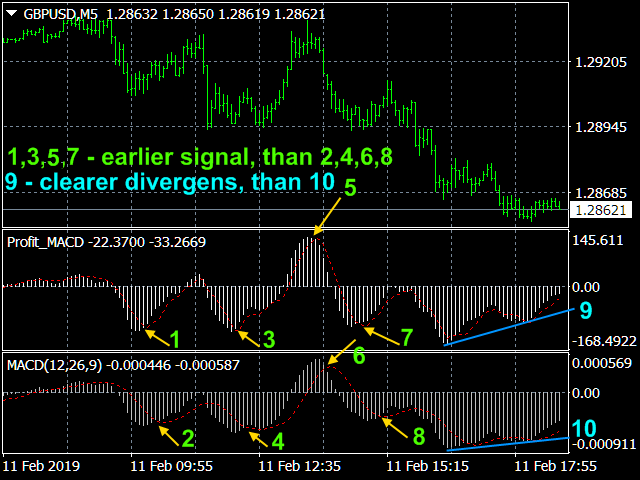
1) 🏆 市場ノイズの最適なフィルタリングを備えたインジケーター(開始位置と終了位置のポイントを選択するため)。
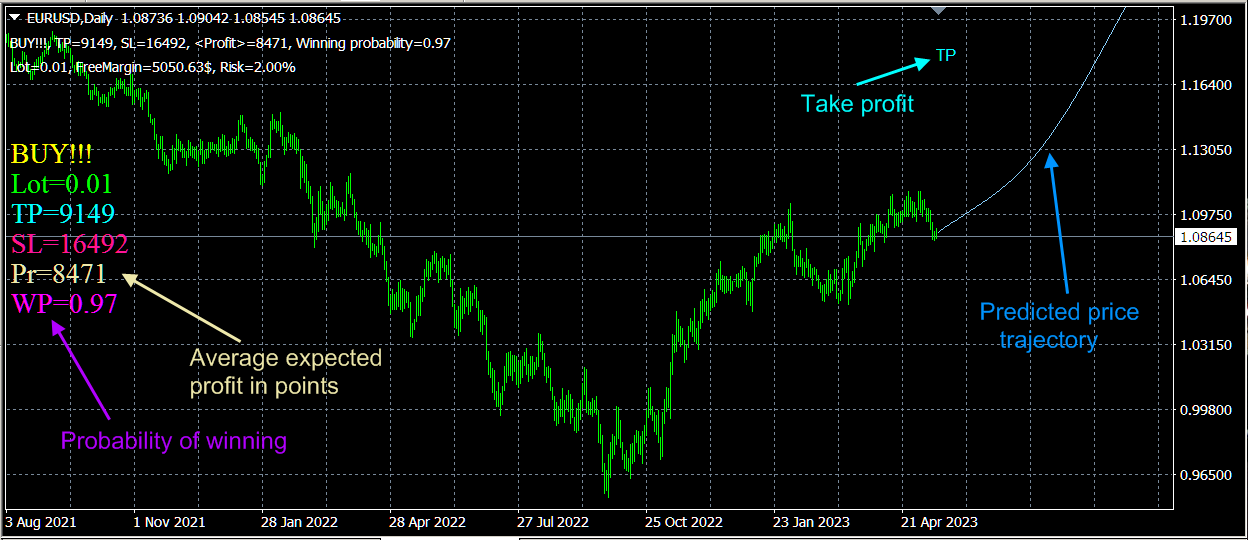
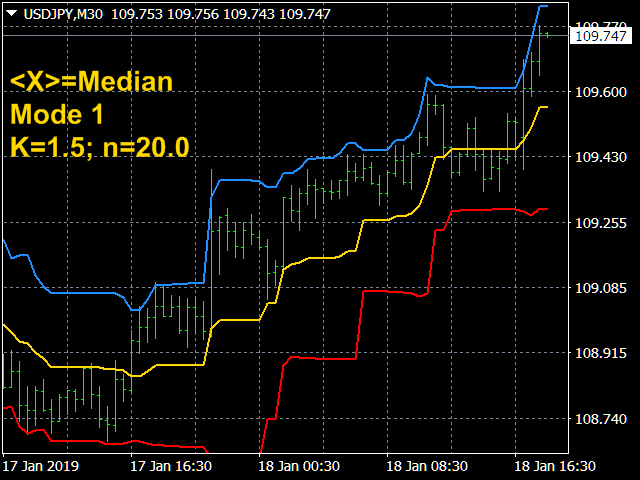
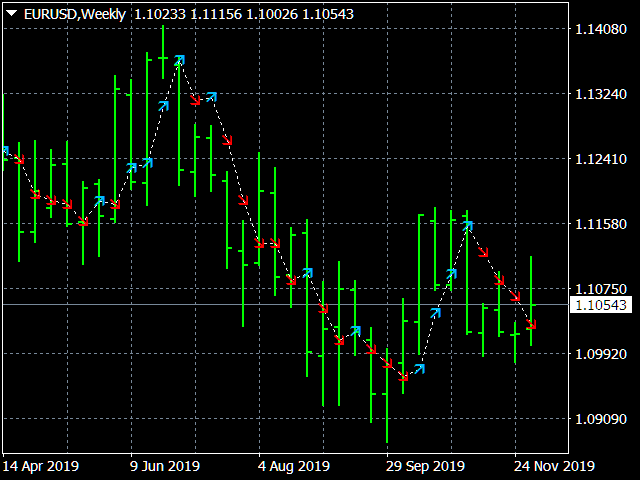
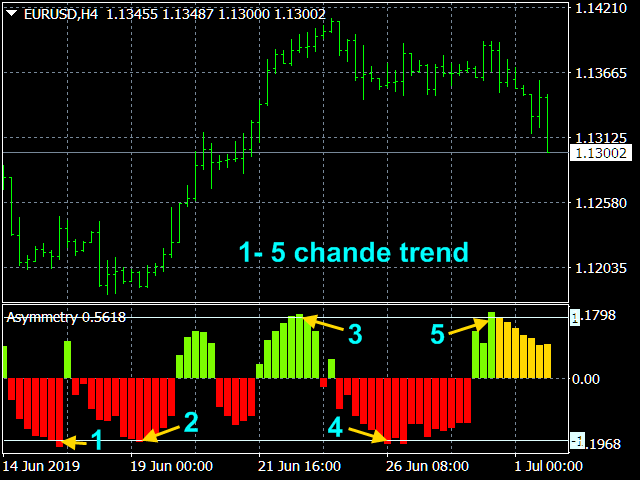
2) 🏆 統計的指標(世界的な傾向を決定するため)。
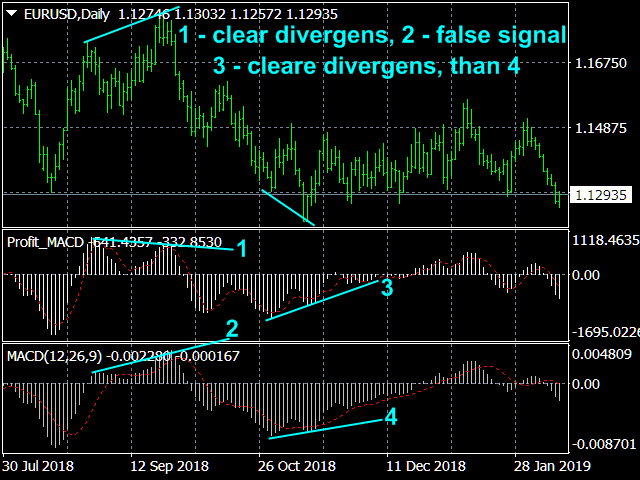
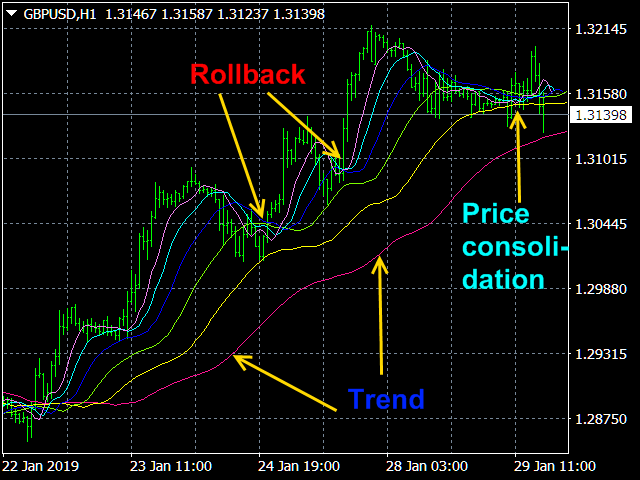
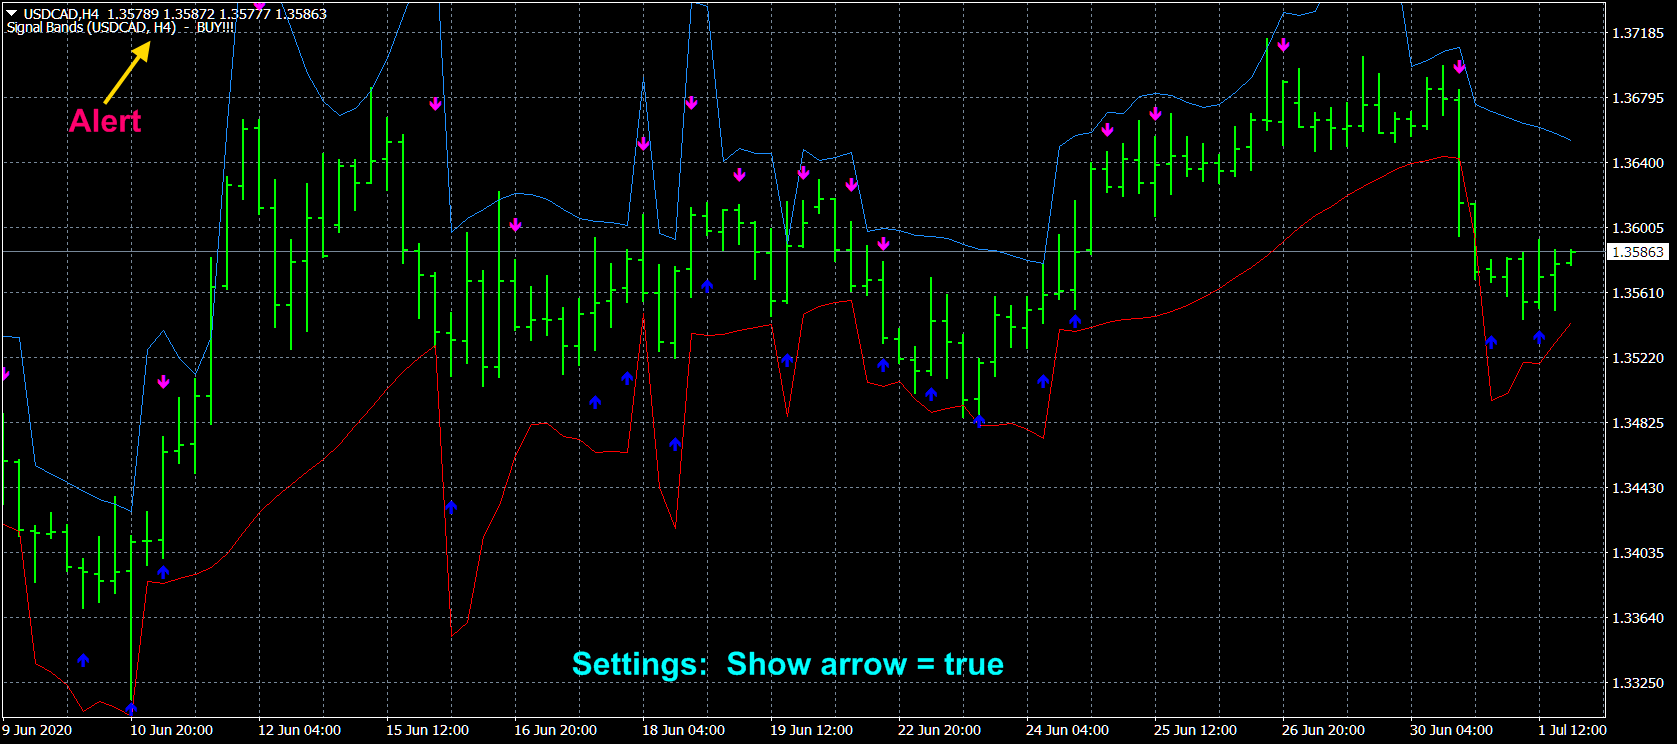
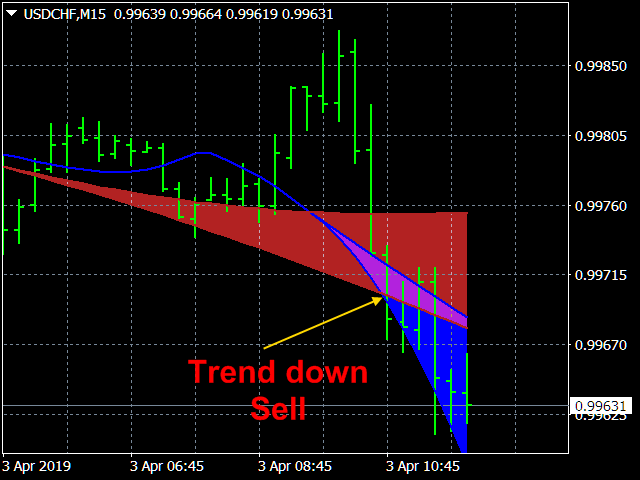
3) 🏆 市場調査指標(価格の微細構造を明確にし、チャネルを構築し、トレンドの逆転と引き戻しの違いを特定するため)。
---------------------------------------------------------------------
☛ ブログの詳細 https://www.mql5.com/en/blogs/post/741637
----------------------------------------------------------------------
💰 生産された製品:
1) 🏆 市場ノイズの最適なフィルタリングを備えたインジケーター(開始位置と終了位置のポイントを選択するため)。
2) 🏆 統計的指標(世界的な傾向を決定するため)。
3) 🏆 市場調査指標(価格の微細構造を明確にし、チャネルを構築し、トレンドの逆転と引き戻しの違いを特定するため)。
---------------------------------------------------------------------
☛ ブログの詳細 https://www.mql5.com/en/blogs/post/741637