バージョン 16.4
2024.09.04
Customize the length of lines such as PDH/PDL/PDO/PDC.
バージョン 16.3
2024.07.24
iFVG extend to current candle.
バージョン 16.2
2024.07.23
Add Invert FVG functionality, including ifvg touched, ifvg filled alerts, etc
バージョン 16.1
2024.06.18
fix a bug in calculation of timezone.
バージョン 16.0
2024.06.17
You can customize the position of the Scale fix button.
バージョン 15.5
2024.06.12
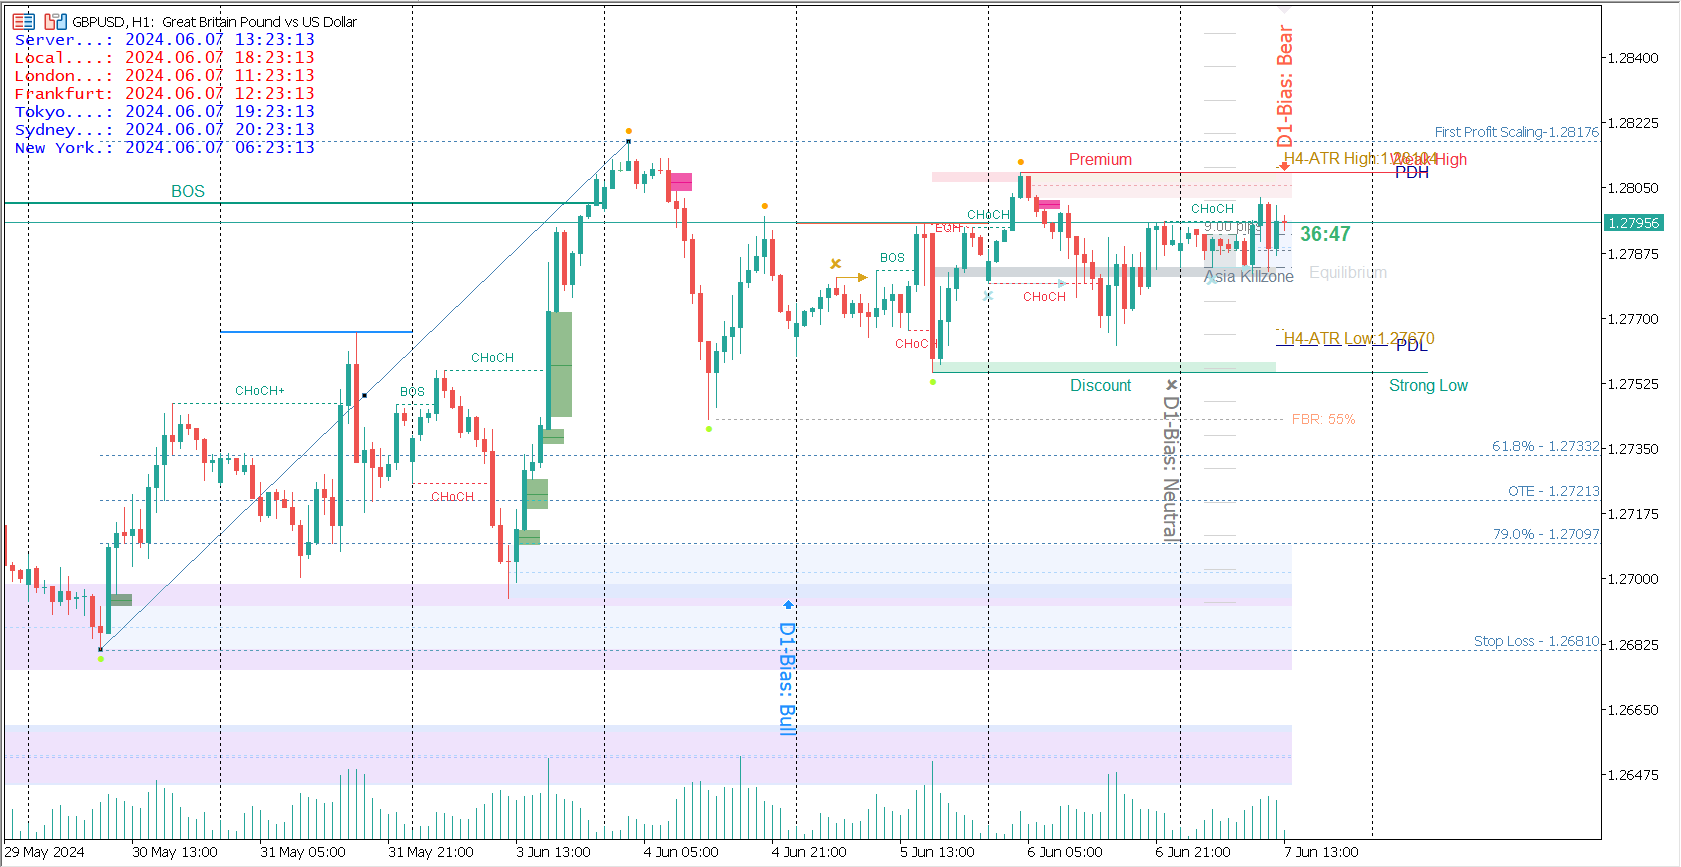
Add ICT ATR X Level display.
バージョン 15.3
2024.06.06
fix a bug in ICT Bias.
バージョン 15.2
2024.06.06
Add new features: ICT Bias.
Add new features: ICT ATR.
バージョン 15.1
2024.06.04
fix bug in previous update.
Add Alerts for Candlestick Patterns.
バージョン 15.0
2024.05.31
fix bug in candles patterns.
バージョン 14.9
2024.05.31
Add Candles Patterns:
Belt Hold Pattern
Engulfing Pattern
Piercing Pattern/Dark Cloud Cover Pattern
Morning Star/Evening Star Pattern
Three Star in the South/Deliberation Pattern
Three White Soldiers/Three Black Crows Pattern
Three Outside Up/Three Outside Down Pattern
Three Inside Up/Three Inside Down Pattern
Three Line Strike Pattern
Inside Bar Pattern
バージョン 14.8
2024.05.07
Add a Magic Number option to SMC to support adding multiple SMC indicators to the same chart. This can enable viewing multiple HTFs info in the same chart. Magic Number Option is located at the bottom of the settings interface.
バージョン 14.7
2024.05.01
Adjust the display position of PDH/PDL PWH/PWL, etc
バージョン 14.6
2024.04.29
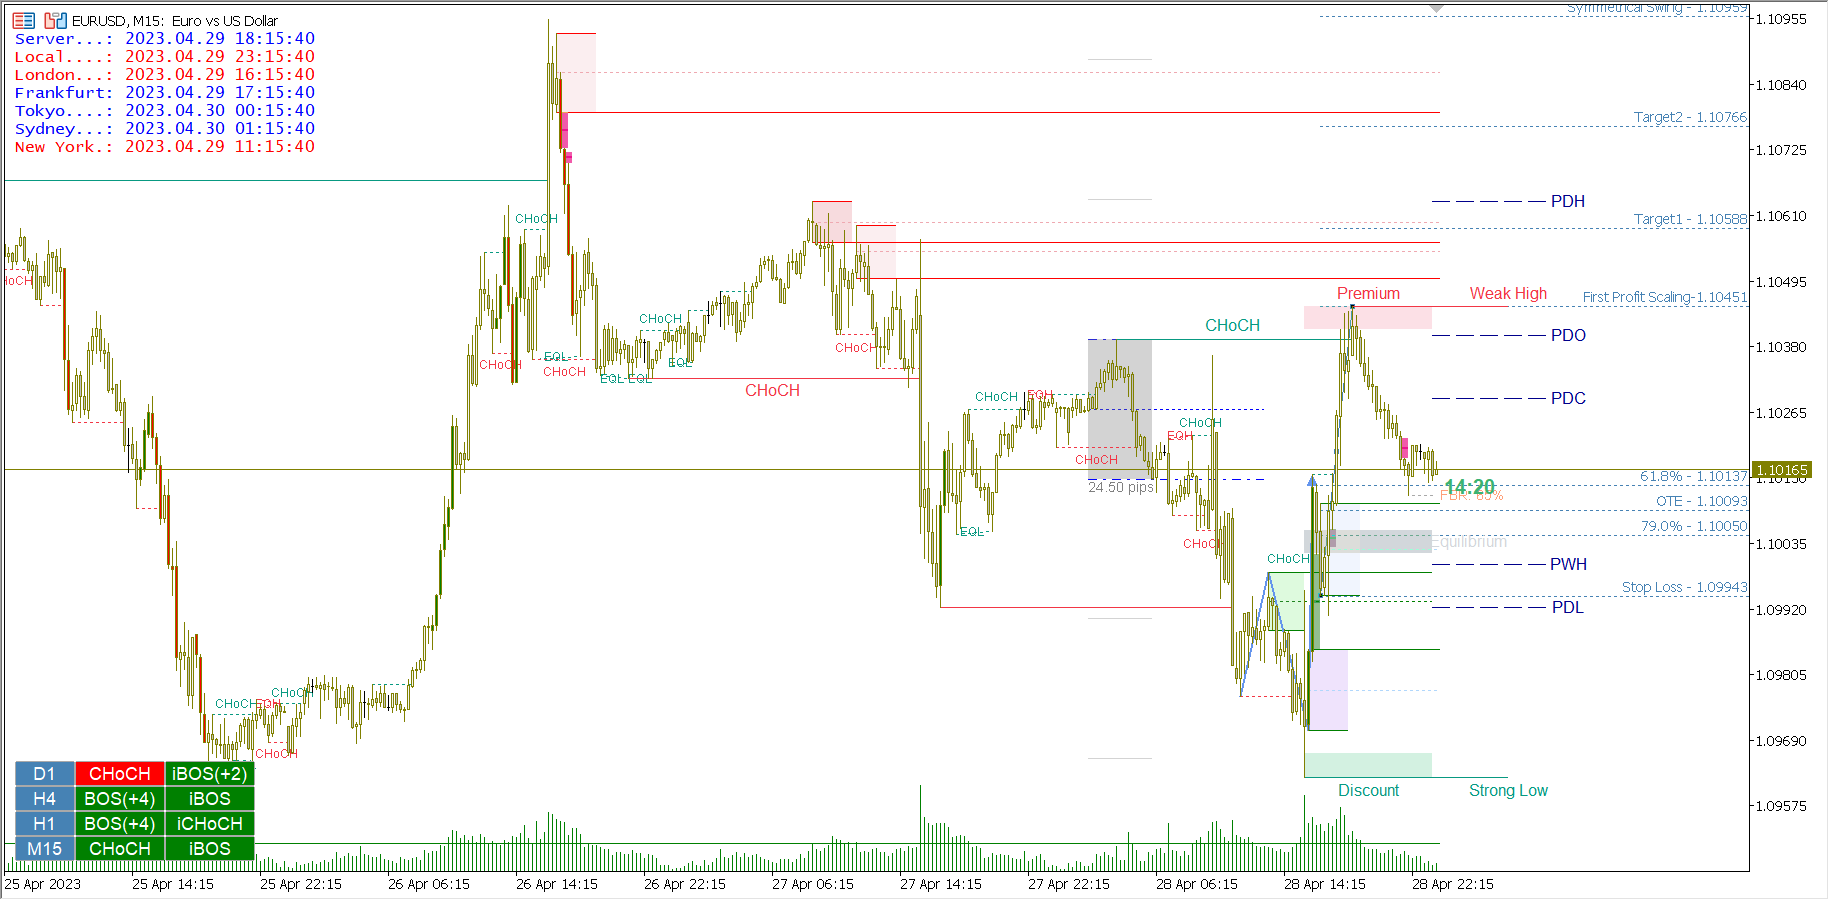
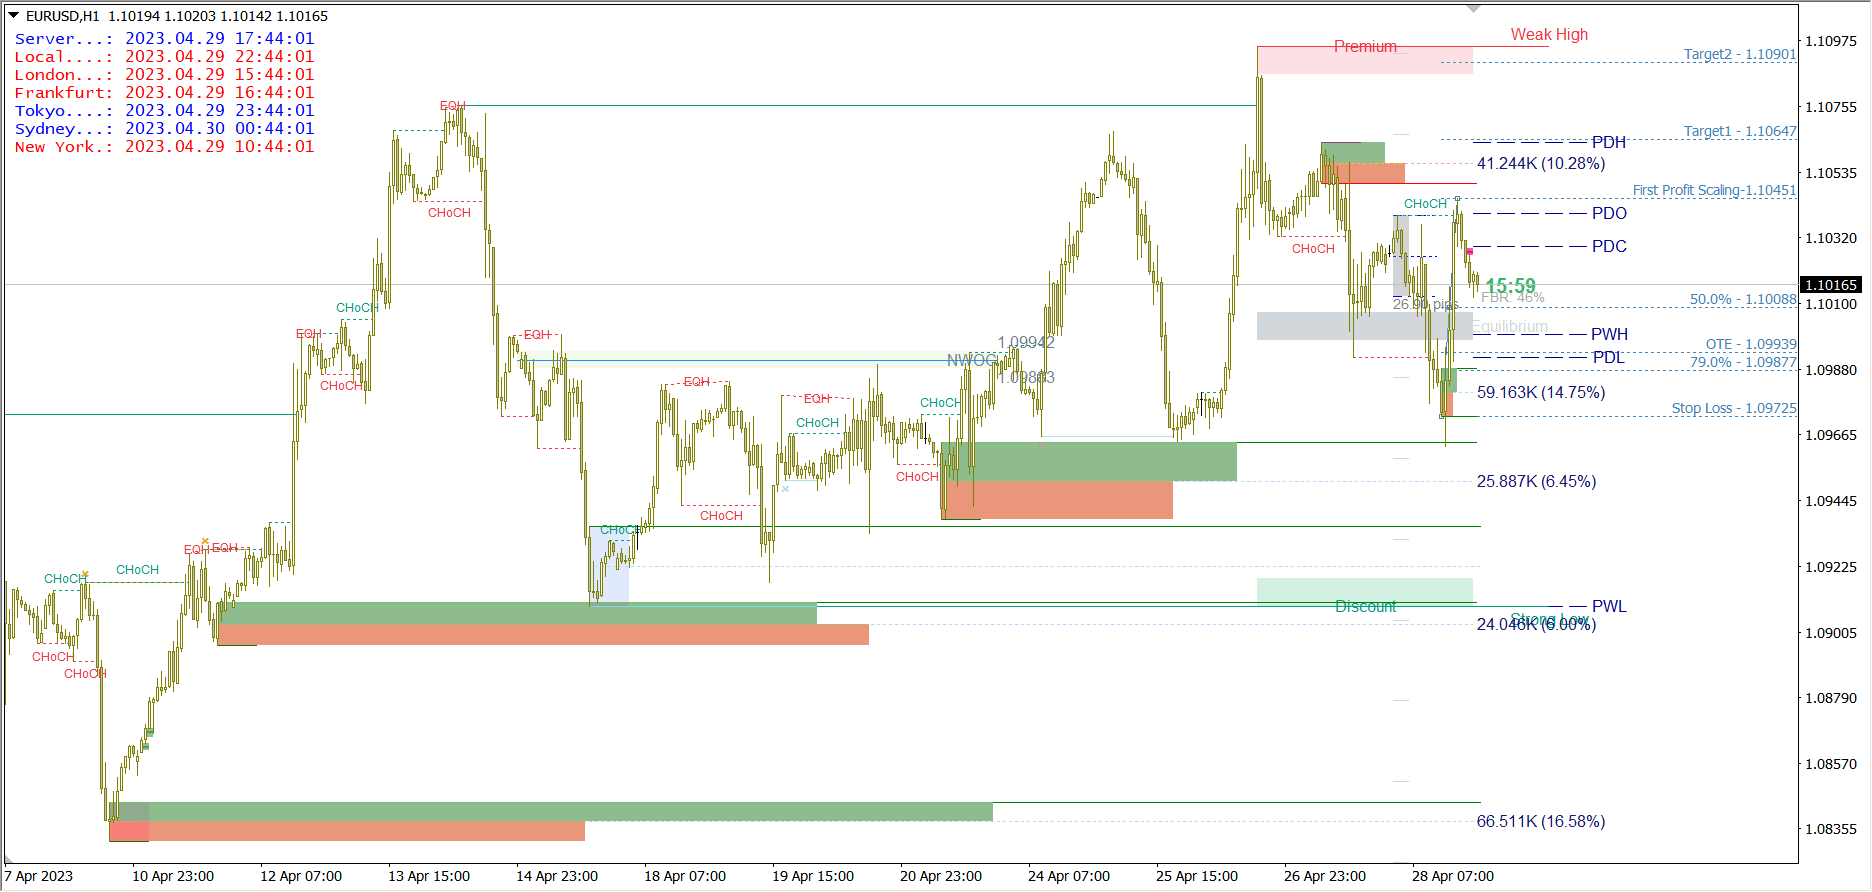
Fixed the width display issue of the premium discount zones.
バージョン 14.5
2024.04.29
Fixed the width display issue of the premium discount zones.
バージョン 14.4
2024.04.23
update strong imbalance algorithm.
バージョン 14.3
2024.04.11
Modify the algorithm for strong imbalance.
バージョン 14.2
2024.04.10
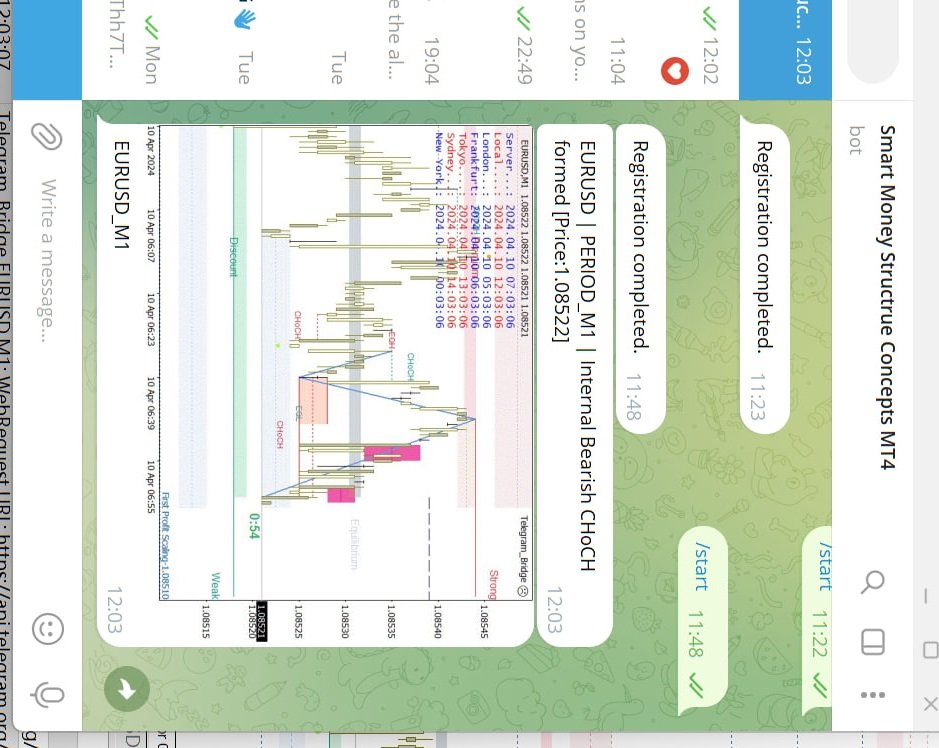
Support send Alerts and Screenshot to Telegram!
バージョン 14.1
2024.04.05
Fix the bug in the last update.
バージョン 14.0
2024.04.04
Add current price to the Alert messages.
バージョン 13.9
2024.01.28
Add detection of BSL/SSL in large cycles.
バージョン 13.8
2024.01.28
Add Asian Range Break Alert.
バージョン 13.7
2024.01.21
Dealing with the issues caused by MT updates.
バージョン 13.6
2023.12.14
Resolve the bug(Repeatedly drawing graphic objects) that occurred in the previous version.
バージョン 13.5
2023.12.13
Improve the running speed of indicators, especially solving the problem of slow running speed in simulators or testers before.
バージョン 13.4
2023.12.11
Fix the width of filled FVG to one candle.
バージョン 13.3
2023.12.04
roll back to last version.
バージョン 13.2
2023.12.02
Optimize the code and improve the running speed of indicators.
バージョン 13.1
2023.11.15
Add the option for OB break type(Candle Wick/Body Break).
Optimized code.
バージョン 13.0
2023.11.09
Make the size of Fractal Points adjustable.
バージョン 12.9
2023.10.18
fix a HTF FVG bug.
バージョン 12.8
2023.10.17
Add NY Midnight open touch alert.
バージョン 12.6
2023.10.11
Add HTF FVG Features.
バージョン 12.5
2023.10.07
Support for custom OTE level value.
Supports two FVG filled types: Body Filled/Wick Filled.
バージョン 12.4
2023.10.03
fix N-lines bug.
バージョン 12.3
2023.09.05
fix bug in new features.
バージョン 12.2
2023.09.05
Add an Alert function: Alert when Engulfing-Pattern occurs in the OB area.
バージョン 12.1
2023.08.29
Add Alert for FVG Consequent Encroachment touched.
バージョン 12.0
2023.07.16
Add the Customer Levels options to FB levels.
バージョン 11.9
2023.07.03
Fix Long Wicks alert bug.
バージョン 11.8
2023.06.23
Solve a bug with Breaker blocks.
バージョン 11.7
2023.06.23
Resolve the issue of duplicate alerts during chart data refresh.
バージョン 11.6
2023.06.22
Fix bug that the supply&demand zones not update to the current candle.
バージョン 11.5
2023.06.19
Change the default settings for OB display.
バージョン 11.4
2023.06.19
Adjust the Supply&Demand display format to maintain consistency with other OB display formats.
バージョン 11.3
2023.06.14
Add the option to modify the style of the FB levels and the color on the EQH/EQL.
バージョン 11.2
2023.06.09
Fix bug in FIBO Levels.
バージョン 11.1
2023.06.07
Improve FVG Consequent Encroachment, add appearance attribute settings.
バージョン 11.0
2023.06.06
Fix bug in MTF Dashboard feature.
バージョン 10.9
2023.06.05
Applying two structure algorithms to HTF Structures.
バージョン 10.8
2023.06.05
Error in previous version.
バージョン 10.7
2023.06.05
Modify some default settings, fix bugs occurred when refreshing the indicator.
バージョン 10.6
2023.06.02
Resolve MTF dashboard function bugs caused by adding new features.
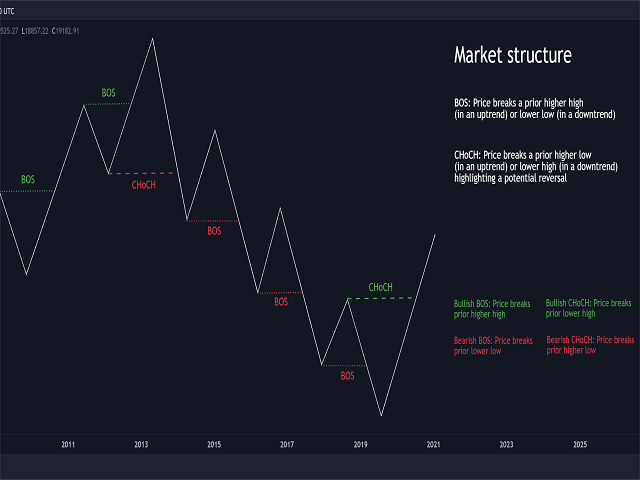
The market structure algorithm 2 can more accurately label the reversal of market structure. If you choose this algorithm, it is recommended to set the maxbars for structure smaller.
バージョン 10.5
2023.06.01
Add an algorithm for market structure, and the second algorithm strictly calculates and annotates according to the definition of market structure breakthroughs and reversals.
バージョン 10.4
2023.05.25
Modify some spelling errors in the settings and add an option to show or hide the strong high/low label.
バージョン 10.3
2023.05.19
Enable real-time updates of KILLZONE's high and low range.
バージョン 10.2
2023.05.18
Update Asia Killzone, London Killzone, New York Killzone, London Close Killzone, default to using standard definitions start and end times, the user can customize the start and end times.
バージョン 10.1
2023.05.17
Add London Killzone, AM New York Killzone, PM New York Killzone. Please set the start and end times for Killzone yourself.
バージョン 10.0
2023.05.16
Maxbars for swing and internal structures of MTF dashboard set to the current setting.
バージョン 9.9
2023.05.15
Implement CHoCH+ feature on the MTF dashboard.
バージョン 9.8
2023.05.10
Add Feature: Delete IMBs When filled.
バージョン 9.7
2023.05.08
Modify ZigZag algorithm.
Error modifying supply/demand zone.
バージョン 9.6
2023.05.05
Add Internal/Swing CHoCH+ formed alerts.
バージョン 9.5
2023.05.05
Add CHoCH+ Feature: When there is a formation of CHOCH, the structural high and low points do not break through the previous high and low points, and such CHOCH is labeled as CHOCH+.
Add more Style Options for PDL/PDH PWH/PWL PMH/PML PDC/PDO.
バージョン 9.4
2023.04.29
Add features of display internal OBs with volume metrics.
バージョン 9.3
2023.04.28
Fix a bug that labeling N-lines delay in the Breaker Blocks Feature.
バージョン 9.2
2023.04.27
Add Option for remove Asia Range Label text.
Add Style Options for PDHL/PDCO Lines.
バージョン 9.1
2023.04.27
Optimize and improve the Breaker blocks algorithm.
バージョン 9.0
2023.04.26
Add Breaker Blocks function and Breaker Blocks formed alert.
バージョン 8.9
2023.04.23
Add Volume Imbalance.
Optimize Asia Range function.
バージョン 8.8
2023.04.22
Modify Asian Range function:
Allow the start/end time of the Asian Range to be self-defined.
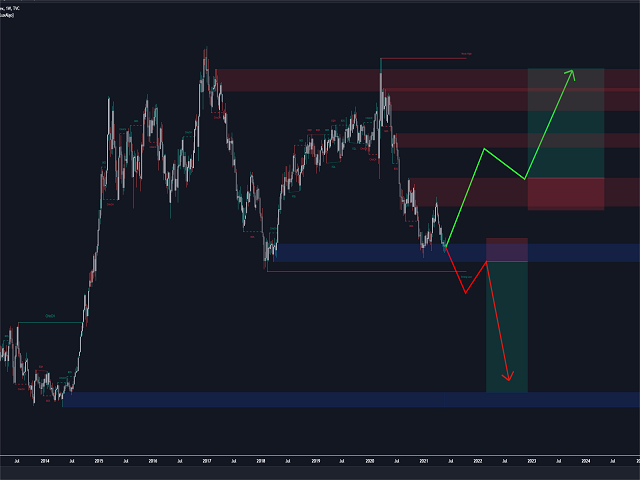
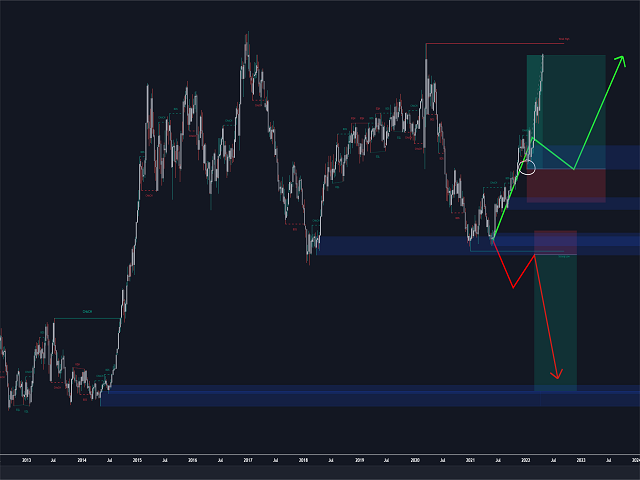
Add Prediction Lines for Price movement target.
バージョン 8.7
2023.04.19
Optimize the code to solve the problem of MTF Dashboard function slowing down the running speed of indicators.
バージョン 8.6
2023.04.19
Add Alerts for Bullish/Bearish OB formed.
Add Alerts for Supply/Demand OB formed.
Optimize some of the code.
バージョン 8.5
2023.04.18
Add Alerts for Price Touch Premium/Discount Zone.
バージョン 8.4
2023.04.18
Add Fibo-Retracement-OTE Alert.
Add Bullish/Bearish Strong Imbalance Alert.
バージョン 8.3
2023.04.17
Optimization structure breakthrough algorithm.
Add Strong Imbalance Detection and Labeling.
バージョン 8.2
2023.04.13
Applied the Structure Break Type settings to the HTF&MTF Dashboard.
バージョン 8.1
2023.04.11
Add 3 types of breakthroughs for internal structure and swing structure, the users can choose the type they want.
バージョン 8.0
2023.04.10
Add Supply&Demand OB Touch/Break Alert.
バージョン 7.9
2023.04.09
Add Supply&Demand Zone/OrderBlocks Detect. This function aims to identify areas of strong market imbalances and mark corresponding supply and demand regions.
バージョン 7.8
2023.04.04
Add OB Display Option: Display OB With Top-Bottom Lines.
バージョン 7.7
2023.04.01
Modify Fibo OTE function when the user double-click the fibo level line, the fibo level is taken out of program control, and only the user can modify and delete it.
バージョン 7.6
2023.03.31
Fix MTF Dashboard bugs(Sorry, this feature has caused a lot of bugs).
バージョン 7.5
2023.03.30
Add function for MTF Dashboard to display the number of consecutive BOS/iBOS occurrences.
バージョン 7.4
2023.03.30
Add option to change the style of the OB mean threshold.
Add FVG threshold for the users to filter out those too small and insignificant.
Rewrite the fractal point algorithm.
Fix some bugs.
バージョン 7.3
2023.03.29
Fix bug when setting True only for the Fibo OTE.
バージョン 7.2
2023.03.29
Fix the problem of FIBO repeatedly drawing lines.
バージョン 7.1
2023.03.28
Add Fibo levels for OTE and Profit target, the user can manually adjust the Fibo high and low points.
バージョン 7.0
2023.03.27
fix MTF Dashboard bug.
バージョン 6.9
2023.03.27
Add MTF Dashboard function.
バージョン 6.8
2023.03.24
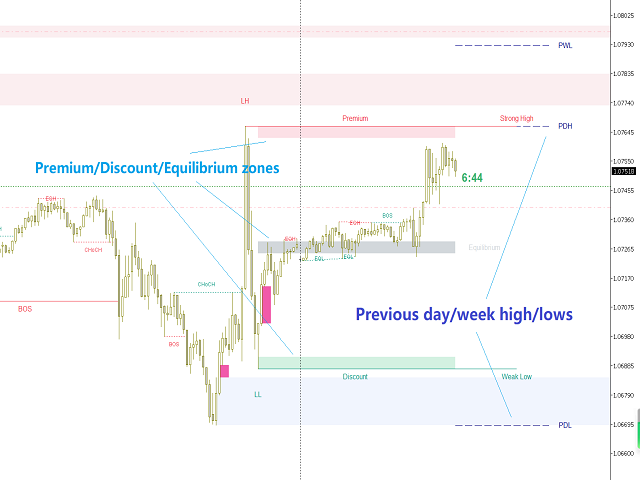
Add HTF Premium&Discount Zone.
Add Option to extend NWOG/NDOG to current candle.
バージョン 6.7
2023.03.23
Add Options for internal structure and swing structures, user can set the label text size and line width.
バージョン 6.6
2023.03.23
Change the style of OB mean threshold.
バージョン 6.5
2023.03.22
Add Option to Time Zone / Asian Range / NWOG / NDOG, The user can set to display only the latest few results to avoid cluttering CHART with all of them displayed.
バージョン 6.4
2023.03.22
Fixed spelling errors in the settings panel.
Improved NWOG/NDOG algorithm.
バージョン 6.3
2023.03.22
Fix Trend Candle color setting bug.
Add HTF Strong/Weak High/Low
バージョン 6.2
2023.03.21
Add NWOG/NDOG function
バージョン 6.1
2023.03.20
Add Fractal Points & ZigZag Line
バージョン 6.0
2023.03.20
Add NY Midnight open line
バージョン 5.9
2023.03.19
Version 5.9
Add options for HTF OB style
Add options for Aisan Range
バージョン 5.8
2023.03.18
Version 5.8
Optimize Time Zone Function.
Add Asia Range function for day trade.
バージョン 5.7
2023.03.13
Version 5.7
Add HTF OB iOB function
バージョン 5.6
2023.03.12
Version 5.6
Add Continue to improve HTF functions.
バージョン 5.5
2023.03.11
Version 5.5
Add High Timeframe Structure ability.
BigBar, HTF iBOS, HTF BOS, HTF iCHoCH, HTF CHoCH
バージョン 5.3
2023.03.07
Version 5.3
Add Previous Day High/Low Price touch detect.
Input parameters verification.
Optimize some codes to make the indicator calculation faster.
バージョン 5.2
2023.03.06
Version 5.2
Update Time Zone algorithm
バージョン 5.1
2023.03.04
Version 5.1
Optimizing Candle Timer, not display the error countdown when there is no market data.
バージョン 5.0
2023.03.03
Version 4.9.1
Fix Candle Timer bug
バージョン 4.9
2023.03.03
Version 4.9
Optimize Time Zone and Candle Timer
バージョン 4.8
2023.03.02
Version 4.8
Add Candle Timer
Add Time Zone
バージョン 4.7
2023.03.01
Version 4.7
Add Liquidity Voids Detect
バージョン 4.6
2023.02.28
Version 4.6
Add Alerts to Email function
バージョン 4.5
2023.02.28
Version 4.5
Add FVG Touch alert
バージョン 4.4
2023.02.27
Version 4.4
Add Display full Fibo Levels Option
バージョン 4.3
2023.02.27
Version 4.3
Add FVG Extend Option: FVG extend to the current candle
バージョン 4.2
2023.02.25
Version 4.2
Add BSL/SSL Taken Alert
バージョン 4.1
2023.02.24
Version 4.1
fix BSL/SSL Taken bug
バージョン 4.0
2023.02.24
Version 4.0
Add BSL/SSL Taken Detect
バージョン 3.9
2023.02.22
Version 3.9
Add Fibonacci Retracement
バージョン 3.8
2023.02.20
Version 3.8
Fix bug of CHoCH BOS label text display options
バージョン 3.7
2023.02.20
Version 3.7
Add CHoCH BOS label text display options
バージョン 3.6
2023.02.20
Version 3.6
Add Alert when LW formed
Add Alert when LW filled
Add LW display options for filled
バージョン 3.5
2023.02.19
Version 3.5
Add Long Wicks detect function
Optimize OB mean threshold display
バージョン 3.4
2023.02.19
Version 3.4
Add OB iOB touch Alert
OB mean threshold and FVG Consequent Encroachment color Options
バージョン 3.3
2023.02.18
Version 3.3
Add OB mean threshold
Add FVG mean threshold
バージョン 3.2
2023.02.18
Version 3.2
Add Previous Day Open/Close
More concise OB display
バージョン 3.1
2023.02.15
Version 3.1
Optimize code
バージョン 3.0
2023.02.13
Version 3.0
Optimize code
Optimize FVG functions and support high timeframe FVG
バージョン 2.8
2023.02.12
FVG filled and FVG formed detect without delay.
Fixed some bugs
バージョン 2.7
2023.02.10
Version 2.7
Set alerts for BOS OB CHOCH etc separately
Support setting to send Alert to mobile devices.
バージョン 2.6
2023.02.09
Version 2.6
バージョン 2.5
2023.02.09
Version 2.5
バージョン 2.4
2023.02.08
Version 2.4
Fix Trend Candles bug
バージョン 2.3
2023.02.08
Version 2.3
Draw Candles by Trend
Previous day/week/monthly high/low
バージョン 2.2
2023.02.08
version 2.2
Modify Premium & Discount Zones
バージョン 2.1
2023.02.07
version 2.1
fix bug
バージョン 2.0
2023.02.07
version 2.0
Modify Fair Value Gap Detection
バージョン 1.3
2023.02.05
version 1.3
fix alert bug
バージョン 1.2
2023.02.03
version 1.2
EQH/EQL bug fix
add Alert function
バージョン 1.1
2023.02.03
version 1.0.1 :
fix bug


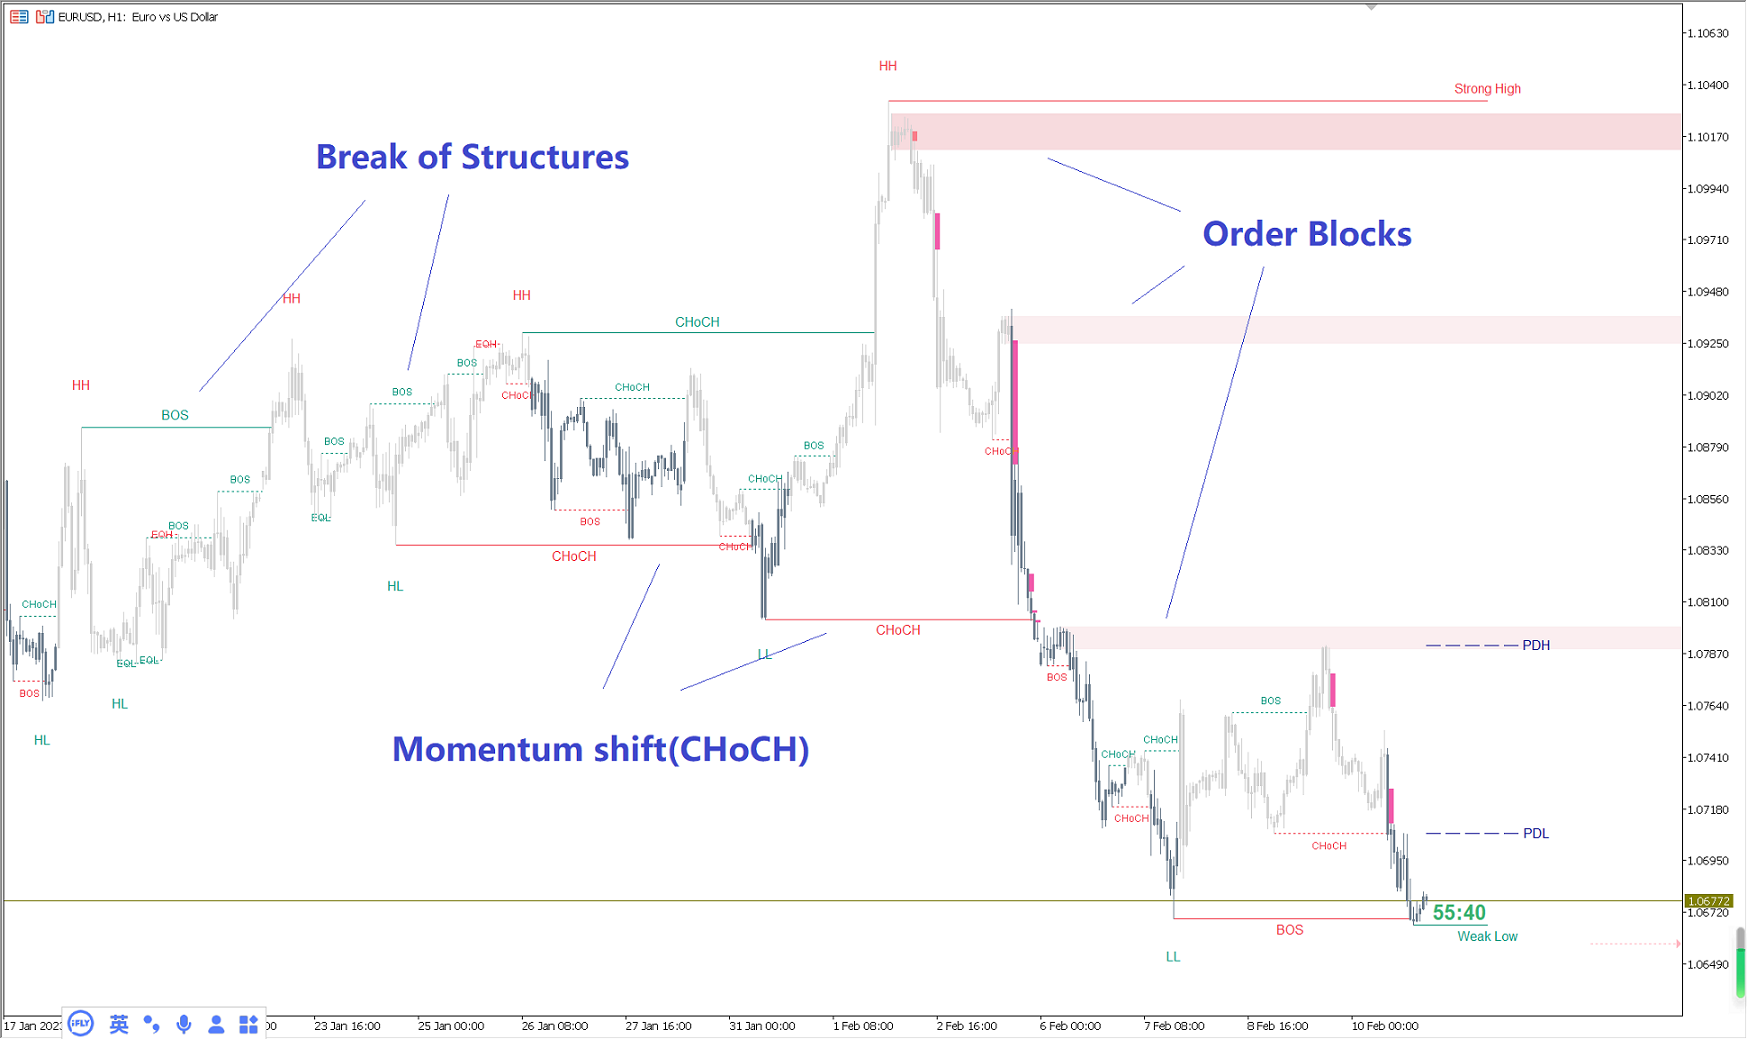
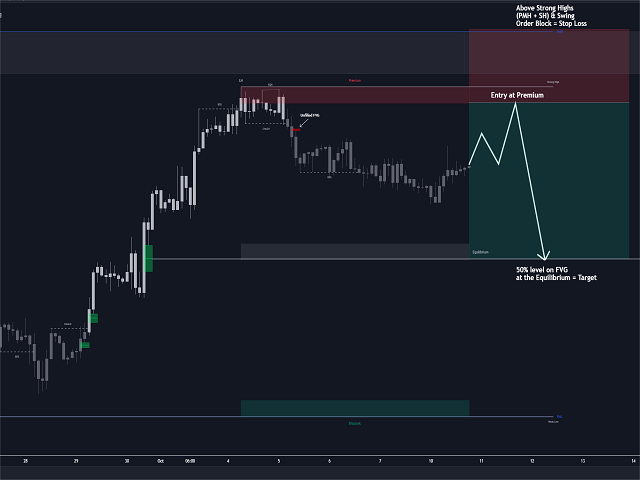


For sure the best indicator you can get, you can make really good use of it if you understand the concepts of SMC, specially the Order Blocks and FVG, and market structure. I have made my money invested many many times over, it really saves and give the change to put the right trades.