Floating Nest

1. What is Floating Nest?

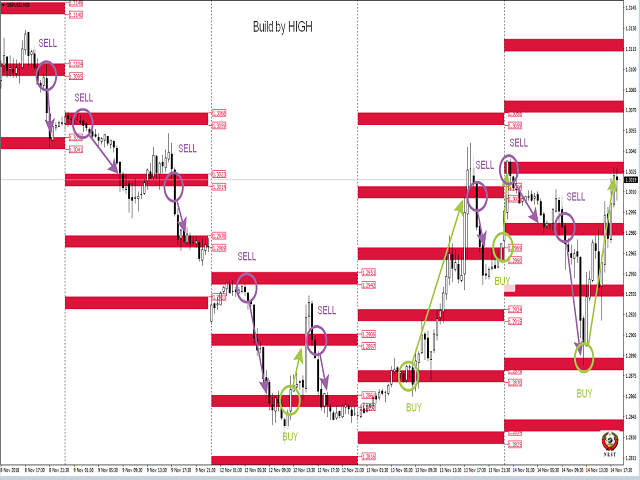
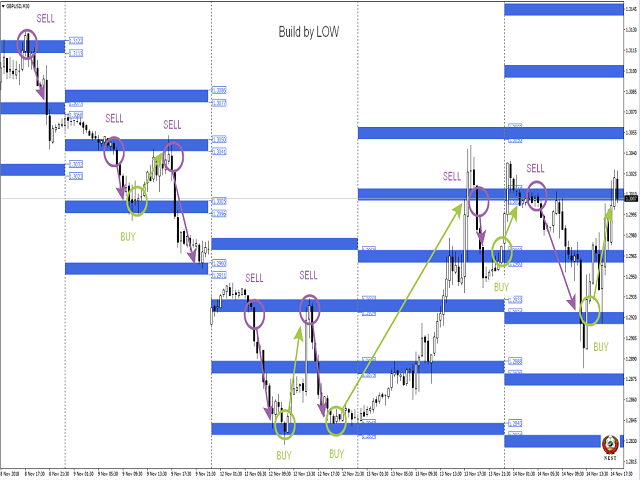
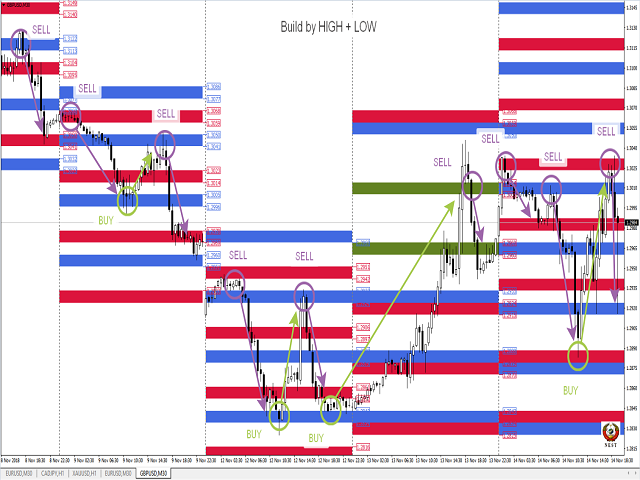
This indicator is designed to automate the construction of decision zones (can act as support-resistance levels) according to the Floating Socket strategy.
The same indicator allows you to significantly reduce the time when analyzing the behavior of prices in decision areas on historical data.

It works on any currency pairs. Time frame: M1-H1.


The NEST trading system (Nest) is notable for its simplicity and efficiency when trading currencies, stocks, indices, metals, commodities and cryptocurrencies on the stock exchange markets.


When you first start the calculation of the indicator takes time. If after installing the indicator on the chart, zones and arrows are not displayed, then remove the indicator from the chart and set it again.

When installed on a chart with a working TF, the indicator for better visualization disables the grid, includes period separators, autoscrolling and offset.


2. Trading tactics

If the price arrives in the nest zone, open an order in the opposite direction to the next zone of the same calculation method (differ in color). Sometimes zones "stick together" and we see one zone instead of two. In this case, keep the order to the nearest zone. Stop order is postponed on the opposite side of the zone.

In the case of fixing the price for the zone of the socket relative to its movement, we open an order by the trend to the next zone of the socket. Stop order is postponed on the opposite side of the zone.

Full description of the trading strategy - YouTube; Telegram


3. Input parameters.

All parameters are set in points for 4-digit quotes (the indicator recounts on 5 characters independently) !!!

  •     Select message language: Select message language
  •     Indicator number: Number of the indicator copy (to be able to install multiple copies of the indicator on the chart. If the number is greater than 0, the logo is not drawn)
  •     ShowInfo : Display of the Info Panel power button
  •     ShowSettings : Display of the settings panel power button
  •     GMT: GMT-offset of your broker.
  •     Number of history days: The number of days to display historical data (only works when the mode of calculating the distance between zones is fixed)
  •     Level size: zone size
  •     Number of levels: Number of levels displayed
  •     Coefficient of calculation: Calculation ratio (cannot be less than 1)

Calculating Distance (block for calculating the distance between zones)

  •     DD: Calculation Option
    •     Fixing Distance: Fixed distance between zones
    •     Dinamic Distance: Dynamic calculation (the distance between the zones is calculated based on the price movement over the past few days)
  •     Day of Dinamic Distance: Number of days for dynamic calculation
  •     Fixing Distance: Distance between zones
  •     Operation mode: Indicator mode
    •     Indicator: indicator mode
    •     Prognoz: forecast mode (only in fixed calculation mode)

Recommended entry points

  • EntryPoint : signal strength selection
  • Distance to Arrows : distance from the candle to the arrow


Drawing Blok (drawing parameter block)

  •     Calculation by HIGH: 1st version of calculation
  •     Calculation by LOW: 2nd version of calculation
  •     Closing price of the USA session: To display or not the closing level of the US session on the previous day
  •     Opening price of the Europe session: To display or not the opening level of the European session
  •     Draw lines: Draw or not lines on a chart
  •     Draw labels: Whether or not to show price labels of zones (when lines are on, they are not displayed)
  •     Clear graphics from unnecessary zones: To remove or not from the schedule the levels of previous days that have not been worked out by the price
  •     Create Screenshots: Make or not a screenshot of the graph at the beginning of the day (screenshots are saved in the \ MQL4 \ Files folder of your terminal)

Alerts (block signals)

  •     Alert Period: The frequency of issuing signals
    •     Current: By the bar lifetime at the current TF
    •     1 Hour: By the bar lifetime on TF H1
  •     Distance to the zone in points: Select the distance in points from the price to the zone
  •     Alerts Start Local Time: The start time of the signals
  •     Alerts Stop Local Time: Signal End Time
  •     Sound signal: Beep
  •     Message on the screen: Alert to the screen
  •     Mobile message: push message to phone
  •     Message to e-mail: Email notification


おすすめのプロダクト
I speak in Hungarian. Magyarul beszélek benne. - You can find the indicator by my name. Which is in the picture and the video. On mql5.com.  " Utam MA High Low" - Megkeresheti az indikátort a nevemnél. Ami a képen és a videóban van. Az mql5.com-on.  " Utam MA High Low" Első felvétel. https://www.youtube.com/watch?v=YzmcyO50YdM&amp ;ab_channel=GyulaKlein (Első felvétel.   https://www.youtube.com/watch?v=FfqvT-i9TPk&feature=youtu.be Első felvétel. https://www.youtube.com/watch?v=MapbQrJ0uPU&t=
Scalping Worm is an essential tool for every trader aiming to improve the accuracy of their market entries and exits. With its advanced weighted moving average formula and adaptive smoothing logic, this indicator not only captures the current trend direction but also helps determine its strength and stability. The blue line signals an uptrend, while the red line indicates a downtrend, making analysis highly intuitive and visually straightforward. The main advantage of this indicator is its abili
This is a gold trader robot. Gold trading is very much different than forex trading because of many variables and sentiment differences about the assets. I created and coded a completely new algorithm for this strategy. The algorithm doesnt use any technical indicators or well known price action patterns. Based on all my testing and and analyzing the different kind of patterns and indicators i realized that, to make a unique gold trading strategy it is just not enough to combine existing tool
Renko Masterx は、練行チャートで取引するために設計された mt4 矢印タイプのインジケーターです。このインジケーターには、勝率や獲得ポイントなどの役立つ情報をトレーダーに提供するバックテスト パネルがあり、ATR x 乗算の tp と sl も提供します。この O O インジケーターオープンバーまたはイントラバーでシグナルを提供し、シグナルが与えられた場所の正確な価格を示す白いマーカーを備えています。このインジケーターの使用方法は、インジケーターが示す矢印に従って買いまたは売りを開始することです。また、インジケーターが示すように TP と SL を確立します。 パラメーター: マスター期間:信号期間 TP ATR: 利益価値を利用してあらゆるシグナルを活用します SL ATR: 各信号を活用するためのストップロス値 ATR PERIOD: tp/sl 値は、この ATR 値を乗算して生成されます TIME FILTER – 使用すると、インジケーターはこのフィルター内の日付によって提供されるシグナルに基づいて損益統計を提供します。 MISC: アラート/矢
At the core of the VidyaPearsonFlow Robot lies the synthesis of two key principles : a daptive filtration of market noise and statistical analysis of correlations between major Forex pairs such as EURUSD, GBPUSD, and XAUUSD. This is not merely an algorithm—it is a system that embodies the harmony of mathematical rigor and the flexibility required to operate in the ever-changing market environment. The Essence of the Method: Adaptive Filtration: The system dynamically adjusts to changing market
Aureus Quantum Surge-H 1:金自動取引の潜在力を解放する Limited Time Offer: Special Offer: Current Price $799 (Limited Time)! Next price: $899 実際のアカウント信号: https://www.mql5.com/en/signals/2297864?source=Site+プロフィール+売り手 概要 Aureus Quantum Surge-H 1は、H 1期間中にXAUSD(ゴールド)を取引するために設計された最先端の専門家コンサルタントです。多様な技術指標と安定したリスク管理技術を組み合わせ、変動する金市場で一貫したパフォーマンスを提供します。​ 主な特徴 高級多指標戦略:Ichimoku Cloud、MACD、ATR、ブリンバンド、LWMAの複雑な組み合わせを利用して高確率の取引機会を識別する。​ カスタマイズ可能なリスク管理: 安全タタールシステム:調整可能なバッチ倍加とリセット条件を備え、リスクを効果的に制御するオプションの戦略。​ 止損と止盈:市場
Gold Ambush Breakout Aurum Xauusd Algo ゴールド・スナイパー | トレンド・スイング戦略 | 安定した資産成長 Aurum Gold Ambushは、**XAUUSD(ゴールド)に特化した、忍耐と正確さを重視したトレーディングシステムです。毎分トレードするような高頻度ボットとは異なり、このアルゴリズムはスナイパー(狙撃手)**のように振る舞います。完璧なセットアップを待ち、最大の動きを捉えるために一撃を放ちます。 このEAは、量より質を優先し、長期的な資本成長のために設計されています。 ️ このEAはあなたに適していますか?(必ずお読みください)  * 1時間ごとのトレードや派手な「アクション」を求めている方は購入しないでください。  * 「一攫千金」を狙うギャンブルツールを求めている方は購入しないでください。  * 1回の完璧なスイングトレードが、50回の小さなスキャルピングトレードよりも価値があると理解している方はご購入ください。  * プロフェッショナルなリスクリワード比率で、着実に資産を増やしたい方はご購入ください。
Golden Mean MT4 : Your Personal Forex Trading Coach Golden Mean MT4 is more than just an automated platform; it's your personal transmuter in the volatile world of Forex. It's designed not for predictions, but to transform the unpredictability of currency movements into profitable trades. Based on the harmony of advanced algorithms and a deep understanding of market realities, this tool will become your reliable guide in the turbulent waters of trading, opening new horizons for both beginners an
Pisces TheProfitZone "Pisces TheProfitZone MT4 Indicator Powered byFxGangster" This indicator will calculate new support and resistant zone everyday, and that give us a trading zone such as thats telling us TP and SL, So it still telling us for where should the price will go reach? Fore Example. Uptrend : If Price can stay upper a Line and price close higher above a Line, then the price will continue go up to reach next Line. Downtrend : If Price can't pass to stay upper a Line and the price
トレンドパルスワンは、改良版パラボリックSARを基盤としており、矢印シグナルを補完する新世代の指標です。この指標は、トレンド分析プロセスを簡素化し、トレーダーに対して明確で視覚的に理解しやすいエントリーポイントとエグジットポイントを提供することを目的としています。 標準SARとの主な違いは、トレンドパルスがSARラインにトレンド方向の変化を示す矢印を追加している点です。これにより、視覚的な分析や実際の取引に役立つ指標となっています。 インジケーターの仕組み SARライン(ライム色): 現在のトレンド方向を示す動的曲線として表示されます。 ・SARが価格の下にある場合、市場は上昇トレンドにあります。 ・SARが価格の上にある場合、市場は下降トレンドにあります。 ・ チャートの矢印 青い上向き矢印(BUY):トレンドが上昇トレンドに転換した際に表示されます。 赤い下向き矢印(SELL):トレンドが下降トレンドに転換した際に表示されます。 フィルタリングアルゴリズム: 動的なステップ値と最大値を使用し、さまざまな市
Boost binary option profesional
Sebastian Alejandro Merino Sepulveda
Binarias & Forex (+90% Ratio-Win Next Candle) Espere que el precio llegue a una buena zona (fuerte) sea soporte, resistencia, zona de oferta o demanda, fibonacci level key, cifra redonda. Haciendo lo anterior definitivamente habrá una reversión en el precio y obtendrá su ITM en primera vela dando una efectividad del 100% siguiendo la tendencia. Es muy importante estar atento a las noticias fundamentales en el mercado y estas no afecten tu trading. Sesiones comerciales: cualquiera (24 horas).
The Name Green Wall : Arrows hits a lot of TP, by changing the idea of non using SL as something bad, but instead use Small TP and a lot of free Margin and Patience. Use micro TP and a lot of Free Margin with this indicator on Forex. It also can be used with Binary Options. This strategy is intended to be traded Manually. This Indicator runs on Open Bar, arrows will delete when price are against it. The only Indicator Parameter is Alerts true/false, all the rest is included inside the code. Arro
The purpose of this new version of the MT4 standard indicator provided in your platform is to display in a sub-window multiple timeframes of the same indicator with its divergences. See the example shown in the picture below. But the display isn't like a simple MTF indicator. This is the real display of the indicator on its timeframe. Here's the options available in the FFx divergences indicator: Select the timeframes to be displayed (M1 to Monthly). Define the width (number of bars) for each ti
Meta Trader AI Bot
Gedara Prasad Chathuranga Deniye
SwiftTradeAiBot_V01-1 - Powerful & Efficient Forex Trading Solution SwiftTradeAiBot_V01-1 is an advanced and versatile Expert Advisor (EA) designed to optimize your trading in the forex market. Tailored for the EURUSD pair, this EA leverages advanced algorithms to maximize profitability, manage risk, and minimize losses with ease. Suitable for both beginner and experienced traders, SwiftTradeAiBot automates the entire trading process, allowing you to focus on strategy rather than execution. Key
Supply and Demand Tracker MT4  US PPI, Fed Interest Rates, and FOMC Trade Setup Time Lapse: U.S. dollar(DXY) and Australian dollar vs U.S. dollar(AUD/USD) https://youtu.be/XVJqdEWfv6s  May CPI Trade Setup Time Lapse: Gold, Euro/US dollar, US Tech 100, and USDX Experience the power of our cutting-edge supply and demand system as we delve into the captivating world of market dynamics surrounding the release of the consumer price index (CPI). Our system, built on the principles of supply and deman
PTW NON REPAINT TRADING SYSTEM + HISTOGRAM Non-Repainting ,   Non-Redrawing   and   Non-Lagging  Trading System. Does the following: - Gives Accurate Entry and Exit Points - Scalping, Day and Swing Trading  - 95% Accuracy  - Targets, where to take profits. - Shows Trends, Support and resistance levels - Works on All Brokers - Works on All Currencies, CFDs and Stocks - It does not place trades for you, it only shows you what trades to place. - It works on All Timeframes - It is for Trend or ran
The work of the Stable Pulse bot is displayed in the form of several key mmoments, which can be seen in the screenshots. This development is a scalping system. You can download and test the bot for free this way by yourself making sure of its capabilities. The bot can be tested on different currency pairs and different periods. The main thing is to set the tester settings as shown in the screenshot, for correct testing. You need to trade on timeframes M1-M15. Expert Advisor is designed to trade
Trend Market EA  это полностью автоматическая система. В данный момент советник продаётся по акции по цене 499 $ вместо 999 $ Trend Market EA  - работает по направлению тренда на старшем таймфрейме. Сигналом на открытие ордера служит сигнал индикатора HMA на графике текущего таймфрейма, на котором установлен советник, Если сигнал совпадает с направлением тренда на старшем таймфрейме, то советник открывает рыночный ордер в направлении тренда. Если же тейкпрофит не достигут, а тренд разворачивает
This expert is based on a custom-made indicator combined with price action signals. The combination of our indicator mixed with PA gives wonderful results. Expert adviser is optimized for GBPUSD and EURUSD. It works independently of the timeframe. Features: Low drawdown Small stop-loss No Martingale strategy No Grid strategy Scalping Small secure trades Volatility detection * Works with all brokers which apply to: Fast execution (market execution) Good liquidity (no spikes in the spread dur
Oni Scalper
Goh Cheng Wai
3.67 (3)
Dear Onis, This Indicator is used for   GBPUSD, US30 and GOLD on 1-Min Chart . For US30 , Depending on your broker, Minimum Lot Size will differ from 0.01 to 1.0 lots. My Current Account is trading at 1.0 lots at $1 per point . Please check with your Broker what's the Margin Required for your Minimum lot sizes before you trade on your Real account. I have Forward Tested the indicator for around 6 months before releasing it to the public. ( No Demo is available for the Indicator, Strategy Teste
"Trend Finder" is a trend trading strategy that combines market noise filtration and all necessary functions in one tool! The system automatically displays entry and exit points using arrows. Only one parameter is sufficient for configuration. It offers simple, intuitively understandable, and effective trend detection. The intelligent algorithm of the "Trend Finder" indicator identifies potential market reversal points. Often, a good trend can be visually observed on the price chart. However, a
Heikin-Ashi-Sniper is a perfect addition to your portfolio. It is meant to be traded on EURUSD on H1 Timeframe. It uses Heikin-Ashi High and Low/High of Monthly timeframe to determine optimal entry signals while having a reasonably low drawdown More EA´s will be published shortly to complete the Portfolio. The EA Trades not very frequently it waits for the right chance and places the order. The rest of the time, your capital is free to be traded on other strategies Please see backtest results i
FREE
The idea of the indicator is based on the ZigZag indicator using a new equation with the addition of volume. Inputs InpDepth — Depth. InpDeviation — Deviation. InpBackstep — Backstep. Enable_Alert — audio and text notifications on a trend change. Send_Notifications — push notifications to mobile devices. E-mail alert — email notifications. Make sure to configure email parameters in the terminal settings. Features The indicator does not repaint. The indicator does not recalculate. The indicator
需給ゾーンの主要価格指標 背景 システムはKライン上の需要と供給の領域を自動的に検索し、リアルタイムの主要価格ラインを描画します。トレーダーは価格取引ラインに基づいて取引を行うことができます。 主な特徴 システムはKライン内の供給エリアと需要エリアを自動的に検索します。このシステムはリアルタイムの主要価格ラインも描画し、トレーダーは価格取引ラインに基づいて取引を行うことができます。したがって、需要と供給ゾーン戦略を使用するトレーダーは、需要と供給エリアの兆候を探すのに時間を費やす必要がなくなります。代わりに、需要と供給の領域と主要な価格に対する価格の反応に焦点を当て、自分に合った取引戦略を立てることができます。 ただし、需給ゾーン戦略自体はボラティリティが高い時期に効果を発揮する戦略であるため、市場が強いトレンドを示している場合には注意して使用するか、インジケーターが提供する示唆をトレンドの方向に活用する必要があります。 範囲 ShowZones: 供給ゾーンと需要ゾーンを表示するかどうか DrawLines: 主要価格を表示するかどうか SupplyZoneLineColor:
MaxProfitDZ Expert adviser MaxProfitDz v1.4     Recommendations Symbol: ALL PAIRS ..i Recommended    EURUSD. Time Frame:1M. Brokers: ALL brokers .  low spread/commission, 1:500 leverage Minimum Deposit Recommended :   $500 USD  Lot Size for 500$   : 0.01  Use a broker with good execution and with a spread of 0.1-2 points. A very fast VPS is required Parameters EA TrendON=true (Read the  note ) MMType = 2 LotMultiplikator = 1 LotConst_or_not = TRUE Take profit :5-10 pips  for accounts with five
They say that currency market is flat most of the time.  NEON Bot EA based on this principle namely on the logic price's return to average value with filtering entry due to custom indicator. EA uses the strategy of martingale therefore it sets stop-loss for each position separately. Also the quantity of orders in the grid is limited. Don't try to change recommended MM to avoid a large drawdown.  Signals:   https://www.mql5.com/ru/users/samivanov/seller !Attention! EA is sensitive to chart perio
Evolution XAU EA
Ignacio Agustin Mene Franco
Evolution XAU EA v2.00 Multi-Strategy Expert Advisor for XAU/USD Overview Evolution XAU EA is a state-of-the-art automated trading system designed specifically for trading the XAU/USD pair (Gold vs. Dollar). It combines three proven technical strategies into a single intelligent algorithm, enabling strategic diversification that maximizes market entry opportunities. Implemented Strategies The EA uses a multi-strategy approach where any of the three systems can generate valid trading signals:
Steady Ranger EA – スマートで安全なチャネル取引 バックテスト: 提供された set ファイル(コメント欄)を使用し、「始値のみ」モードでテストしてください。 動画: 字幕付きのビデオを視聴して、詳細を理解してください。 なぜ Steady Ranger EA を選ぶのか? 長期的な安定性とリスク管理を重視した取引システムであり、非現実的な利益を追求するものではありません。 多層ストップ保護: 各取引のストップロスと「損失合計制限」の両方を使用し、ドローダウンを管理。 チャネルベースの取引戦略: 価格チャネルの極端なレベルで取引を行い、適切なシグナルで決済。 適応型ロット調整: リスクを制御しながら、ロットサイズを動的に調整。 マルチタイムフレームフィルター: 一方向の強いトレンド中のエントリーを回避。 信頼性のある戦略: 長期的な安定性を実現し、フォワードテストを通過。 仕組み EA は価格チャネルに沿ってエントリーし、シグナルやストップロス、リスク管理の仕組みに基づいて決済します。過剰なポジションを防ぐため、ロットサイズを制御し、最大ロットに達すると新規ポジション
What indicator do you look at most on your MT4 charts? Is it the Moving Average? I d o not believe that the default grid lines on MT4 charts—which you likely see hundreds or thousands of times—are designed with the intent of helping the user win. This is why MT4 users apply various indicators and go through trial and error. Because it is a chart you look at every day, it must present reliable information that we humans can recognize intuitively. This indicator was born from a single core concep
Introduction to Fractal Pattern Scanner Fractal Indicator refers to the technical indicator that makes use of the fractal geometry found in the financial market. Fractal Pattern Scanner is the advanced Fractal Indicator that brings the latest trading technology after the extensive research and development work in the fractal geometry in the financial market. The most important feature in Fractal Pattern Scanner is the ability to measure the turning point probability as well as the trend probabi
このプロダクトを購入した人は以下も購入しています
Pulse Scalping Line - an indicator for identifying potential pivot points. Based on this indicator, you can build an effective Martingale system. According to our statistics, the indicator gives a maximum of 4 erroneous pivot points in a series. On average, these are 2 pivot points. That is, the indicator shows a reversal, it is erroneous. This means that the second signal of the indicator will be highly accurate. Based on this information, you can build a trading system based on the Martingale
Miraculous Indicator – ガン・スクエア・オブ・ナインに基づく100%非リペイントのFXおよびバイナリーツール この動画では、FXおよびバイナリーオプションのトレーダー向けに特別に開発された、非常に正確で強力な取引ツールである Miraculous Indicator を紹介しています。このインジケーターがユニークなのは、伝説的な ガン・スクエア・オブ・ナイン と ガンの振動の法則 に基づいている点で、現代の取引で利用できる最も正確な予測ツールの一つとなっています。 Miraculous Indicatorは 完全に非リペイント であり、ローソク足が確定した後にシグナルが変化したり消えたりすることはありません。つまり、見たものがそのまま利用できます。これにより、トレーダーは自信を持ってエントリーおよびエグジットを行うための信頼性と一貫性のある根拠を得ることができます。 主な特徴: ガン・スクエア・オブ・ナインとガン理論に基づいて構築 100%非リペイントのシグナルシステム すべての時間枠(M1、M5、H1、H4、日足、週足)で機能 FXおよびバイナリーオプション取引
BinaryIndicator is a highly accurate indicator for trading binary options. It shows excellent results in scalping. This indicator is based in multifactor analysis of trend indicators, as well as confirmation oscillators, which in the end gives an increased accuracy of signals. Advantages of the indicator Increased accuracy of signals. Excellent results when trading binary options with a short expiration time from M30 to M1 . It works on any timeframes. Works with any trade symbols. Parameters
Rtc ML Ai | Predictor CORE MACHINE LEARNING ENGINE Adaptive ML Market Predictor – Multi-Bar Trend & Candle Forecast What This Indicator Does This indicator is a  real-time market prediction engine  designed to analyze price behavior and estimate  future market tendencies . Unlike conventional indicators, this system  does not rely on static parameters or historical curve-fitting , but adapts its internal state dynamically during live market operation. Instead of using static rules, the indic
FFx Engulfing Setup Alerter gives trade suggestions with Entry, Target 1, Target 2 and StopLoss. Below are the different options available: Entry suggestion - pips to be added over the break for the entry 3 different options to calculate the SL - by pips, by ATR multiplier or at the pattern High/Low 3 different options to calculate the 2 TPs - by pips, by ATR multiplier or at Risk/Reward Offset the dashboard - any place on the chart Remove the suggestion once the price reached the SL line Lines
FFx InsideBar Setup Alerter gives trade suggestions with Entry, Target 1, Target 2 and StopLoss. Below are the different options available: Entry suggestion - pips to be added over the break for the entry Minimum candle size - to avoid too close buy/sell entry suggestions 3 different options to calculate the SL - by pips, by ATR multiplier or at the pattern High/Low 3 different options to calculate the 2 TPs - by pips, by ATR multiplier or at Risk/Reward Offset the dashboard - any place on the c
FFx OutsideBar Setup Alerter gives trade suggestions with Entry, Target 1, Target 2 and StopLoss. Below are the different options available: Entry suggestion - pips to be added over the break for the entry. 3 different options to calculate the SL - by pips, by ATR multiplier or at the pattern High/Low. 3 different options to calculate the 2 TPs - by pips, by ATR multiplier or at Risk/Reward. Offset the dashboard - any place on the chart. Remove the suggestion once the price reached the SL line.
FFx PinBar Setup Alerter gives trade suggestions with Entry, Target 1, Target 2 and StopLoss. Below are the different options available: Entry suggestion - pips to be added over the break for the entry Minimum candle size - to avoid too small candles 3 different options to calculate the SL - by pips, by ATR multiplier or at the pattern High/Low 3 different options to calculate the 2 TPs - by pips, by ATR multiplier or at Risk/Reward Offset the dashboard - any place on the chart Remove the sugges
The purpose of this new version of the MT4 standard indicator provided in your platform is to display in a sub-window multiple timeframes of the same indicator with its divergences. See the example shown in the picture below. But the display isn't like a simple MTF indicator. This is the real display of the indicator on its timeframe. Here's the options available in the FFx divergences indicator: Select the timeframes to be displayed (M1 to Monthly) Define the width (number of bars) for each tim
The purpose of this new version of the MT4 standard indicator provided in your platform is to display in a sub-window multiple timeframes of the same indicator with its divergences. See the example shown in the picture below. But the display isn't like a simple MTF indicator. This is the real display of the indicator on its timeframe. Here's the options available in the FFx divergences indicator: Select the timeframes to be displayed (M1 to Monthly). Define the width (number of bars) for each ti
The FFx Dashboard MTF alerter will show you on a single chart all the timeframes (M1 to Monthly) with their own status for the indicator. 2 Alert Options: Single timeframe: each selected timeframe alert separately when a signal occurs Multi timeframes: all selected timeframes must agree for an alert to be triggered Both options have an input to select the timeframes to be used for the alert(s). How to Understand the Status: Green/Red square: histogram above/below 0 line Green square + Red bord
The FFx Dashboard MTF alerter will show you on a single chart all the timeframes (M1 to Monthly) with their own status for the indicator. 2 Alert Options: Single timeframe: each selected timeframe alert separately when a signal occurs Multi timeframes: all selected timeframes must agree for an alert to be triggered Both options have an input to select the timeframes to be used for the alert(s). How to understand the status: Green/Red square: RSI above/below 50 line Green square + Red border: R
The FFx Dashboard MTF alerter will show you on a single chart all the timeframes (M1 to Monthly) with their own status for the indicator. 2 Alert Options: Single timeframe: each selected timeframe alert separately when a signal occurs Multi timeframes: all selected timeframes must agree for an alert to be triggered Both options have an input to select the timeframes to be used for the alert(s). How to understand the status: Green/Red square: Stoch above/below 50 line Green square + Red border:
The FFx Dashboard MTF alerter will show you on a single chart all the timeframes (M1 to Monthly) with their own status for the indicator. 2 Alert Options: Single timeframe: each selected timeframe alert separately when a signal occurs Multi timeframes: all selected timeframes must agree for an alert to be triggered Both options have an input to select the timeframes to be used for the alert(s). How to understand the status: Green/Red square: Price above/below Cloud (Kumo) Green square + Red bo
The FFx Dashboard MTF alerter will show you on a single chart all the timeframes (M1 to Monthly) with their own status for the indicator. 2 Alert Options: Single timeframe: each selected timeframe alert separately when a signal occurs Multi timeframes: all selected timeframes must agree for an alert to be triggered Both options have an input to select the timeframes to be used for the alert(s). How to understand the status: Green/Red square: MA pointing Up/Down Green square + Red border: MA po
The FFx Dashboard MTF alerter will show you on a single chart all the timeframes (M1 to Monthly) with their own status for the indicator. 2 Alert Options: Single timeframe: each selected timeframe alert separately when a signal occurs. Multi timeframes: all selected timeframes must agree for an alert to be triggered. Both options have an input to select the timeframes to be used for the alert(s). How to understand the status: Green square: Price above PSAR Red square: Price below PSAR Options
The FFx Dashboard MTF alerter will show you on a single chart all the timeframes (M1 to Monthly) with their own status for the indicator. 2 Alert Options: Single timeframe: each selected timeframe alert separately when a signal occurs Multi timeframes: all selected timeframes must agree for an alert to be triggered Both options have an input to select the timeframes to be used for the alert(s). How to understand the status: Green/Red square: CCI above/below levels (ie. 100/-100) Grey square: C
The FFx Dashboard MTF alerter will show you on a single chart all the timeframes (M1 to Monthly) with their own status for the indicator. 2 Alert Options: Single timeframe: each selected timeframe alert separately when a signal occurs Multi timeframes: all selected timeframes must agree for an alert to be triggered Both options have an input to select the timeframes to be used for the alert(s). How to understand the status: Green/Red square: ADX above level Grey square: ADX below level Red bor
The FFx Dashboard MTF alerter will show you on a single chart all the timeframes (M1 to Monthly) with their own status. 2 Alert Options: Single timeframe: each selected timeframe alert separately when a signal occurs Multi timeframes: all selected timeframes must agree for an alert to be triggered Both options have an input to select the timeframes to be used for the alert(s). How to understand the status: Green/Red square: bullish/bearish candle Options available in the FFx Dashboard Alerter
The [GRAFF] III manual trading system is based on multiple MetaTrader (MT4) indicators. Together, the entire PACK of GRAFF III indicators makes an advanced trading tool. The system consists of over 20 different custom-built indicators which have been carefully selected and tested in the long term to produce strong and efficient trading signals. The particular indicators are based on different mathematical formulas, so the entire system is calibrated to remove false signals from its own indicator
FFx Universal Strength Meter PRO is more than a basic strength meter. Instead of limiting the calculation to price, it can be based on any of the 19 integrated strength modes + 9 timeframes. With the FFx USM, you are able to define any period for any combination of timeframes. For example, you can set the dashboard for the last 10 candles for M15-H1-H4… Full flexibility! Very easy to interpret... It gives a great idea about which currency is weak and which is strong, so you can find the best pai
Pan PrizMA CD Phase is an analogue of the МetaТrader 5 indicator , and is an option based on the Pan PrizMA indicator. Details . Averaging by a quadric-quartic polynomial increases the smoothness of lines, adds momentum and rhythm. Extrapolation by the sinusoid function near a constant allows adjusting the delay or lead of signals. The value of the phase - wave status parameter (which is close in meaning to the trigonometric phase or the angle of the radius-vector rotation in the trigonometric p
This indicator displays in a separate window the difference between the number of points which increased the price, and the number of points that decreased the price during the time interval specified in the settings. The time interval for calculation is expressed as the number of bars of the chart the indicator is attached to. This approach allows you to evaluate the movement direction (growth or fall) of the instrument's price, the strength of the movement and the size of the movement in point
MetaTrader 5 version available here : https://www.mql5.com/en/market/product/24882 FFx Basket Scanner is a global tool scanning all pairs and all timeframes over up to five indicators among the 16 available. You will clearly see which currencies to avoid trading and which ones to focus on. Once a currency goes into an extreme zone (e.g. 20/80%), you can trade the whole basket with great confidence. Another way to use it is to look at two currencies (weak vs strong) to find the best single pairs
NostradamusMT4
Andrey Spiridonov
1 (1)
NostradamusMT4 is a powerful indicator from the set of professional trader. The indicator is based on Andrei Spiridonov's original price calculation method (ESTIMATED PRICE) for the current candle price. Advantages The indicator does not redraw. It works on any timeframes. Works with any trading instruments. Perfectly suitable for scalping and trading binary options. Parameters Color - color of the ESTIMATED PRICE FUTURE line. How to work with the indicator The indicator forms the ESTIMATED P
MetaTrader 5 version available here: https://www.mql5.com/en/market/product/25794 FFx Pivot SR Suite PRO is a complete suite for support and resistance levels. Support and Resistance are the most used levels in all kinds of trading. Can be used to find reversal trend, to set targets and stop, etc. The indicator is fully flexible directly from the chart 4 periods to choose for the calculation: 4Hours, Daily, Weekly and Monthly 4 formulas to choose for the calculation: Classic, Camarilla, Fibonac
BinaryScalping is a professional indicator for trading binary options and scalping. The algorithm of the indicator is based on the calculation of pivot points for each time period separately, the location of the price of the trading instrument relative to the pivot points is analyzed and the probability of a trading operation is calculated. The indicator has a built-in filter of trading signals based on the global trend. The indicator is installed in the usual way and works with any trading inst
This is the complete REX package. It consists of the lite, pro and ULTRA version.  Perfect for beginners and intermediates. REX complete is 100% non repaint. The strategy is based on a mix of different strategies, statistics, including pivot points, oscillators and patterns.  As the trading idea consists of a variety of some classic indicators like Momentum, Williams Percent Range, CCI, Force Index, WPR, DeMarker, CCI, RSI and Stochastic, it is clear that the fundamental indicators have being u
フィルタ:
Igor
99
Igor 2018.11.21 20:48 
 

ユーザーは評価に対して何もコメントを残しませんでした

レビューに返信