Universal Main Window Free MT5
- インディケータ
- Yurij Kozhevnikov
- バージョン: 1.7
- アップデート済み: 18 9月 2018
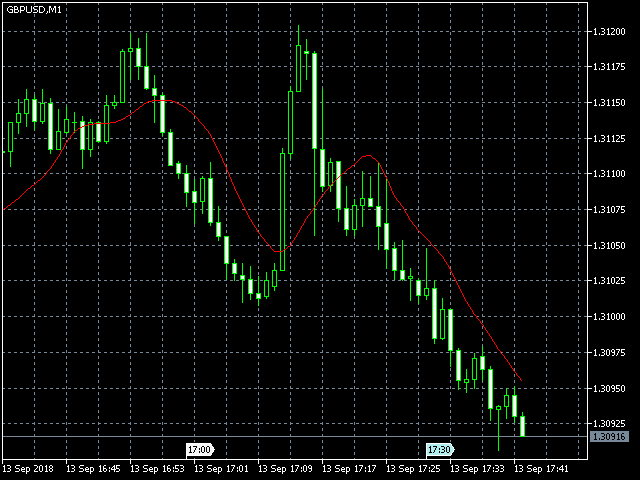
Not everyone can write an indicator. But anyone can have an idea. The indicator Universal Main Window Free MT5, which takes as an input parameter the formula by which the indicator line will be drawn, will help to implement it. This indicator is intended for use in the main chart window.
All indicators of the series Universal:
| Main window | Separate window | |||||||||
|---|---|---|---|---|---|---|---|---|---|---|
| Free |
|
|
||||||||
| Full |
|
|
Input parameters
| Название | Описание |
|---|---|
| Expression1 = | A field in which you can enter part of the formula, replacing this part in subsequent expressions and in the main formula with the name of the parameter Expression1. Optional parameter. |
| Expression2 = | A field in which you can enter part of the formula, replacing this part in subsequent expressions and in the main formula with the name of the parameter Expression2. Optional parameter. |
| Expression3 = | A field in which you can enter part of the formula, replacing this part in subsequent expressions and in the main formula with the name of the parameter Expression3. Optional parameter. |
| Expression4 = | A field in which you can enter part of the formula, replacing this part in subsequent expressions and in the main formula with the name of the parameter Expression4. Optional parameter. |
| Expression5 = | A field in which you can enter part of the formula, replacing this part in the following expression and in the main formula with the name of the Expression5 parameter. Optional parameter. |
| Expression6 = | A field in which you can enter part of the formula, replacing this part in the main formula with the name of the parameter Expression6. Optional parameter. |
| Line Function = | The field in which you want to enter your formula. Required parameter. |
| Line Label | The name that will be displayed in the "Data Window". Optional parameter. |
| Draw count bars | The number of bars for which the indicator will be calculated. A zero or a negative value means the whole chart. |
| Digits | The number of decimal places for the indicator values. A negative value indicates the accuracy of the values of the current chart. |
| Draw Type | Select the style of drawing the indicator: line, line segments or arrows. |
| Arrow Code | The arrow code for the corresponding drawing style. |
| Shift | Shift of the indicator line relative to the chart. |
Features
The indicator checks the correctness of the entered formula and the number of arguments in the functions. If an error is found in the formula, the corresponding entry appears in the Expert Log, and the initialization fails.
If an arithmetic error occurs during the calculation (division by zero, the square root of the negative number), or an attempt is made to query price data or standard indicators outside the graph, or incorrect arguments are entered in the function of querying the value of the standard indicator, then the indicator shows a missing value at this point.
The character register in the function names does not matter. The number of spaces in the formula does not matter.
The integer and fractional parts in numbers are separated by a period, the function arguments are separated by commas.
Rules for writing formulas
The following arithmetic operations are supported:| Notation | Description |
|---|---|
| + | Addition |
| - | Subtraction |
| * | Multiplication |
| / | Division |
| ^ | Exponentiation |
Only parentheses are supported.
Differences from the full version
The difference between this indicator and the full version is the absence of comparison operations and logical functions.Functions
The length limit of the description does not allow you to provide detailed documentation here, so a detailed description of the supported functions is rendered on a separate page.Ranges
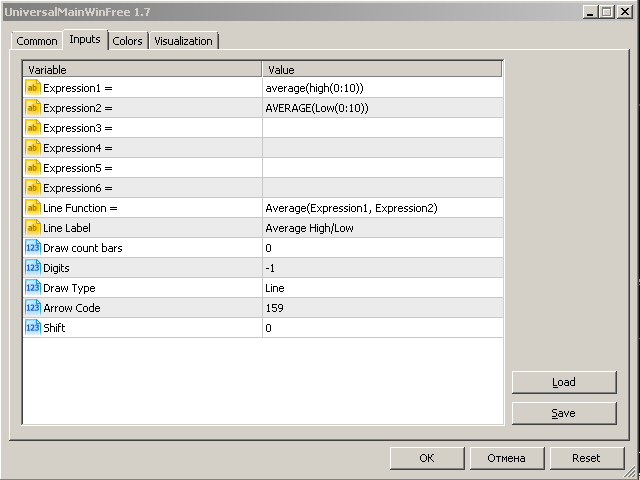
An example of formula
| Expression1 = |
average(high(0:10))
|
| Expression2 = |
AVERAGE(Low(0:10))
|
| Expression3 = |
|
| Expression4 = |
|
| Expression5 = |
|
| Expression6 = |
|
| Line Function = |
Average(Expression1, Expression2)
|
Examples of problem solving


ユーザーは評価に対して何もコメントを残しませんでした