Backtest vs Live

  • ユーティリティ
  • Mohamed-amine Baddir
    Mohamed-amine Baddir
    MetaTrader 5向けのExpert Advisor(EA)を開発し、実際に取引で使用する前に十分なテストを行います。
    対応内容:
    お客様のトレード戦略、TradingViewスクリプト、または文章化されたルールを、クリーンなMT5 Expert Advisorに変換
    既存EAの修正・バグ修正:リスク%によるロットサイズ計算、トレーリングストップ、セッション・時間フィルター、スプレッドフィルター、複数銘柄ポートフォリオ、ドローダウン保護
  • バージョン: 1.0
  • アクティベーション: 5

Backtest vs Live explains why an Expert Advisor earns a different amount live than in the Strategy Tester. It matches every live trade with its twin in the backtest, then splits the whole difference of the results, to the cent, into entry prices, exit prices, swap and commission, lots and currency conversion, trades the backtest made that live trading missed, and live trades the backtest never made. It can also compare two backtests, for example the same Expert Advisor with and without execution delay, or two brokers.

How To Use

  • Test the Expert Advisor in the Strategy Tester over the period it traded live, with the same symbol and settings. Right click on the Backtest tab > Report > save it as HTML into MQL5\Files\BacktestLive (File > Open Data Folder).
  • Attach Backtest vs Live to any chart of the account that traded live, and set the magic number of the Expert Advisor in the inputs.
  • Open MQL5\Files\BacktestLive\BacktestLive.html in any browser. The time tolerance of the matching can be changed at the top of the page.
  • To compare two backtests instead, set "Compare the backtest with" to a second saved report.

What The Page Shows

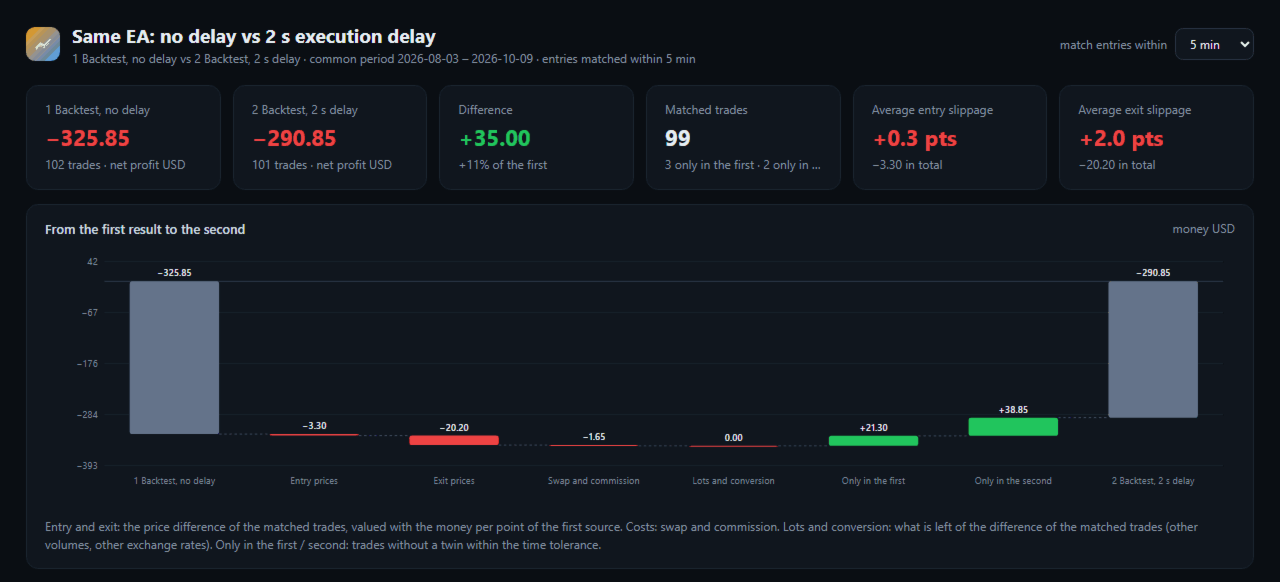
  • Net profit of both sources over their common period, the difference, and the number of matched trades.
  • A waterfall from the first result to the second: entry prices, exit prices, swap and commission, lots and conversion, trades only in the first source, trades only in the second. The steps add up exactly, and the page checks it.
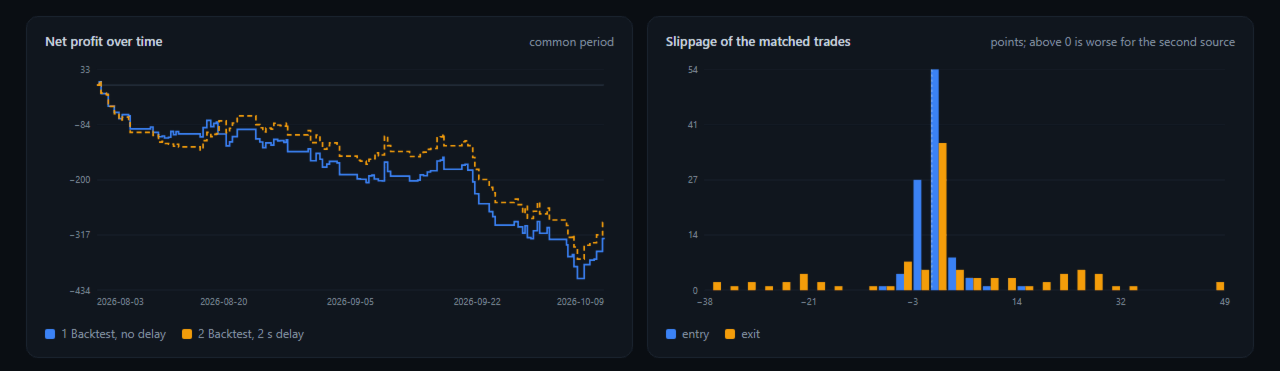
  • Both equity curves of closed trades on one chart.
  • The distribution of entry and exit slippage in points, and the average entry slippage by hour of the day.
  • Results and slippage by symbol.
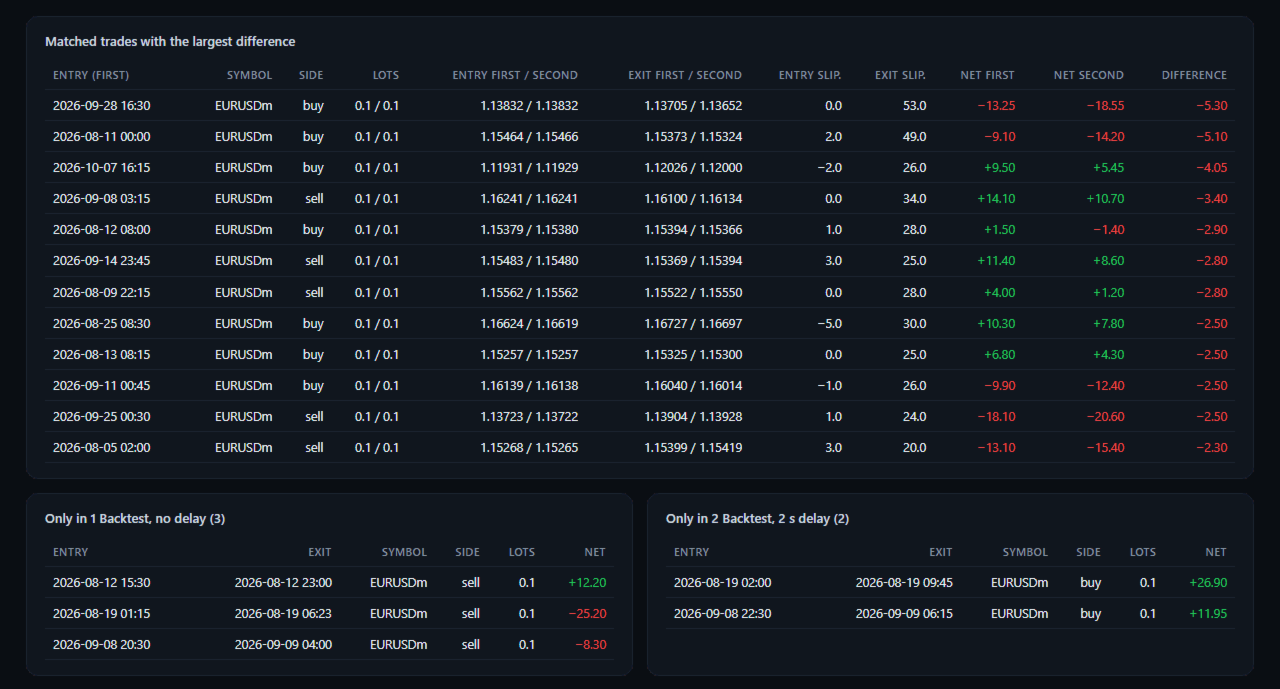
  • The matched trades with the largest difference, with both entry and exit prices, and the lists of trades without a twin.

Matching

  • A trade is matched with the nearest free trade of the other source with the same symbol and direction whose entry is within the tolerance (5 minutes by default).
  • Symbol names of different brokers are matched automatically when one starts with the other (EURUSD and EURUSDm), or by the symbol map input.
  • A time shift input corrects a different server time zone between the backtest and the live broker.
  • Trades closed in parts and reversals are matched with their entries, oldest first, in reports; by position in the account history.

Inputs

  • Compare the backtest with: the history of this account, or a second saved report
  • Folder in MQL5\Files with the saved reports; the backtest report and the second report (empty = the first and second reports of the folder)
  • Account history: magic number, symbol
  • Match entries within (minutes)
  • Hours added to the times of the second source
  • Symbol names, backtest=second (e.g. XAUUSD=GOLD)
  • Folder in the common Files folder of all terminals
  • Page title

Good To Know

  • Slippage is valued with the money per point of each backtest trade, so the entry and exit steps are in the account currency of the backtest.
  • The demo runs in the Strategy Tester and compares two reports: put two saved reports into the common folder Files\BacktestLive (File > Open Common Data Folder); the page is written when the test ends.
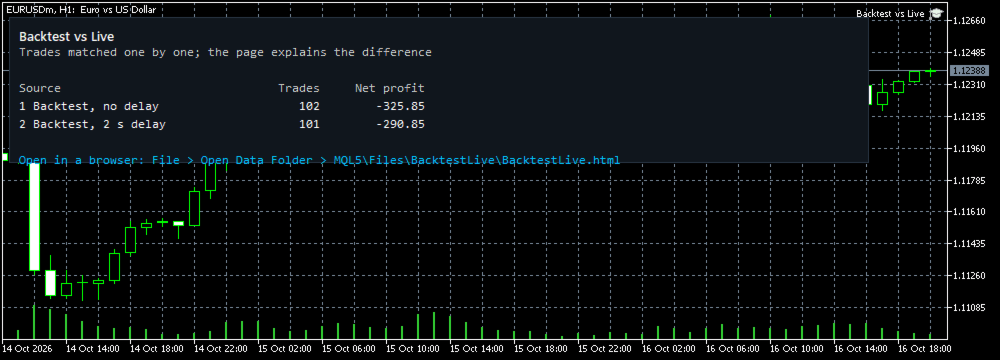
  • The screenshots compare two tests of an example Expert Advisor on EURUSD, one with a 2 second execution delay. They show the page, not trading results to expect.
  • The utility reads files and history only. It does not trade and does not change any setting.
作者のその他のプロダクト
Account Performance Report turns the history of your account into one HTML report that you open in any browser: balance and drawdown, the result of each Expert Advisor and each symbol, a daily P&L calendar, monthly returns and the usual statistics. The main figures are also shown on the chart, and the report is kept up to date while the terminal runs. How To Use Attach Account Performance Report to any chart of the account. It does not trade, so any symbol and timeframe will do. The report is wr
FREE
Prop Risk Guard は、口座のリスク管理ルールを自動的に適用します。1つのチャートに追加するだけで、口座内のすべてのポジションを監視します。設定した上限に達すると、ポジションを決済し、指値・逆指値などの保留中注文を削除して取引をロックします。これにより、1回の大きな損失や制御不能になったEAによって、評価口座や資金提供口座のルールに違反することを防ぎます。 1日の損失上限 パーセンテージ、固定金額、またはその両方で設定できます(より厳しい上限が適用されます)。 1日の開始時点の残高、1日の開始時点の有効証拠金(Equity)、またはその2つのうち高い方を基準に計算します。 毎日のリセット時刻は、サーバー時間に基づいて自由に設定できます。 ロックは次のリセットまで維持され、リセット後は取引が自動的に再開されます。 入金および出金は、1日の損失として計上されません。 最大ドローダウン 固定式: 初期残高を基準に計算します。 トレーリング式: 有効証拠金(Equity)の最高到達点を基準に計算します。 初期残高までのトレーリング: 有効証拠金の上昇に合わせて上限が引き上げられ、初
The Strategy Tester runs one Expert Advisor at a time. If you run several EAs on one account, their separate reports do not tell you the combined drawdown, the margin they need together, or whether the account can carry them at all. Portfolio Backtest Combiner answers that from the reports you already have. How It Works Backtest each Expert Advisor as usual and save the report as HTML (Strategy Tester > Backtest tab > right click > Report > save as HTML) into the MQL5\Files folder of the termina
Backtest Report Compare puts several Strategy Tester reports side by side on one HTML page: growth and drawdown curves on one chart, the main statistics in one table, the correlation of their daily results, monthly returns and results by weekday and hour. Use it to choose between Expert Advisors, between settings of one Expert Advisor, or to see which strategies lose on the same days. How To Use In the Strategy Tester, after each test: right click on the Backtest tab > Report > save it as HTML i
FREE
Trade Excursion Analyzer measures how far every closed trade went against you (maximum adverse excursion, MAE) and in your favour (maximum favorable excursion, MFE) before it closed. It reads saved Strategy Tester reports or the history of your account, measures each trade on the price history of your terminal and writes one HTML page: where your stop-loss could be, how much open profit your exits give back, and what a fixed stop-loss or take-profit would have changed. How To Use Backtests: in t
Optimization Robustness Map reads the results of a Strategy Tester optimization and shows whether the best pass sits on a plateau, where nearby inputs give similar results, or on a lone spike that a small change destroys. It draws a heat map of any two inputs, compares every pass with its neighbours, shows how each input moves the result and, when a forward period was tested, how well the back test predicted it. Everything is written to one HTML page. How To Use In the Strategy Tester, after an
FREE
Trade History to Excel turns saved Strategy Tester reports, or the trading history of your account, into a real Excel workbook (.xlsx). Every report goes into the same file: one summary row per report, every closed trade with its entry and exit price, every deal, and the results of each day and month with the balance. Dates are Excel dates, numbers are numbers, the header row is frozen and every sheet has filters, so you can sort, filter, build pivot tables and charts right away. How To Use Back
FREE
Monte Carlo Risk Simulator shows how much worse a backtest could have gone with the same trades in a different order, and what more or less risk per trade does to its growth and drawdown. It reads saved Strategy Tester reports or the history of your account, runs thousands of simulations and writes one HTML page. How To Use Backtests: in the Strategy Tester, right click on the Backtest tab > Report > save it as HTML into MQL5\Files\RiskSimulator (File > Open Data Folder). Account: set "Trades to
FREE
フィルタ:
レビューなし
レビューに返信