Backtest vs Live

  • Utilità
  • Mohamed-amine Baddir
    Mohamed-amine Baddir
    Sviluppo Expert Advisor per MetaTrader 5 e li testo correttamente prima che tu li utilizzi per fare trading.
    Cosa faccio:
    - Trasformo la tua strategia, il tuo script TradingView o le tue regole scritte in un Expert Advisor MT5 pulito
  • Versione: 1.0
  • Attivazioni: 5

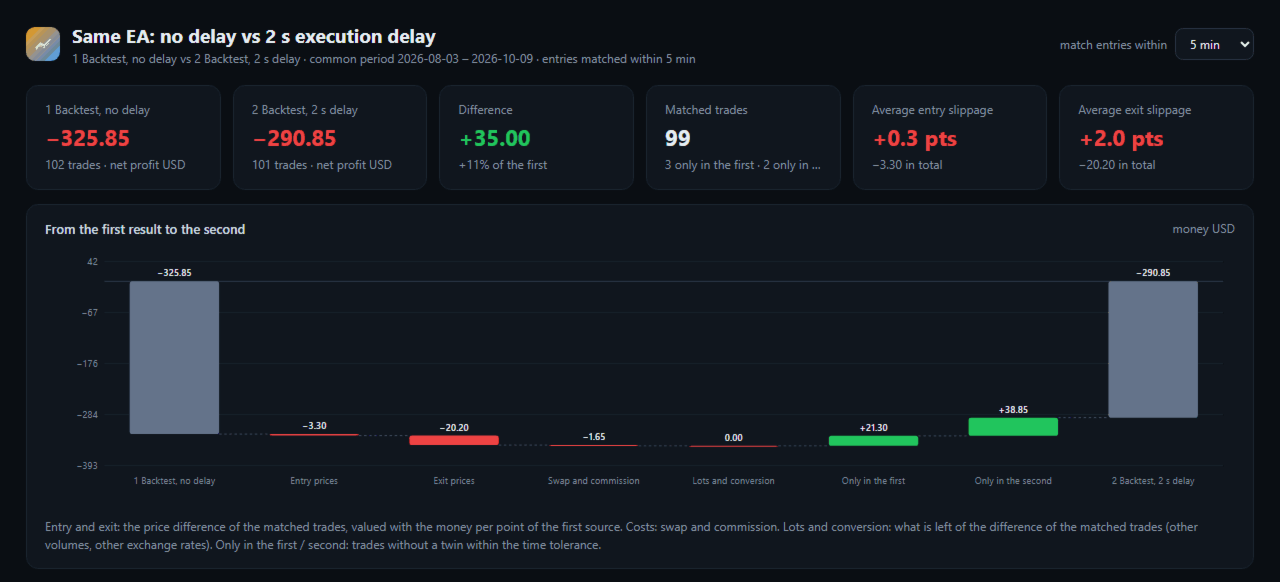
Backtest vs Live explains why an Expert Advisor earns a different amount live than in the Strategy Tester. It matches every live trade with its twin in the backtest, then splits the whole difference of the results, to the cent, into entry prices, exit prices, swap and commission, lots and currency conversion, trades the backtest made that live trading missed, and live trades the backtest never made. It can also compare two backtests, for example the same Expert Advisor with and without execution delay, or two brokers.

How To Use

  • Test the Expert Advisor in the Strategy Tester over the period it traded live, with the same symbol and settings. Right click on the Backtest tab > Report > save it as HTML into MQL5\Files\BacktestLive (File > Open Data Folder).
  • Attach Backtest vs Live to any chart of the account that traded live, and set the magic number of the Expert Advisor in the inputs.
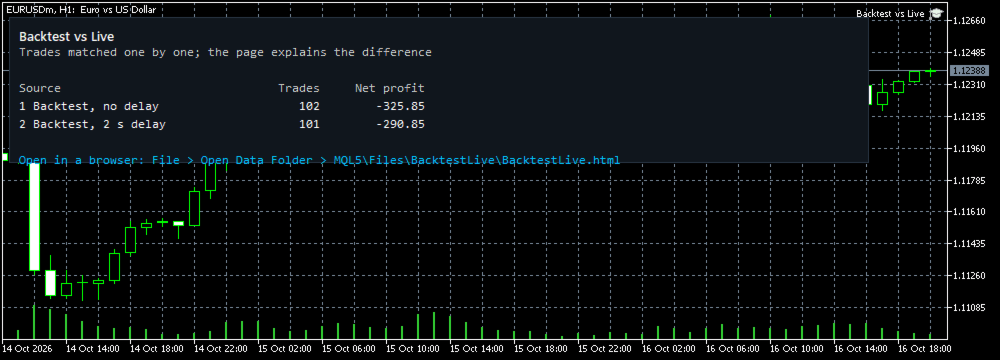
  • Open MQL5\Files\BacktestLive\BacktestLive.html in any browser. The time tolerance of the matching can be changed at the top of the page.
  • To compare two backtests instead, set "Compare the backtest with" to a second saved report.

What The Page Shows

  • Net profit of both sources over their common period, the difference, and the number of matched trades.
  • A waterfall from the first result to the second: entry prices, exit prices, swap and commission, lots and conversion, trades only in the first source, trades only in the second. The steps add up exactly, and the page checks it.
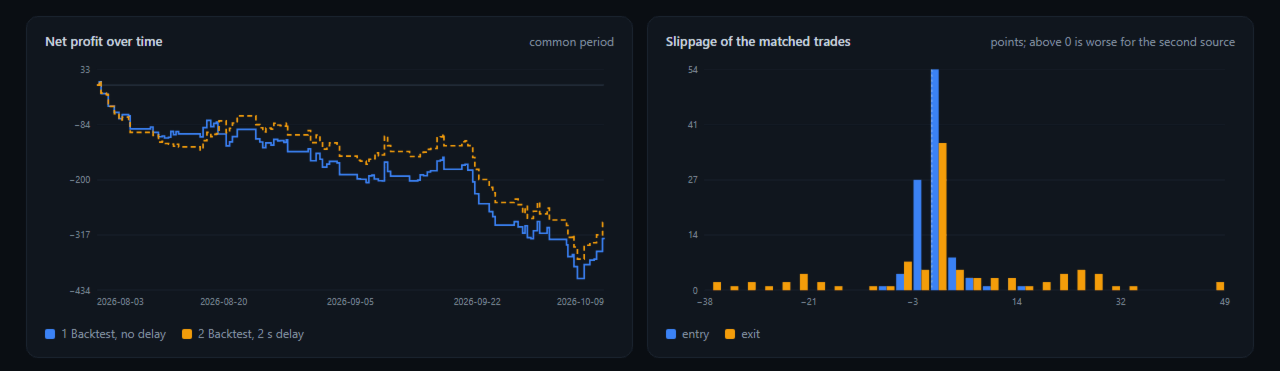
  • Both equity curves of closed trades on one chart.
  • The distribution of entry and exit slippage in points, and the average entry slippage by hour of the day.
  • Results and slippage by symbol.
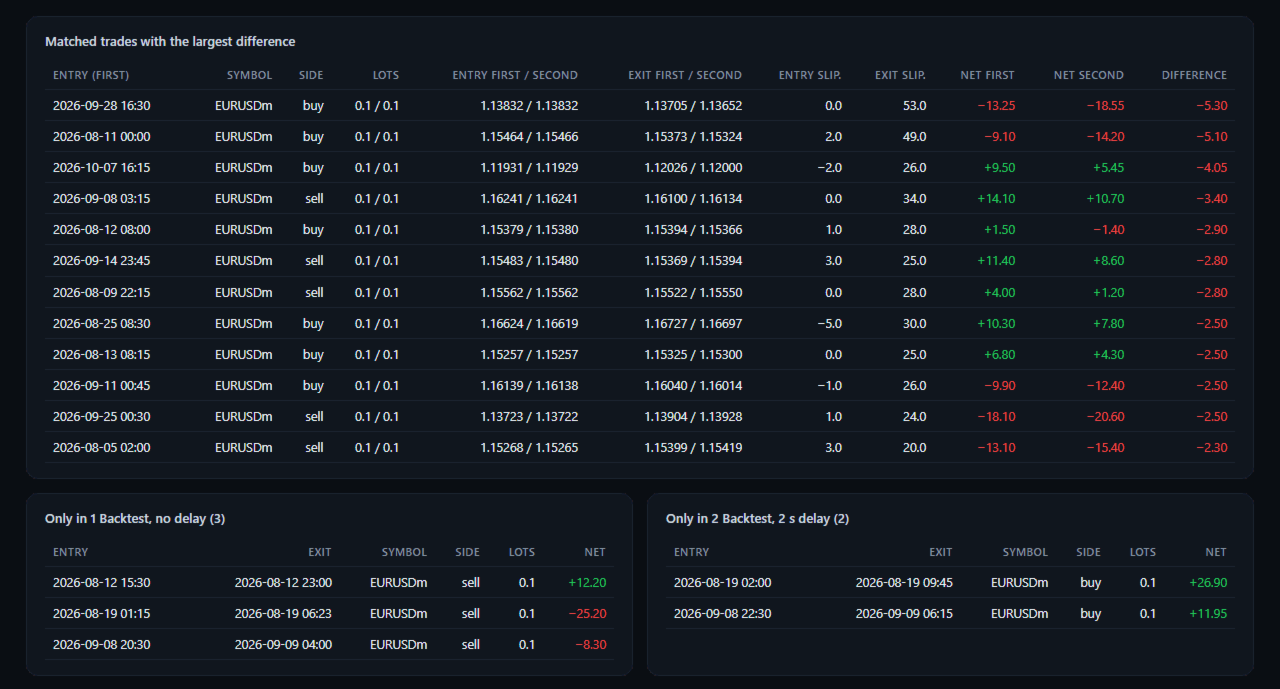
  • The matched trades with the largest difference, with both entry and exit prices, and the lists of trades without a twin.

Matching

  • A trade is matched with the nearest free trade of the other source with the same symbol and direction whose entry is within the tolerance (5 minutes by default).
  • Symbol names of different brokers are matched automatically when one starts with the other (EURUSD and EURUSDm), or by the symbol map input.
  • A time shift input corrects a different server time zone between the backtest and the live broker.
  • Trades closed in parts and reversals are matched with their entries, oldest first, in reports; by position in the account history.

Inputs

  • Compare the backtest with: the history of this account, or a second saved report
  • Folder in MQL5\Files with the saved reports; the backtest report and the second report (empty = the first and second reports of the folder)
  • Account history: magic number, symbol
  • Match entries within (minutes)
  • Hours added to the times of the second source
  • Symbol names, backtest=second (e.g. XAUUSD=GOLD)
  • Folder in the common Files folder of all terminals
  • Page title

Good To Know

  • Slippage is valued with the money per point of each backtest trade, so the entry and exit steps are in the account currency of the backtest.
  • The demo runs in the Strategy Tester and compares two reports: put two saved reports into the common folder Files\BacktestLive (File > Open Common Data Folder); the page is written when the test ends.
  • The screenshots compare two tests of an example Expert Advisor on EURUSD, one with a 2 second execution delay. They show the page, not trading results to expect.
  • The utility reads files and history only. It does not trade and does not change any setting.
Altri dall’autore
Account Performance Report turns the history of your account into one HTML report that you open in any browser: balance and drawdown, the result of each Expert Advisor and each symbol, a daily P&L calendar, monthly returns and the usual statistics. The main figures are also shown on the chart, and the report is kept up to date while the terminal runs. How To Use Attach Account Performance Report to any chart of the account. It does not trade, so any symbol and timeframe will do. The report is wr
FREE
Prop Risk Guard
Mohamed-amine Baddir
Prop Risk Guard applica automaticamente le regole di gestione del rischio del tuo conto. Basta aggiungerlo a un grafico e monitorerà tutte le posizioni del conto. Quando viene raggiunto un limite, chiude le posizioni, elimina gli ordini pendenti e blocca il trading, impedendo che una singola operazione in perdita o un EA fuori controllo violino le regole del conto di valutazione o del conto finanziato. Limite di perdita giornaliera Configurabile in percentuale, con un importo fisso oppure con en
The Strategy Tester runs one Expert Advisor at a time. If you run several EAs on one account, their separate reports do not tell you the combined drawdown, the margin they need together, or whether the account can carry them at all. Portfolio Backtest Combiner answers that from the reports you already have. How It Works Backtest each Expert Advisor as usual and save the report as HTML (Strategy Tester > Backtest tab > right click > Report > save as HTML) into the MQL5\Files folder of the termina
Backtest Report Compare
Mohamed-amine Baddir
Backtest Report Compare puts several Strategy Tester reports side by side on one HTML page: growth and drawdown curves on one chart, the main statistics in one table, the correlation of their daily results, monthly returns and results by weekday and hour. Use it to choose between Expert Advisors, between settings of one Expert Advisor, or to see which strategies lose on the same days. How To Use In the Strategy Tester, after each test: right click on the Backtest tab > Report > save it as HTML i
FREE
Trade Excursion Analyzer measures how far every closed trade went against you (maximum adverse excursion, MAE) and in your favour (maximum favorable excursion, MFE) before it closed. It reads saved Strategy Tester reports or the history of your account, measures each trade on the price history of your terminal and writes one HTML page: where your stop-loss could be, how much open profit your exits give back, and what a fixed stop-loss or take-profit would have changed. How To Use Backtests: in t
Optimization Robustness Map reads the results of a Strategy Tester optimization and shows whether the best pass sits on a plateau, where nearby inputs give similar results, or on a lone spike that a small change destroys. It draws a heat map of any two inputs, compares every pass with its neighbours, shows how each input moves the result and, when a forward period was tested, how well the back test predicted it. Everything is written to one HTML page. How To Use In the Strategy Tester, after an
FREE
Trade History to Excel
Mohamed-amine Baddir
Trade History to Excel turns saved Strategy Tester reports, or the trading history of your account, into a real Excel workbook (.xlsx). Every report goes into the same file: one summary row per report, every closed trade with its entry and exit price, every deal, and the results of each day and month with the balance. Dates are Excel dates, numbers are numbers, the header row is frozen and every sheet has filters, so you can sort, filter, build pivot tables and charts right away. How To Use Back
FREE
Monte Carlo Risk Simulator shows how much worse a backtest could have gone with the same trades in a different order, and what more or less risk per trade does to its growth and drawdown. It reads saved Strategy Tester reports or the history of your account, runs thousands of simulations and writes one HTML page. How To Use Backtests: in the Strategy Tester, right click on the Backtest tab > Report > save it as HTML into MQL5\Files\RiskSimulator (File > Open Data Folder). Account: set "Trades to
FREE
Filtro:
Nessuna recensione
Rispondi alla recensione