Backtest Report Compare
- ユーティリティ
-
Mohamed-amine Baddir
 MetaTrader 5向けのExpert Advisor(EA)を開発し、実際に取引で使用する前に十分なテストを行います。
対応内容:
お客様のトレード戦略、TradingViewスクリプト、または文章化されたルールを、クリーンなMT5 Expert Advisorに変換
既存EAの修正・バグ修正:リスク%によるロットサイズ計算、トレーリングストップ、セッション・時間フィルター、スプレッドフィルター、複数銘柄ポートフォリオ、ドローダウン保護 - バージョン: 1.0
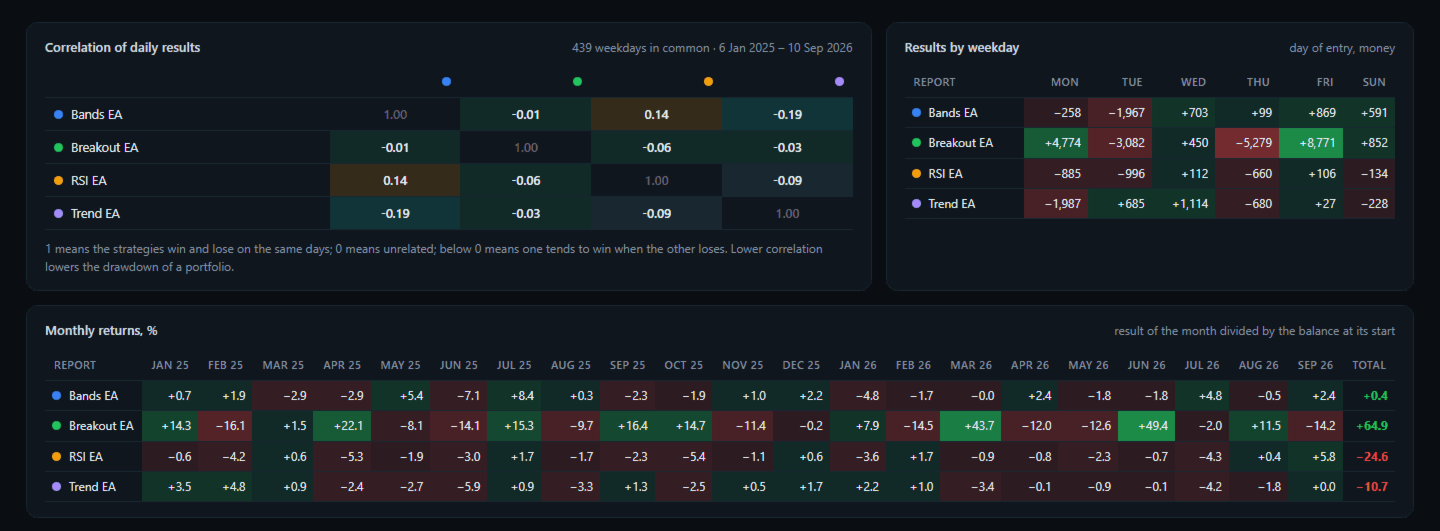
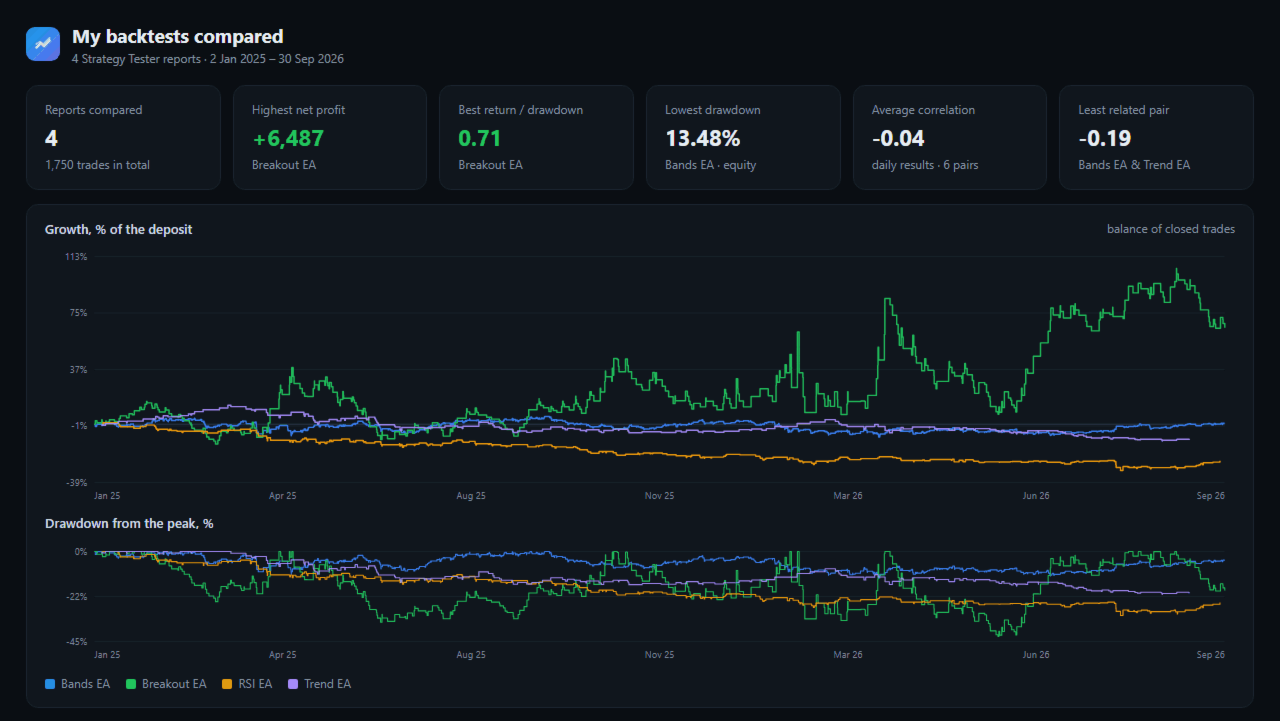
Backtest Report Compare puts several Strategy Tester reports side by side on one HTML page: growth and drawdown curves on one chart, the main statistics in one table, the correlation of their daily results, monthly returns and results by weekday and hour. Use it to choose between Expert Advisors, between settings of one Expert Advisor, or to see which strategies lose on the same days.
How To Use
- In the Strategy Tester, after each test: right click on the Backtest tab > Report > save it as HTML into MQL5\Files\ReportCompare (File > Open Data Folder). The file name is the name shown in the comparison.
- Attach Backtest Report Compare to any chart. It reads every report of the folder.
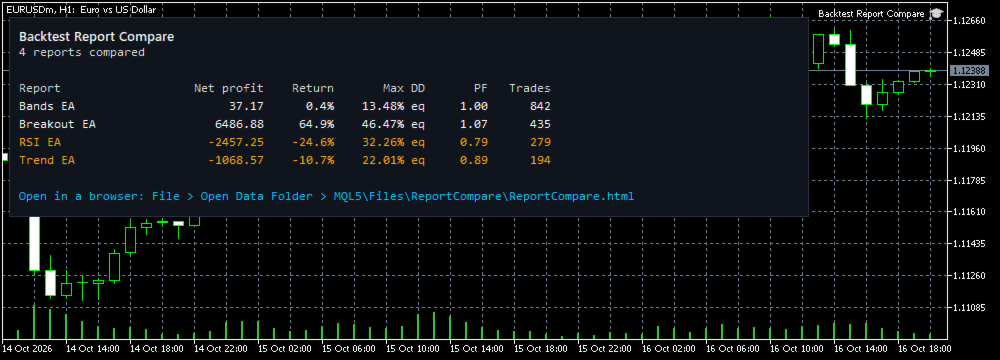
- Open MQL5\Files\ReportCompare\ReportCompare.html in any browser. The main figures are also shown on the chart.
What The Page Shows
- Growth of each test in percent of its deposit, and the drawdown from the peak, on one chart.
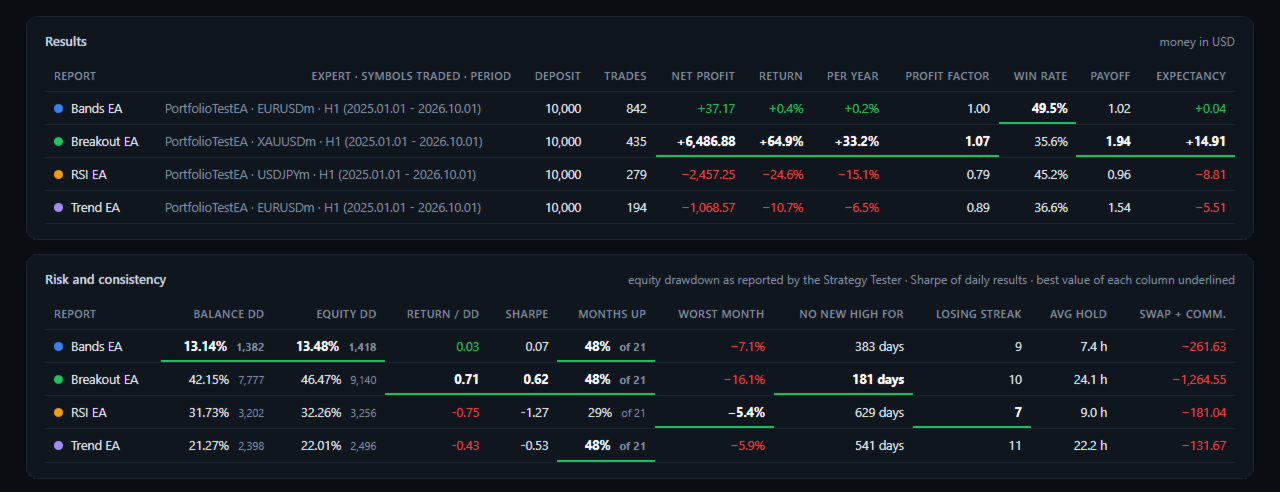
- Results: trades, net profit, return, return per year, profit factor, win rate, payoff ratio, expectancy.
- Risk and consistency: balance drawdown, equity drawdown (as reported by the Strategy Tester), return / drawdown, Sharpe ratio of daily results, share of profitable months, worst month, longest time without a new high, longest losing streak, average holding time, swap and commission.
- The best value of each column is underlined.
- Correlation of daily results between every pair of tests, over the period they have in common.
- Monthly returns of every test, month by month.
- Results by weekday and by hour of entry.
Checks
- The deals of every report are added up and compared with its final balance; the result is printed at the bottom of the page.
- Trades closed in parts and reversals are matched with their entries, oldest first.
- Files that are not Strategy Tester reports are listed as not compared.
- The screenshots compare four tests of example strategies (EURUSD, USDJPY, XAUUSD, 21 months). They show the page, not trading results to expect.
Inputs
- Folder in MQL5\Files with the saved reports
- Or the report files, separated by ; (empty = every report of the folder)
- Folder in the common Files folder of all terminals
- Page title
Good To Know
- Up to 12 reports are compared at once.
- The symbols of the reports do not need to exist in your terminal; only the report files are read.
- The page is one file with no internet access needed.
- In the Strategy Tester the reports are read from the common Files folder (Files\ReportCompare) when the test ends.
- The utility reads files only. It does not trade and does not change any setting.
- To run several of these tests together on one account, with shared margin and stop-out, see Portfolio Backtest Combiner by the same author.