Smart Continuity CRT
- インディケータ
- バージョン: 62.4
- アクティベーション: 5

Professional Continuity, CRT & Smart Money Concepts Indicator
This indicator was developed for traders who need a clearer, more structured, and more professional way to read the market. Its main objective is to help identify continuity zones, structural shifts, relevant CRT setups, and institutional points of interest by integrating advanced price action analysis and Smart Money Concepts into one powerful tool.
Unlike traditional indicators, this tool does not simply display isolated signals. Its focus is to provide operational context: the probable direction of the market, areas where price may seek liquidity, pending objectives, continuity structures, and opportunities aligned with higher timeframes.
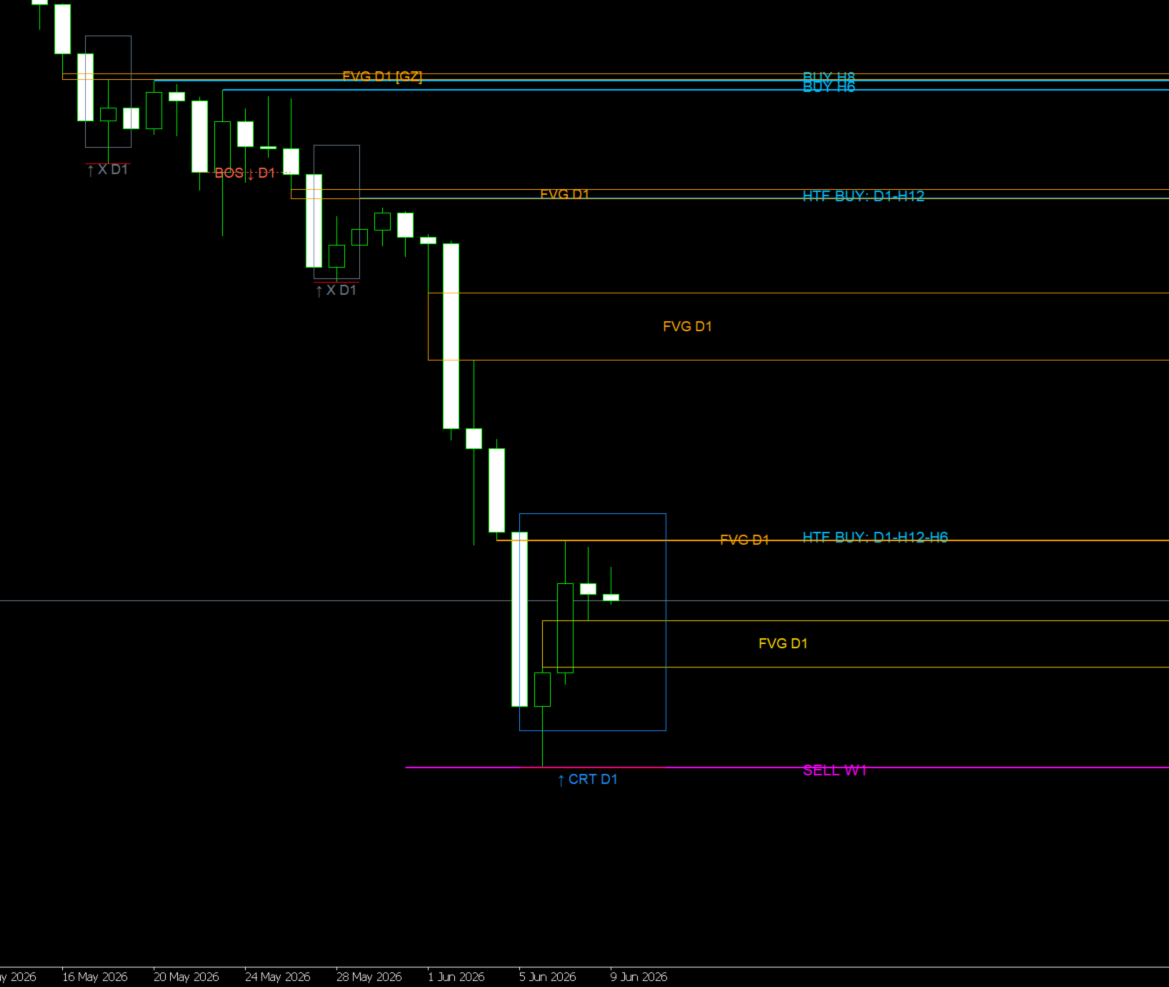
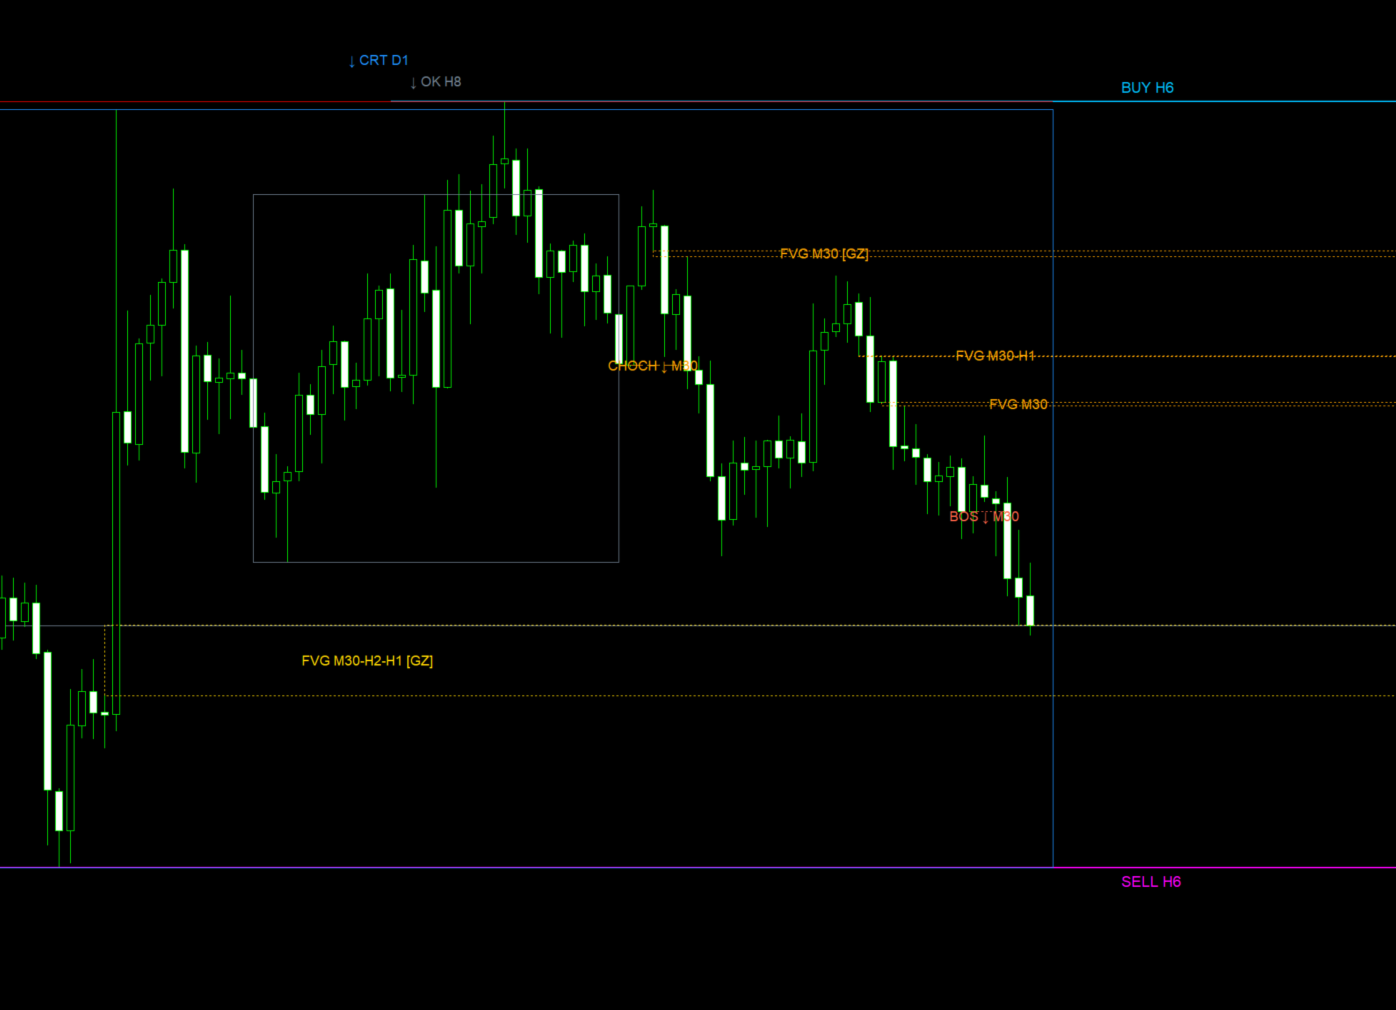
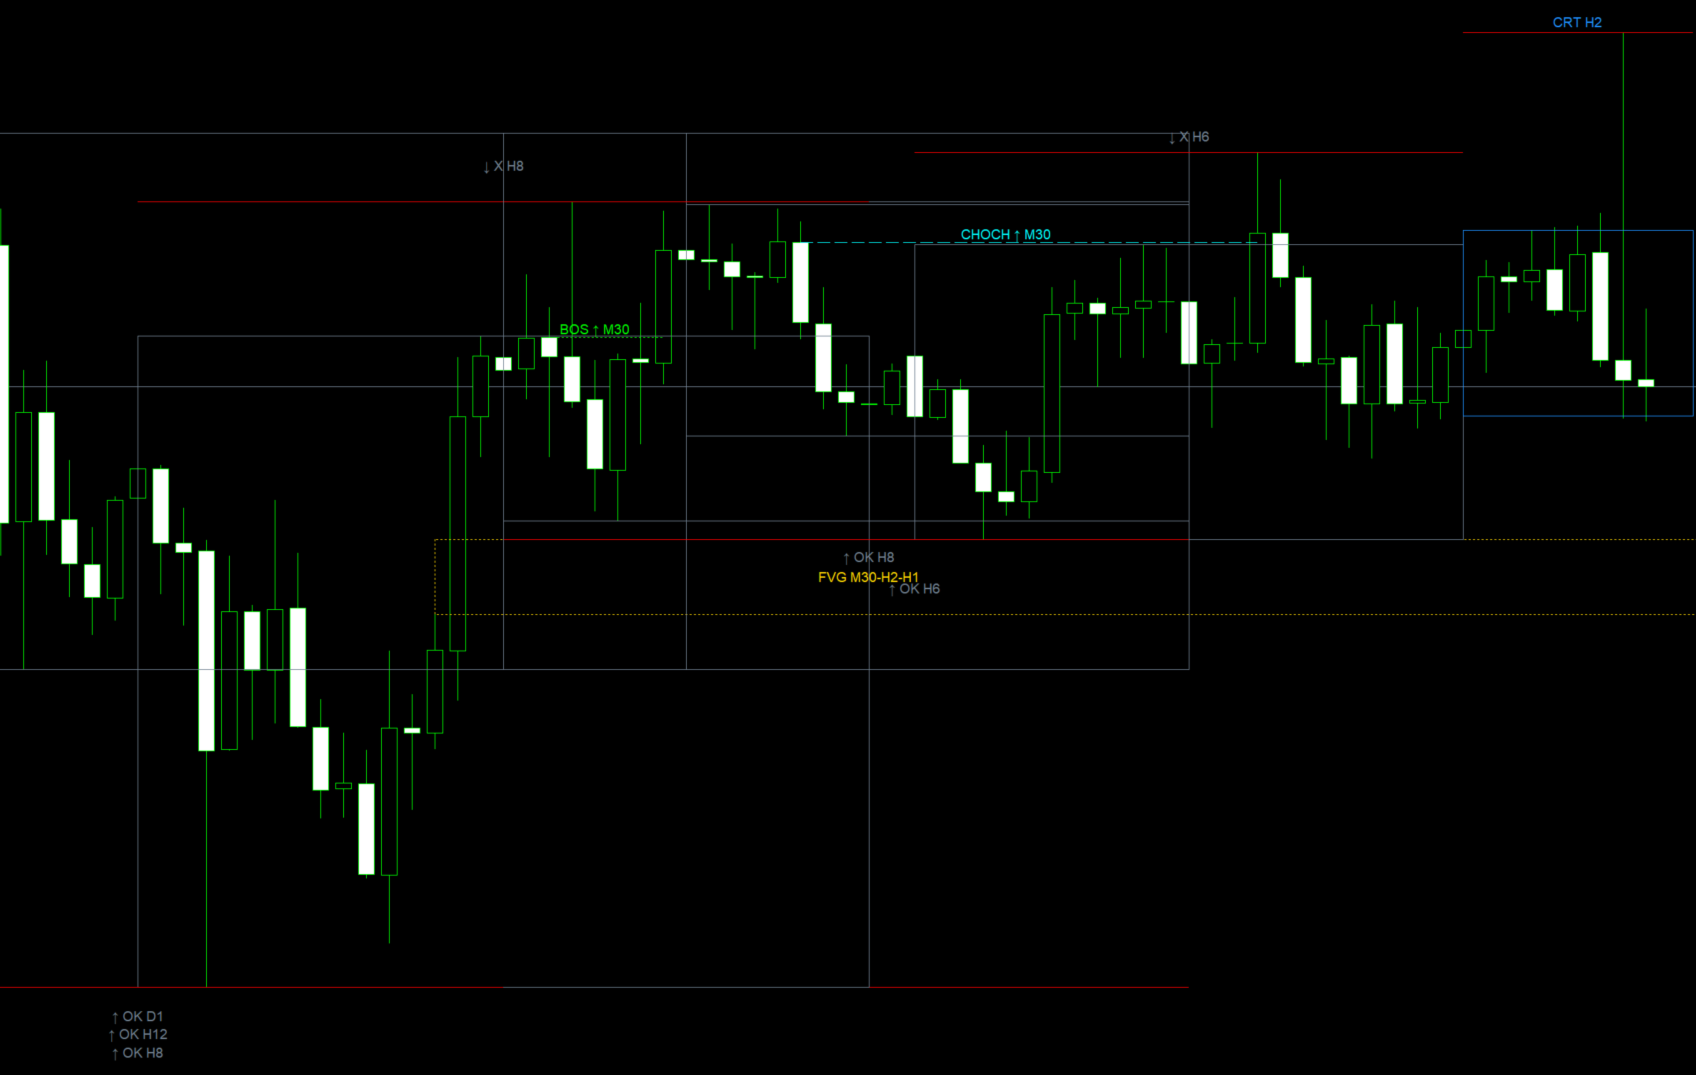
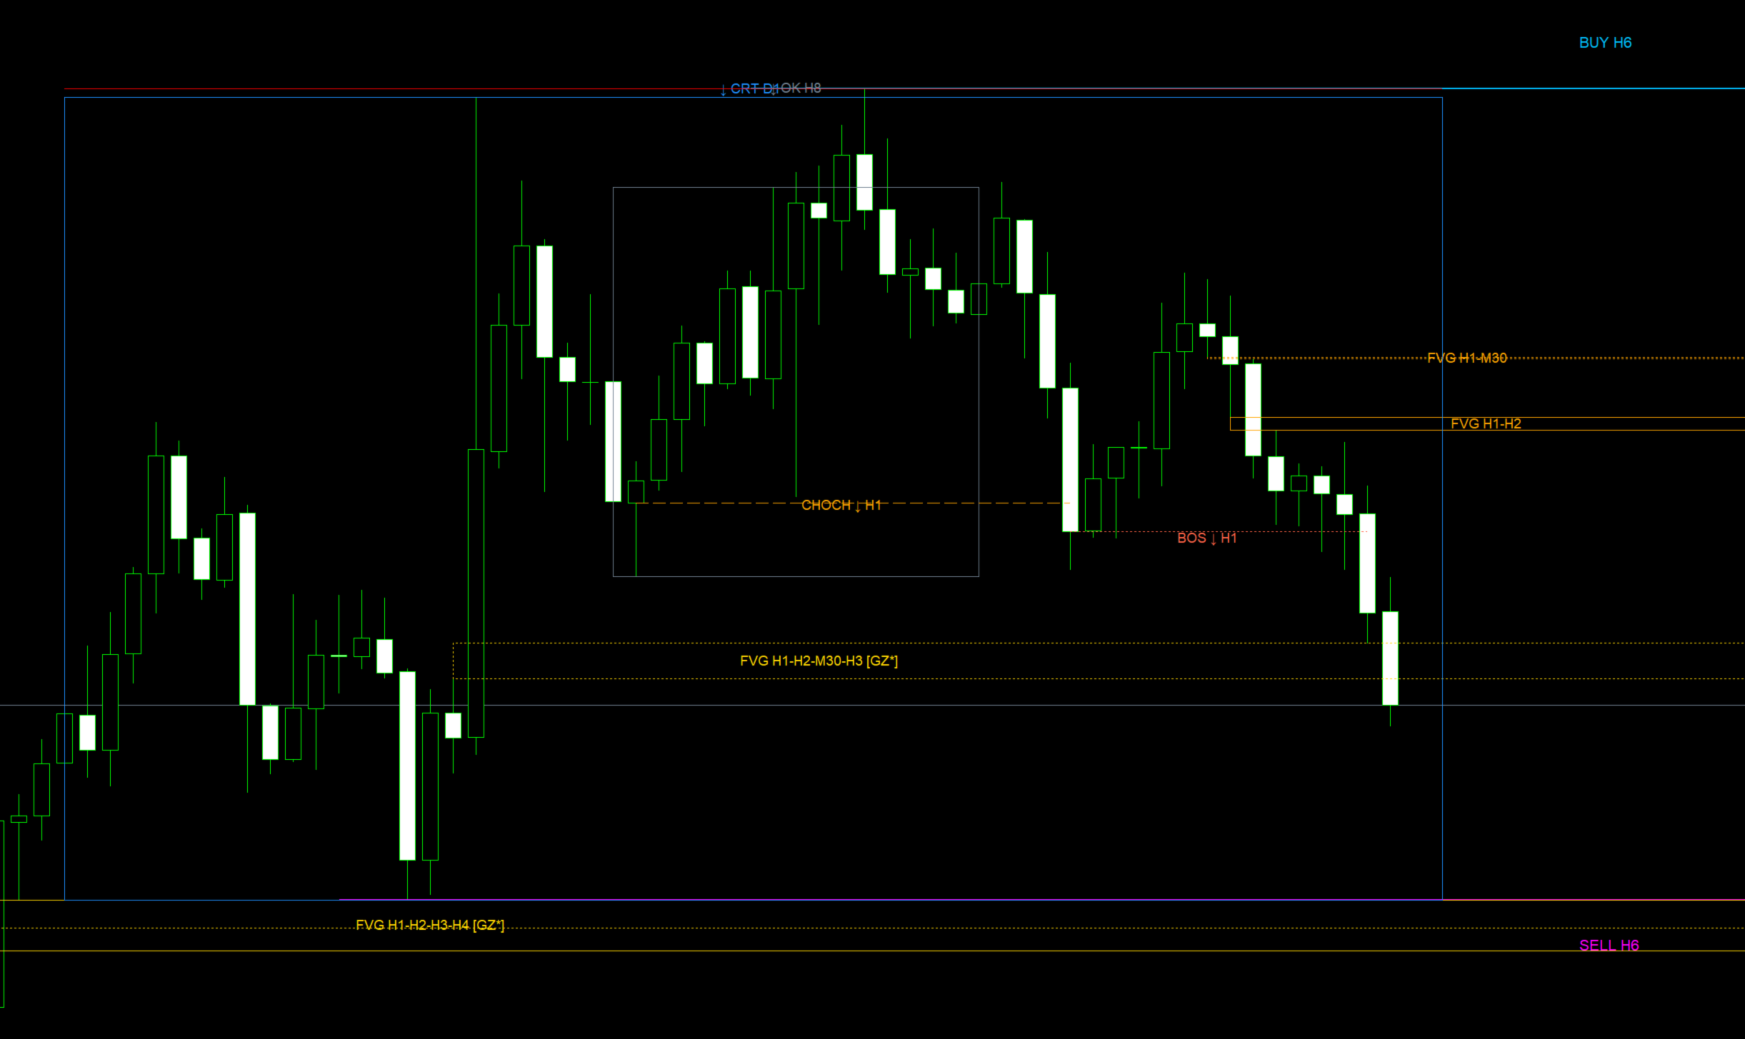
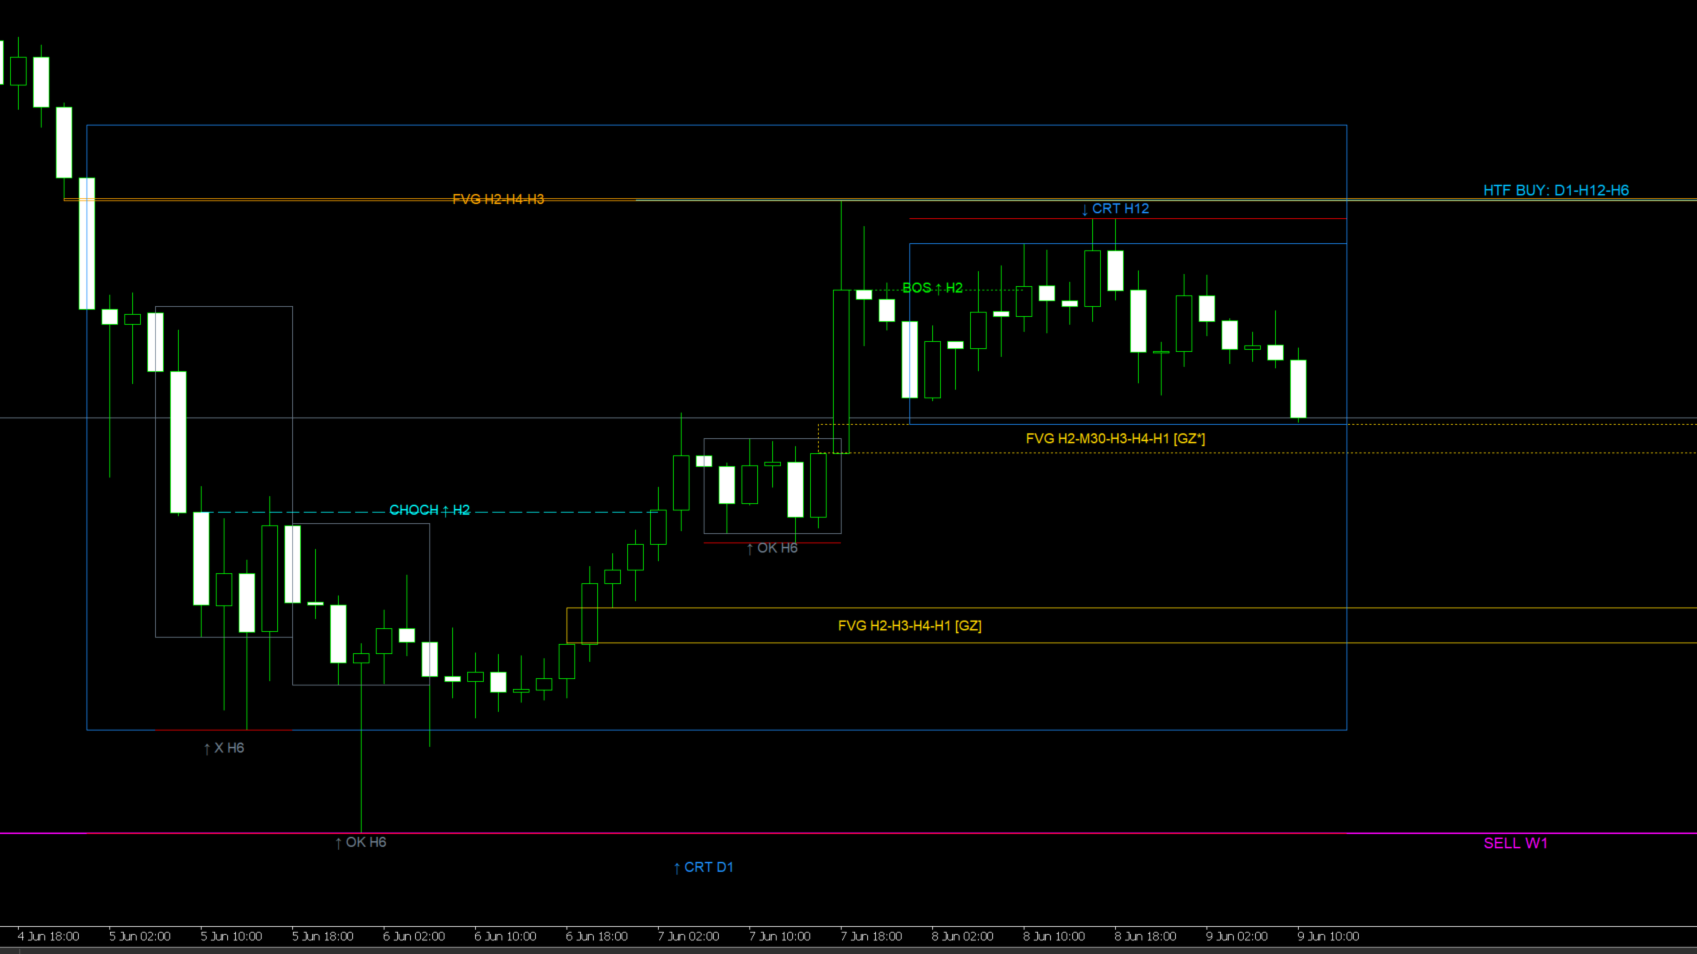
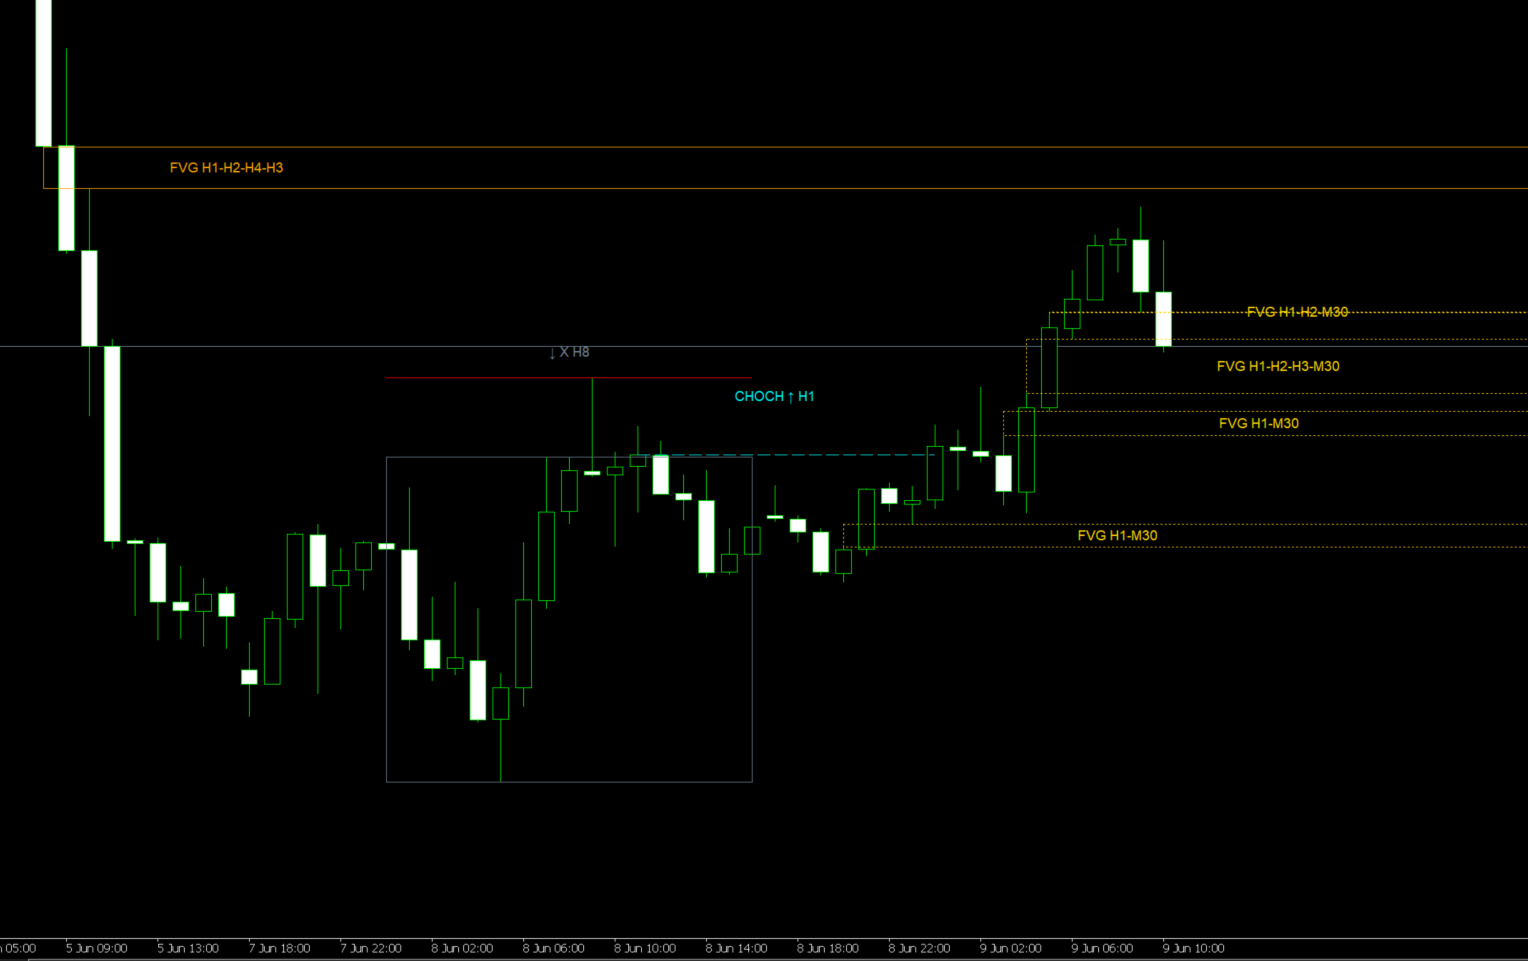
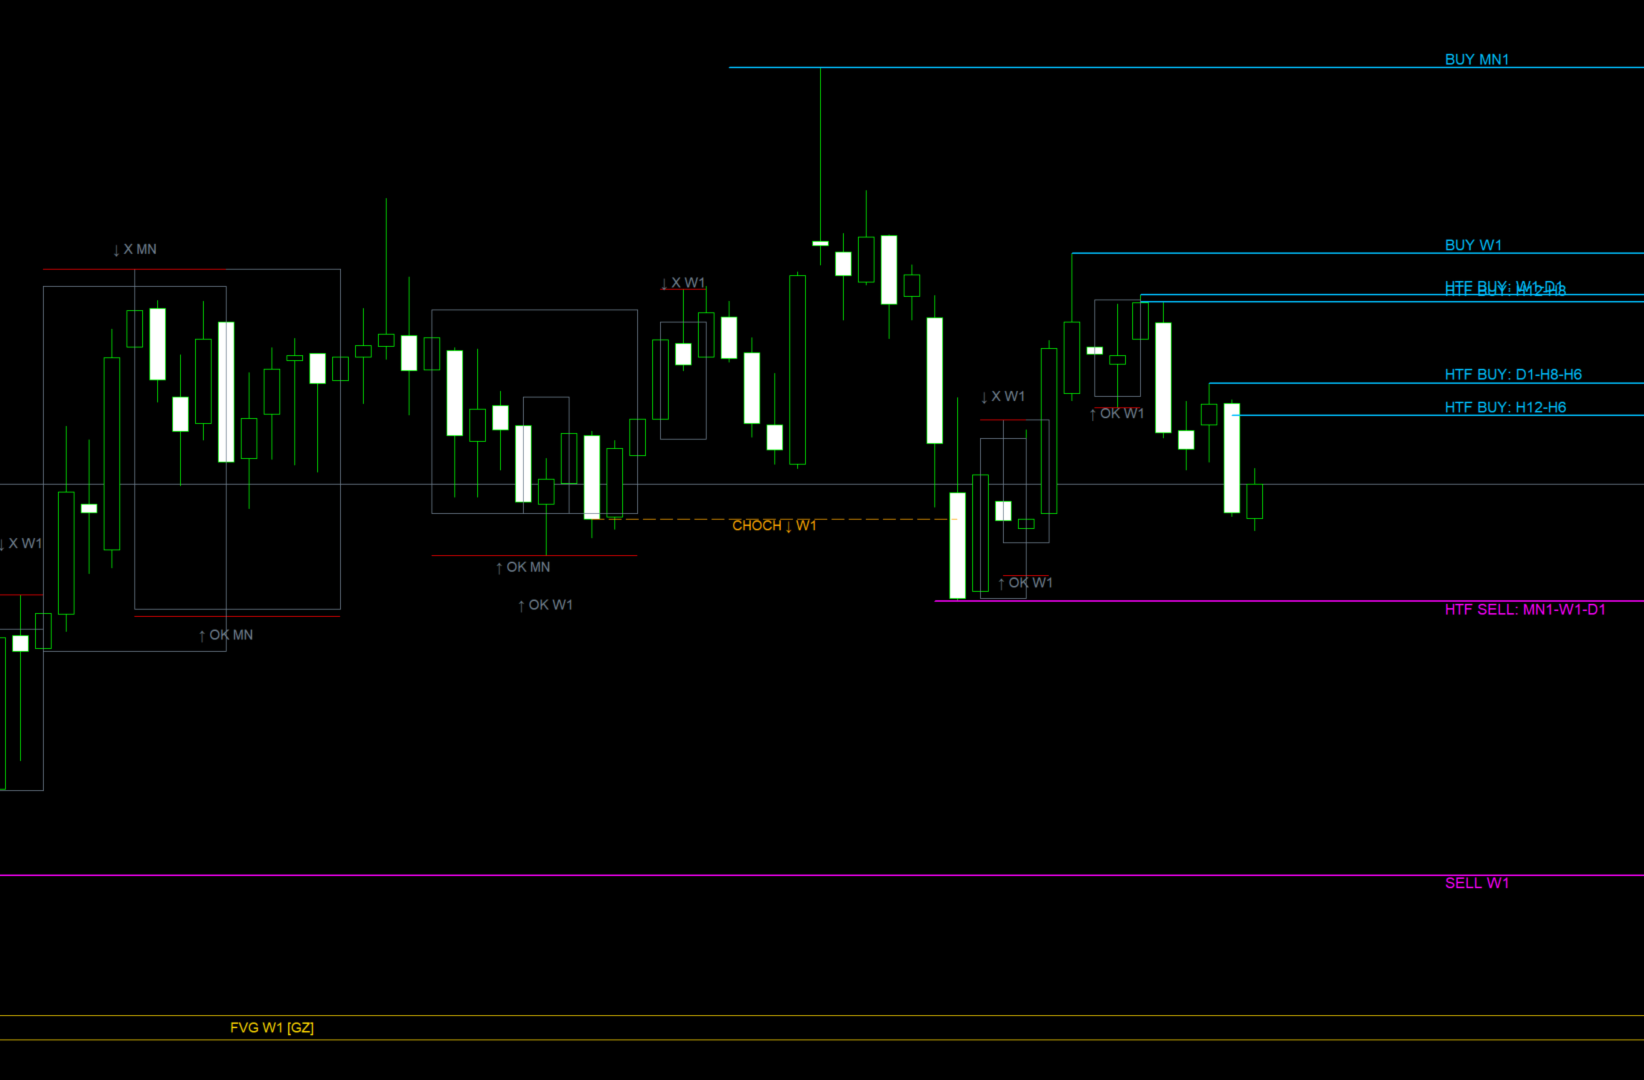
The system works with multi-timeframe analysis, allowing traders to observe key information from higher and lower timeframes such as Monthly, Weekly, Daily, H12, H8, H6, H4, H2, H1, and M30. This makes it easier to understand whether the market is aligned in one main direction or if there are conflicting zones, overlaps, or potential shifts in market intention.
Its main features include:
Detection of HTF buy and sell zones, allowing traders to visualize relevant price objectives from higher timeframes.
Identification of CRT structures, integrated with Smart Money Concepts logic, to detect potential reaction, continuation, or reversal zones in the market.
Marking of FVG and imbalance zones, including confluences between different timeframes and key areas of operational interest.
Detection of BOS and CHOCH, helping traders recognize structural breaks, relevant market shifts, and early signs of potential directional change.
Multi-timeframe overlap reading, showing when several timeframes are pointing in the same direction. This allows traders to better filter trades and avoid isolated entries without context.
Visualization of executed CRT setups, active CRT structures, and relevant patterns within an operation, making it easier to audit how price behaves during the development of a trade.
Visual cleanup system using bar limits or date filters, preventing the chart from becoming overloaded with old or irrelevant information.
Organized labels and key levels to maintain a cleaner chart reading, especially when multiple CRT structures or aligned zones appear in the same area.
This indicator is designed for traders who do not want to operate based only on intuition, but with a more structured market reading. It helps visualize where price is located, where it may be seeking liquidity, which timeframes are aligned, and which zones may act as decision points.
Its greatest value lies in combining institutional context, price continuity, CRT, FVG, BOS, CHOCH, and multi-timeframe analysis into one visual tool. This helps reduce noise, improve market interpretation, and support more organized decision-making.
It is ideal for traders operating Forex, indices, metals, or cryptocurrencies who are looking for a more advanced methodology based on structure, liquidity, continuity, and Smart Money Concepts.
The indicator does not replace risk management or the trader’s experience, but it provides an important visual edge: it helps identify relevant zones, active structures, and scenarios with stronger operational coherence.