Liquidity Setup PRO V1

  • インディケータ
  • Qiyas Baghirov
    Qiyas Baghirov
    3.6 (3)
    アルゴリズム取引・エキスパートアドバイザー(EA)開発者
    私は、MetaTraderプラットフォーム向けのアルゴリズム取引システムおよびエキスパートアドバイザー(EA)の開発を専門とする開発者です。
    私の開発は、リスクを適切に管理した戦略を中心とし、ドローダウン管理、資産(エクイティ)の保護、そして実際の市場環境に適したシステムの構築を重視しています。
    EAは主にリアル口座およびセント口座で開発・検証を行い、過度な最適化や現実離れした利益の約束は行いません。
  • バージョン: 1.0
  • アクティベーション: 12

1. Liquidity Setup PRO V1とは?

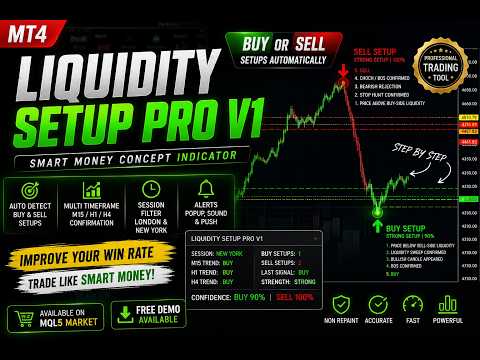
Liquidity Setup PRO V1 は、Smart Money Concept(SMC)に基づいて開発された MT4 用インジケーターです。

このインジケーターは、liquidity sweep、stop hunt、BOS(Break of Structure)、CHOCH をステップごとに自動検出し、チャート上に表示します。

以下のトレーダー向けに設計されています:

  • Smart Money トレーダー

  • Liquidity Sweep 戦略

  • BOS / CHOCH トレード

  • 機関投資家スタイルのトレード

  • スキャルピング・デイトレード

2. 主な機能

BUY / SELL Setup 自動検出

BUY Setup

  1. 価格が sell-side liquidity の下へ移動

  2. Liquidity sweep 確認

  3. 強い bullish candle 出現

  4. BOS 確認

  5. BUY シグナル

SELL Setup

  1. 価格が buy-side liquidity の上へ移動

  2. Stop hunt 確認

  3. 強い bearish rejection candle 出現

  4. CHOCH / BOS 確認

  5. SELL シグナル

3. Dashboard(情報パネル)

Dashboard には以下が表示されます:

  • 現在のセッション

  • M15 トレンド

  • H1 トレンド

  • H4 トレンド

  • BUY setup 数

  • SELL setup 数

  • 最新シグナル

  • Setup 強度

  • Confidence Score

4. Confidence Score

インジケーターはシグナル品質を自動計算します。

Setup タイプ

  • STRONG SETUP

  • MEDIUM SETUP

  • WEAK SETUP

スコア計算要素:

  • liquidity sweep の強さ

  • candle strength

  • BOS strength

  • session quality

  • multi timeframe confirmation

例:
BUY 90%
SELL 78%

数値が高いほど、setup の信頼性が高くなります。

5. Multi Timeframe Confirmation(MTF)

以下の時間足を分析します:

  • M15

  • H1

  • H4

EMA によるトレンド確認を使用します。

例:

  • M15 BUY

  • H1 BUY

  • H4 BUY

これにより setup の精度が向上します。

6. Session Filter

トレードセッションに基づき setup をフィルターできます。

対応セッション:

  • London Session

  • New York Session

弱いシグナルを減らすため、Asian Session を除外可能です。

7. Dashboard ボタン

チャート下部に ON/OFF ボタンがあります。

Score ON/OFF

Confidence score の表示切替。

MTF ON/OFF

Multi timeframe confirmation の切替。

Session ON/OFF

Session filter の切替。

Strength ON/OFF

Strong / Medium / Weak setup の表示切替。

Dash ON/OFF

Dashboard の表示切替。

Alerts ON/OFF

アラート機能の切替。

Steps ON/OFF

ステップラベル表示の切替。

8. アラート

対応機能:

  • Popup alerts

  • Sound alerts

  • Push notifications

例:
BUY STRONG SETUP 92% on XAUUSD M15

9. 推奨設定

XAUUSD M15

  • LiquidityTolerancePts = 30

  • BOSLookbackBars = 5

  • StrongCandleBodyRatio = 0.35

  • MaxVisibleSetups = 3

EURUSD M15/H1

  • LiquidityTolerancePts = 10

  • BOSLookbackBars = 6

  • StrongCandleBodyRatio = 0.35

GBPUSD M15/H1

  • LiquidityTolerancePts = 15

  • BOSLookbackBars = 6

USDJPY M15/H1

  • LiquidityTolerancePts = 10

  • BOSLookbackBars = 6

10. 推奨時間足

推奨:

  • M15

  • M30

  • H1

スキャルピング:

  • M1

  • M5

高い時間足ほど、強いシグナルが生成されます。

11. トレードのヒント
  • 市場構造に従ってトレードしてください。

  • 強い setup は London / New York Session に多く現れます。

  • MTF confirmation を使用すると精度が向上します。

  • 低ボラティリティ時の取引は避けてください。

  • 適切なリスク管理を行ってください。

12. 重要事項

このインジケーターは補助ツールであり、利益を保証するものではありません。

必ず:

  • デモ口座でテストする

  • ストップロスを使用する

  • リスク管理を行う

13. 作者

作者:
Qiyas Baghirov

製品:
Liquidity Setup PRO V1 for MetaTrader 4

おすすめのプロダクト
インディケータは現在のクオートを作成し、これを過去のものと比較して、これに基づいて価格変動予測を行います。インジケータには、目的の日付にすばやく移動するためのテキスト フィールドがあります。 オプション: シンボル - インジケーターが表示するシンボルの選択; SymbolPeriod - 指標がデータを取る期間の選択; IndicatorColor - インジケータの色; HorisontalShift - 指定されたバー数だけインディケータによって描画されたクオートのシフト; Inverse - true は引用符を逆にします。false - 元のビュー。 ChartVerticalShiftStep - チャートを垂直方向にシフトします (キーボードの上下矢印)。 次は日付を入力できるテキストフィールドの設定で、「Enter」を押すとすぐにジャンプできます。
Antabod Gamechanger
Rev Anthony Olusegun Aboderin
*Antabod GameChanger Indicator – Transform Your Trading!*   Are you tired of chasing trends too late or second-guessing your trades? The *Antabod GameChanger Indicator* is here to *revolutionize your trading strategy* and give you the edge you need in the markets!   Why Choose GameChanger? *Accurate Trend Detection* – GameChanger identifies trend reversals with *pinpoint accuracy*, ensuring you enter and exit trades at the optimal time.   *Clear Buy & Sell Signals* – No more guesswork! T
Money Flow Profile MT5 HERE   Here   our more valuable tools SMC Trend Trading   ,  Easy SMC Trading  ,  Institutional SMC Architect Volume Analysis Tools  ,  Volume flow Profile  ,  Market volume profile  , FVG with Volume  , Liquidity Heatmap Profile  ,  Volume Spread Analysis This Master Edition is engineered for clarity and speed, featuring a unique Auto-Theme Sync system that instantly beautifies your chart layout upon loading. Key Features: True Money Flow Calculation: Goes beyond stand
Volume Profile Sniper v11.1は、包括的な市場分析ツールです 取引への専門的なアプローチ ボリュームプロファイルスナイパー v11.1は、市場状況の包括的な評価に基づいて明確な信号を提供し、一つの指標に15以上の主要なフィルタを組み合わせ 主な特長 ボリューム不均衡分析-アルゴリズムは、各キャンドルの買い手と売り手のシェアを計算し、当事者の1つの優位性を通知します(50%から90%までの設定可能なしきい値)。 マルチレベル信号フィルタリング-インジケータは考慮されます: トレンド指標(9/21) 買われ過ぎ/売られ過ぎゾーンを除くRSI キャンドルパターン(ピンバー、吸収、ハンマー) サポート/抵抗レベル(自動検出) 主要なプレーヤーの活動を識別するためのボリュームスパイク クラシックと増幅されたRSIの相違 ボラティリティ評価のためのATR 傾向の強さを決定するためのADX 価格アクション(内部バーと外部バー) 複数の時間枠の確認 市場構造(高値/安値) セッションフィルタ(アジア、ロンドン、ニューヨークセッション) ニュースの
Introduction It is common practice for professional trades to hide their stop loss / take profit from their brokers. Either from keeping their strategy to the themselves or from the fear that their broker works against them. Using this indicator, the stop loss / take profit points will be drawn on the product chart using the bid price. So, you can see exactly when the price is hit and close it manually.  Usage Once attached to the chart, the indicator scans the open orders to attach lines for t
VR Cub
Vladimir Pastushak
VR Cub は、質の高いエントリーポイントを獲得するためのインジケーターです。このインジケーターは、数学的計算を容易にし、ポジションへのエントリーポイントの検索を簡素化するために開発されました。このインジケーターが作成されたトレーディング戦略は、長年にわたってその有効性が証明されてきました。取引戦略のシンプルさはその大きな利点であり、初心者のトレーダーでもうまく取引することができます。 VR Cub はポジション開始ポイントとテイクプロフィットとストップロスのターゲットレベルを計算し、効率と使いやすさを大幅に向上させます。取引の簡単なルールを理解するには、以下の戦略を使用した取引のスクリーンショットを見てください。 設定、設定ファイル、デモ版、説明書、問題解決方法は、以下から入手できます。 [ブログ] レビューを読んだり書いたりすることができます。 [リンク] のバージョン [MetaTrader 5] エントリーポイントの計算ルール ポジションをオープンする エントリーポイントを計算するには、VR Cub ツールを最後の高値から最後の安値までストレッチする必要があります。 最初
Market Structure Zig Zag
Lesedi Oliver Seilane
4.66 (29)
Free Market structure zig zag to assist in price action trading the screenshots describe how to use and how to spot patterns new version comes with alerts, email alert and  push notification alert can be used on all pairs  can be used on all timeframes  you can add additional confirmation indicators the indicator shows you your higher high and low highs as well as your lower lows and lower highs  the indication makes price action analysis easier to spot.
FREE
これは、キャンドルの終値を予測する指標です。 このインジケータは、主にD1チャートでの使用を目的としていますが. この指標は、従来の外国為替取引とバイナリオプション取引の両方に適しています。 インジケーターは、スタンドアロンのトレーディングシステムとして使用することも、既存のトレーディングシステムへの追加として機能させることもできます。 このインジケーターは、現在のキャンドルを分析し、キャンドル自体の内部の特定の強度係数と、前のキャンドルのパラメーターを計算します。 したがって、この指標は、市場の動きのさらなる方向性と現在のキャンドルの終値を予測します。 この方法のおかげで、この指標は、短期の日中取引だけでなく、中期および長期の取引にも適しています。 インジケーターを使用すると、市場の状況の分析中にインジケーターが生成する潜在的な信号の数を設定できます。 インジケーターの設定には、このための特別なパラメーターがあります。 また、インジケーターは、チャート上のメッセージの形式で、電子メールで、およびPUSH通知の形式で、新しい信号について通知することができます。 購入後は必ず私に書いて
El indicador "MR BEAST ALERTAS DE LIQUIDEZ" es una herramienta avanzada diseñada para proporcionar señales y alertas sobre la liquidez del mercado basándose en una serie de indicadores técnicos y análisis de tendencias. Ideal para traders que buscan oportunidades de trading en función de la dinámica de precios y los niveles de volatilidad, este indicador ofrece una visualización clara y detallada en la ventana del gráfico de MetaTrader. Características Principales: Canal ATR Adaptativo: Calcula
GTAS FidTdi is a trend indicator using combination of volatility and potential retracement levels. This indicator was created by Bernard Prats Desclaux, proprietary trader and ex-hedge fund manager, founder of E-Winvest. Description The indicator is represented as a red or green envelope above or under prices. How to use Trend detecting When the envelope is green, the trend is bullish. When it is red, the trend is bearish. Trading Once a trade is opened, GTAS FibTdi shows retracement zones wh
FREE
Smart Predictor — Continuous Market Forecasting with Intelligent Signals SmartPredictor  offers a fresh perspective on technical analysis. This indicator combines price data smoothing with advanced forecasting elements to create a seamless, continuous "past-present-future" view. No more guessing where the price might go — you can now see the most probable scenario plotted directly on your chart. Key Innovation: Zero Visual Lag Unlike standard averaging indicators such as moving averages that a
Gecko
Profalgo Limited
4.4 (10)
NEW PROMO: Only a few copies copies available at 349$ Next price: 449$ Make sure to check out our " Ultimate EA combo package " in our   promo blog ! Gecko runs a simple, yet very effective, proven strategy.  It looks for important recent high and lows and will trade the breakouts.  The actual execution of this strategy however, is what makes this EA truly shine.  Entry calculations and exit algorithms are not only unique but also very advanced. LIVE RESULTS: https://www.mql5.com/en/signals/75
VR Grid
Vladimir Pastushak
5 (3)
VR グリッド インジケーターは、ユーザー定義の設定を使用してグラフィカル グリッドを作成するように 設計 されています。 標準グリッド とは異なり、VR グリッドは 円形レベル を構築するために使用されます。ユーザーの選択に応じて、ラウンド レベル間のステップは任意に設定できます。さらに、他のインジケーターやユーティリティとは異なり、VR Grid は期間が変更されたり、端末が再起動されたりした場合でも、 グリッドの位置を維持 します。 設定、設定ファイル、デモ版、説明書、問題解決方法は、以下から入手できます。 [ブログ] レビューを読んだり書いたりすることができます。 [リンク] のバージョン [MetaTrader 5] 垂直レベル は実際の時間間隔に基づいており、 欠落している または存在しない期間は無視します。したがって、レベル間のステップは、ユーザーが選択した値に厳密に対応します。 VR グリッド インジケーターを使用すると、トレーダーは任意のレベルで 垂直線と水平線のスタイル 、色、太さを変更できます。これにより、金融商品の ラウンドレベル を制御できます。 ラウンド
FREE
M5 タイムフレームのロボット スカルパー。 GBPUSD 通貨ペアでの取引。このロボットは、英ポンドの取引のためにプロのトレーダーの会社によって特別に開発されました。ロボットは、毎日約 5 ~ 15 の取引を開始します。 GBPUSD のスプレッドが最大 10 ピップスまでの低いブローカーと取引するのが最善です。開始するための推奨最低入金額は $500 以上です。 利点: マーチンゲールは使いません。 ネットではありません。 すべての取引にはストップロスがあります。 GBPUSDペア専用のプロボット。 ロボットスキャルパー、M5 期間の日中取引。 このロボットはどのように取引しますか? 市場を分析するために、ロボットは 2 つの指標の価格モデルと戦略的な市場パターンを使用します: パラボリック ストップとリバース システムとボリンジャー バンド。ロボットは最初に、価格エントラポレーション統計を使用して価格の動きについて市場を分析します。次に、ロボットはこれらの指標を読み取り、現在と過去の動きの傾向を比較します。市場の反転またはロールバックを示すパターンが一致した場合、ロボットは取
Indicator Description: The Advanced Force Index combines volume and price to determine the strength  of the trend. It has been developed to provide an accurate measurement of  seller and buyer power in the market, with multiple smoothing and display options. Key Features: Two display modes: Colored Histogram (bicolor) or Solid Line 4 Moving Average methods: SMA, EMA, SMMA, LWMA 7 Price types: Close, Open, High, Low, Median, Typical, Weighted Both volume types supported: Tick Volum
FREE
A scalping indicator based on mathematical patterns, which on average gives signals with relatively small SL, and also occasionally helps to catch big moves in the markets (more information in the video) This indicator has three main types of notifications: The first type warns of a possible/upcoming signal on the next bar The second type indicates the presence of a ready signal to enter the market/open a position The third type is for SL and TP levels - you will be notified every time price re
"The trend is your friend" is one of the best known sayings in investing, because capturing large trendy price movements can be extremely profitable. However, trading with the trend is often easier said than done, because many indicators are based on price reversals not trends. These aren't very effective at identifying trendy periods, or predicting whether trends will continue. We developed the Trendiness Index to help address this problem by indicating the strength and direction of price trend
The MelBar HedgeScalper FinTech RoboTrader MAXIMUM LOTSIZE : 100 Lots (US$10,000,000) per TRADE/POSITION FULLY TRIED, TESTED, PROVEN & VERIFIED ON A REAL LIVE TRADING ACCOUNT! TRY OUT THE DEMO! The Experienced Trader & Global Money Manager Version. 89% Trade Winning Percentage. 32.679% Profit Gain or ROI in 2 Trading Days. Profit Factor 3.59 Average Trade Length 1h 22m. The MelBar HedgeScalper FinTech RoboTrader is easy to use. Has the Advantage of Retiring Unnecessary "Debt" Positi
Chart Patterns Detect 15 patterns (Ascending Triangle, Descending Triangle, Rising Wedge, Falling Wedge, Bullish Flag, Bearish Flag, Bullish Rectangle, Bearish Rectangle Symmetrical triangle, Head and Shoulders, Inverted Head and Shoulders, Triple top, Triple Bottom, Double Top, Double Bottom) Use historical data to calculate the probability of each pattern to succeed (possibility to filter notification according to the chance of success) gives graphic indication about the invalidation level and
Next level of trend trading here. Possibility 75%, the indicator analyzes the current market to determine short (small dot), middle (circle with a dot inside) and long (cross with a circle and a dot inside) trends.  Wingdings characters of  Aqua color represents the beginning of the UP trend. Wingdings characters of  Orange color represents the beginning of the DOWN trend. Possibility 75% Indicator will improve your trading in the world of forex, commodities, cryptocurrencies and indices.
The indicator of a Professional Trader is an arrow indicator for predicting the direction of price movement. I have been working on this indicator since 2014. You can use this indicator as your main indicator, use its entry signals, and use it as your only indicator to find entry points. About the product: Recommended TF [H4-D1-W1]   . The indicator predicts the direction of the next candle. Fits a variety of tools; Flexibility in settings for different instruments and intervals through the MO
Smart Reversal Signal  is a professional indicator for the MetaTrader 4 platform; it has been developed by a group of professional traders. This indicator is designed for Forex and binary options trading. By purchasing this indicator, you will receive: Excellent indicator signals. Free product support. Regular updates. Various notification options: alert, push, emails. You can use it on any financial instrument (Forex, CFD, options) and timeframe. Indicator Parameters Perod - indicator calculat
The indicator shows the potential trend direction by cyclical-wave dependence. Thus, all the rays of the intersection will be optimal rays, in the direction of which the price is expected to move, taking into account the indicator period. Rays can be used as a direction for potential market movement. But we must not forget that the approach must be comprehensive, the indicator signals require additional information to enter the market.
Was: $299  Now: $99   Supply Demand uses previous price action to identify potential imbalances between buyers and sellers. The key is to identify the better odds zones, not just the untouched ones. Blahtech Supply Demand indicator delivers functionality previously unavailable on any trading platform. This 4-in-1 indicator not only highlights the higher probability zones using a multi-criteria strength engine, but also combines it with multi-timeframe trend analysis, previously confirmed swings
Ugenesys AI MT4
Odaine Ramon Mcmillan
5 (1)
uGenesys AI - 90% Accurate Daytrading Indicator Introducing the ultimate forex trading indicator system, uGenesys AI, powered by cutting-edge AI technology and advanced analytical techniques, including Time-Series Analysis and Genetic Algorithms. Our AI-powered trading system leverages the power of time-series analysis to identify trends and patterns in historical price data, allowing traders to make informed predictions about future market movements. By analyzing vast amounts of data, our syst
For sure, this indicator has become very popular amongst traders. Through coding this indicator will give you the most accurate levels possible for your trading analysis. We have also added in the ability for you to receive alerts when the price breaks above or below a Support or Resistance lines! HOW TO USE The red rectangles represent your resistance/supply zone. The green rectangles represent your support/demand zone.  BONUS FEATURES We coded this indicator with the ability to switch between
AWキャンドルパターンインジケーターは、強力なキャンドルパターンスキャナーと組み合わせた高度なトレンドインジケーターの組み合わせです。これは、最も信頼性の高い30のローソク足パターンを認識して強調表示するための便利なツールです。さらに、それは色付きのバーに基づく現在の傾向分析器です。     サイズ変更と配置が可能なプラグインマルチタイムフレームトレンドパネル。トレンドフィルタリングに応じてパターンの表示を調整する独自の機能。 利点: キャンドルパターンを簡単に識別 結果を再描画しません 内蔵のマルチタイムトレンドパネル 無効なパターンタイプ(1、2、3キャンドル) パターン表示時のトレンドフィルタリングの調整 MT5 version - >   HERE   / Instructions and description  -> HERE 表示されるパターンのリスト: ハンマーパターン ピンアップ/ピンダウン 弱気なハラミ/強気なハラミ 弱気のハラミクロス/強気のハラミクロス ピボットポイント反転アップ/ピボットポイント反転ダウン ダブルバーローとハイクローズ/ダブルバーローとロークロ
El indicador "MR BEAST PATTERNS WITH ALERTS" es una herramienta avanzada diseñada para identificar y notificar automáticamente patrones de oportunidad en el mercado financiero. Basándose en una combinación de análisis técnico y algoritmos inteligentes, este indicador escanea constantemente el gráfico en busca de patrones específicos que podrían indicar momentos propicios para la toma de decisiones. Características Principales: Detección de Patrones: El indicador identifica patrones de oportunida
「Auto FIBO Pro」Crypto_Forex インジケーターは、取引の補助ツールとして最適です。 - インジケーターは、フィボナッチ レベルとローカル トレンド ライン (赤色) を自動的に計算してチャート上に配置します。 - フィボナッチ レベルは、価格が反転する可能性のある重要な領域を示します。 - 最も重要なレベルは、23.6%、38.2%、50%、61.8% です。 - リバーサル スキャルピングやゾーン グリッド取引に使用できます。 - Auto FIBO Pro インジケーターを使用して、現在のシステムを改善する機会も多数あります。 - Info Spread Swap Display があり、接続されている外国為替ペアの現在のスプレッドとスワップを表示します。 - ディスプレイには、アカウントの残高、エクイティ、マージンも表示されます。 - Info Spread Swap Display は、チャートのどのコーナーにも配置できます。 高品質のトレーディングロボットとインジケーターをご覧になるにはここをクリックしてください! これは、この MQL5 ウェブサイ
Apollo SR Master は、サポート/レジスタンスゾーンを利用した取引をより容易かつ確実にする特別な機能を備えたサポート/レジスタンスインジケーターです。このインジケーターは、ローカル価格の高値と安値を検出することで、タイムラグなしでリアルタイムにサポート/レジスタンスゾーンを計算します。そして、新たに形成されたSRゾーンを確認するために、インジケーターは特別なシグナルを表示します。このシグナルは、SRゾーンを実際の売りまたは買いシグナルとして考慮して使用できることを示します。この場合、SRゾーンの強度が高まり、SRエリアからの取引が成功する確率も高まります。これがこのインジケーターの基本的な考え方です。 SRゾーンは、ストップロスとテイクプロフィットの設定を容易にします。シグナルの方向に応じて、SRゾーンの上または下のスペースをストップロスとして設定できます。さらに、反対側のSRゾーンは、潜在的なテイクプロフィットエリアとして設定できます。 また、Apollo SRマスターインジケーターをご利用のすべてのユーザーには、「Apollo Price Action System」
このプロダクトを購入した人は以下も購入しています
TrendMaestro
Stefano Frisetti
4 (4)
Attention: beware of SCAMS, TRENDMAESTRO is only ditributed throught MQL5.com market place. note: this indicator is for METATRADER4, if you want the version for METATRADER5 this is the link:  https://www.mql5.com/it/market/product/108106 TRENDMAESTRO ver 2.5 TRENDMAESTRO recognizes a new TREND from the start, he never makes mistakes. The certainty of identifying a new TREND is priceless. DESCRIPTION TRENDMAESTRO identifies a new TREND in the bud, this indicator examines the volatility, volumes a
There is always a need to measure if the market is "quiet" or it is volatile. One of the possible way is to use standard deviations, but the issue is simple : We do not have some levels that could help us find out if the market is in a state of lower or higher volatility. This indicator is attempting to do that : •           values above level 0 are indicating state of higher volatility (=GREEN buffer) •           values below level 0 are indicating state of lower volatility (=RED buffer)
Miraculous Indicator – ガン・スクエア・オブ・ナインに基づく100%非リペイントのFXおよびバイナリーツール この動画では、FXおよびバイナリーオプションのトレーダー向けに特別に開発された、非常に正確で強力な取引ツールである Miraculous Indicator を紹介しています。このインジケーターがユニークなのは、伝説的な ガン・スクエア・オブ・ナイン と ガンの振動の法則 に基づいている点で、現代の取引で利用できる最も正確な予測ツールの一つとなっています。 Miraculous Indicatorは 完全に非リペイント であり、ローソク足が確定した後にシグナルが変化したり消えたりすることはありません。つまり、見たものがそのまま利用できます。これにより、トレーダーは自信を持ってエントリーおよびエグジットを行うための信頼性と一貫性のある根拠を得ることができます。 主な特徴: ガン・スクエア・オブ・ナインとガン理論に基づいて構築 100%非リペイントのシグナルシステム すべての時間枠(M1、M5、H1、H4、日足、週足)で機能 FXおよびバイナリーオプション取引
「 Dynamic Scalper System 」インジケーターは、トレンド波の中でスキャルピング取引を行う手法のために設計されています。 主要通貨ペアと金でテスト済みで、他の取引商品との互換性があります。 トレンドに沿った短期的なポジションオープンのシグナルを提供し、追加の価格変動サポートも提供します。 インジケーターの原理 大きな矢印はトレンドの方向を決定します。 トレンド波の中では、小さな矢印の形でスキャルピングシグナルを生成するアルゴリズムが機能します。 赤い矢印は強気方向、青い矢印は弱気方向です。 トレンドの方向には敏感な価格変動ラインが描かれ、小さな矢印のシグナルと連動します。 シグナルは次のように機能します。適切なタイミングでラインが現れるとエントリーシグナルが形成され、ラインが開いている間はポジションが保持され、完了すると取引が終了します。 推奨される動作時間枠はM1~H4です。 矢印は現在のローソク足に形成され、次のローソク足が開いている場合は、前のローソク足の矢印は再描画されません。 入力パラメータ Trend Wave Period - トレンド方向
Route Lines Prices -は、価格の方向性を予測するために設計されたインジケーターです。シンプルなインターフェースには、価格変動と将来の方向性を計算するための複数のアルゴリズムが搭載されています。これらのアルゴリズムには、使用する時間枠に基づいたボラティリティ計算と価格平滑化が含まれています。 このインジケーターには、「 Calculating price values 」値を変更するためのパラメーターが1つだけあります。デフォルト値の1は、バランスの取れた自動計算を提供し、インジケーターを手動で設定することなく使用できます。 値を2から500まで手動で変更することで、インジケーターを独自のトレーディングシステムに合わせてカスタマイズできます。 このインジケーターは、M1からH4の時間枠での使用を推奨します。あらゆる取引銘柄で使用できます。 シグナル矢印はローソク足の終値で生成され、過去の履歴には再描画されません。 メインチャートには、重複した矢印が表示されます。 複数のアラートタイプが利用可能です。内蔵のライン軌跡カウンターは、終値に基づいて動作します。これ
The indicator is built on a non-standard Zig Zag, it draws accumulations after which if the price leaves this zone and a test of this zone occurs, then a sound signal is given and an arrow appears - after the test candle closes.The indicator does not redraw its signals, it is very easy to use, there are only three settings 1- this is the zig zag parameter 2- this is the minimum price exit from the zone 3- this is the maximum price exit from the zone. The lower the parameter for Zig Zag, the more
Trend Breakout Arrows Indicator The Trend Breakout Arrows Indicator is a momentum-based signal tool designed to identify potential bullish and bearish breakout opportunities. It displays clear arrow signals directly on the price chart, helping traders quickly recognize possible trend changes and continuation setups. Up Arrow (Buy Signal) A magenta up arrow appears below a candle when bullish momentum begins to strengthen. This signal indicates that buying pressure may be overtaking selling press
TRADING STRATEGY GUIDE DELIVERY The full Trading Strategy Guide will be sent directly to you after purchase. Just message me on MQL5 and ask for it — you'll receive it instantly, along with priority support and setup help. Powered Market Scanner for Smart Trading Decisions Keypad Support & Resistance is a next-generation MT4 trading system built for serious traders who demand precision, reliability, and clarity. It combines advanced smart filters with real-time price structure logic to genera
一款信号统计指标(MT4)——实现基于当前图表周期下的单线MA转向和双线MA金叉/死叉统计 . 转向定义:前一K向下或走平,当前K向上,视为转向向上;反之,转向向下。 金死叉定义:前一K快线在慢线下方,当前K快线在慢线上方,为金叉;反之,死叉。 参数及使用说明: 1、可指定统计K线数。 2、可指定4个不同的日内时间段,格式如"03:00-07:59",4个时间段可交叉任意输入。 3、可配置ABC三个浮盈区间段点值。如:分界区间统计小点值设为500,即当某转向信 号出现后到下一反向信号止浮盈<=此点值,计入A区间; 若大于此点值<大分界点值时,计入B区间;若大于“大分界点值”计入C区间。 4、最大/最小浮盈统计。显示所有统计区间内的最大浮盈点值和最小浮盈点值(亏损点值)。 5、输出完整信号,按信号出现顺序排列,如“ACCBCA”之类。 6、综合预测。使用概率、周期、趋势、马尔可夫链等综合概算输出预测该信号出现的归类概率值。 7、加载指定MA线。在当前图表自动载入相应设置的MA线。 8、自适应列宽。以完整显示统计信号数。 9、用法:点击相应统计按钮即输出相应的统计表格.
SYSTEM INTRODUCTION:   The Binary Options Channels System Is Specifically Designed For Binary Options Trading. Unlike Other Systems And Indicators That Were Adopted From Other Trading Environments For Binary Options. Little Wonder Why Many Of Such Systems Fail To Make Money . Many End Up Loosing Money For Their Users.  A Very Important Fact That Must Be Noted Is The Fact That Application Of Martingale Is not Required. Thus Making It Safer For Traders Usage And Profitability. A Trader Can Use Fi
Fxland Price Reversal Zones (MT4) FXLAND Smart Reversal Indicator is a professional technical analysis tool designed to help traders identify potential price reversal zones and key market turning points with clarity and precision. The best reversal indicator and price return by choosing only one ceiling or floor in each time frame A masterpiece of combining mathematics and Gann, fractal matrix, Fibonacci, movement angle and time. Completely intelligent Key Features Detects potential pr
VTrende Pro MT4 - MTF indicator for trend trading with a display panel for MT5 *** Videos can be translated into any language using subtitles (video language - Russian) Although the signals of the VTrende Pro indicator can be used as signals of a full-fledged trading system, it is recommended to use them in conjunction with the Bill Williams TS. VTrende Pro  MT4 is an extended version of the VTrende indicator. Difference between Pro version and VTrende: - Time zones - Signal V - signal 1-2 wave
FFx Engulfing Setup Alerter gives trade suggestions with Entry, Target 1, Target 2 and StopLoss. Below are the different options available: Entry suggestion - pips to be added over the break for the entry 3 different options to calculate the SL - by pips, by ATR multiplier or at the pattern High/Low 3 different options to calculate the 2 TPs - by pips, by ATR multiplier or at Risk/Reward Offset the dashboard - any place on the chart Remove the suggestion once the price reached the SL line Lines
FFx InsideBar Setup Alerter gives trade suggestions with Entry, Target 1, Target 2 and StopLoss. Below are the different options available: Entry suggestion - pips to be added over the break for the entry Minimum candle size - to avoid too close buy/sell entry suggestions 3 different options to calculate the SL - by pips, by ATR multiplier or at the pattern High/Low 3 different options to calculate the 2 TPs - by pips, by ATR multiplier or at Risk/Reward Offset the dashboard - any place on the c
FFx OutsideBar Setup Alerter gives trade suggestions with Entry, Target 1, Target 2 and StopLoss. Below are the different options available: Entry suggestion - pips to be added over the break for the entry. 3 different options to calculate the SL - by pips, by ATR multiplier or at the pattern High/Low. 3 different options to calculate the 2 TPs - by pips, by ATR multiplier or at Risk/Reward. Offset the dashboard - any place on the chart. Remove the suggestion once the price reached the SL line.
FFx PinBar Setup Alerter gives trade suggestions with Entry, Target 1, Target 2 and StopLoss. Below are the different options available: Entry suggestion - pips to be added over the break for the entry Minimum candle size - to avoid too small candles 3 different options to calculate the SL - by pips, by ATR multiplier or at the pattern High/Low 3 different options to calculate the 2 TPs - by pips, by ATR multiplier or at Risk/Reward Offset the dashboard - any place on the chart Remove the sugges
Automatic, live & interactive picture of all trendlines. Assign push, email and sound alerts to the lines of your choice and be informed about price rollback, breakout, rollback after breakout, number of rollbacks, line expiration by double breakout. Correct, drag or delete the lines and interactively tune the line system. https://youtu.be/EJUo9pYiHFA . Chart examples https: //www.mql5.com/en/users/efficientforex Price Interaction Events All events are effective immediately and only after one
The purpose of this new version of the MT4 standard indicator provided in your platform is to display in a sub-window multiple timeframes of the same indicator with its divergences. See the example shown in the picture below. But the display isn't like a simple MTF indicator. This is the real display of the indicator on its timeframe. Here's the options available in the FFx divergences indicator: Select the timeframes to be displayed (M1 to Monthly) Define the width (number of bars) for each tim
The purpose of this new version of the MT4 standard indicator provided in your platform is to display in a sub-window multiple timeframes of the same indicator with its divergences. See the example shown in the picture below. But the display isn't like a simple MTF indicator. This is the real display of the indicator on its timeframe. Here's the options available in the FFx divergences indicator: Select the timeframes to be displayed (M1 to Monthly). Define the width (number of bars) for each ti
The FFx Dashboard MTF alerter will show you on a single chart all the timeframes (M1 to Monthly) with their own status for the indicator. 2 Alert Options: Single timeframe: each selected timeframe alert separately when a signal occurs Multi timeframes: all selected timeframes must agree for an alert to be triggered Both options have an input to select the timeframes to be used for the alert(s). How to Understand the Status: Green/Red square: histogram above/below 0 line Green square + Red bord
The FFx Dashboard MTF alerter will show you on a single chart all the timeframes (M1 to Monthly) with their own status for the indicator. 2 Alert Options: Single timeframe: each selected timeframe alert separately when a signal occurs Multi timeframes: all selected timeframes must agree for an alert to be triggered Both options have an input to select the timeframes to be used for the alert(s). How to understand the status: Green/Red square: RSI above/below 50 line Green square + Red border: R
The FFx Dashboard MTF alerter will show you on a single chart all the timeframes (M1 to Monthly) with their own status for the indicator. 2 Alert Options: Single timeframe: each selected timeframe alert separately when a signal occurs Multi timeframes: all selected timeframes must agree for an alert to be triggered Both options have an input to select the timeframes to be used for the alert(s). How to understand the status: Green/Red square: Stoch above/below 50 line Green square + Red border:
The FFx Dashboard MTF alerter will show you on a single chart all the timeframes (M1 to Monthly) with their own status for the indicator. 2 Alert Options: Single timeframe: each selected timeframe alert separately when a signal occurs Multi timeframes: all selected timeframes must agree for an alert to be triggered Both options have an input to select the timeframes to be used for the alert(s). How to understand the status: Green/Red square: Price above/below Cloud (Kumo) Green square + Red bo
The FFx Dashboard MTF alerter will show you on a single chart all the timeframes (M1 to Monthly) with their own status for the indicator. 2 Alert Options: Single timeframe: each selected timeframe alert separately when a signal occurs Multi timeframes: all selected timeframes must agree for an alert to be triggered Both options have an input to select the timeframes to be used for the alert(s). How to understand the status: Green/Red square: MA pointing Up/Down Green square + Red border: MA po
The FFx Dashboard MTF alerter will show you on a single chart all the timeframes (M1 to Monthly) with their own status for the indicator. 2 Alert Options: Single timeframe: each selected timeframe alert separately when a signal occurs. Multi timeframes: all selected timeframes must agree for an alert to be triggered. Both options have an input to select the timeframes to be used for the alert(s). How to understand the status: Green square: Price above PSAR Red square: Price below PSAR Options
The FFx Dashboard MTF alerter will show you on a single chart all the timeframes (M1 to Monthly) with their own status for the indicator. 2 Alert Options: Single timeframe: each selected timeframe alert separately when a signal occurs Multi timeframes: all selected timeframes must agree for an alert to be triggered Both options have an input to select the timeframes to be used for the alert(s). How to understand the status: Green/Red square: CCI above/below levels (ie. 100/-100) Grey square: C
The FFx Dashboard MTF alerter will show you on a single chart all the timeframes (M1 to Monthly) with their own status for the indicator. 2 Alert Options: Single timeframe: each selected timeframe alert separately when a signal occurs Multi timeframes: all selected timeframes must agree for an alert to be triggered Both options have an input to select the timeframes to be used for the alert(s). How to understand the status: Green/Red square: ADX above level Grey square: ADX below level Red bor
作者のその他のプロダクト
LiquiditySweep Pro Market MT5 v1.3 バージョン 1.3 – 2026.04.25 LiquiditySweep Pro Market は、Liquidity Sweep / Stop Hunt(流動性スイープ / ストップ狩り)コンセプトに基づいたエキスパートアドバイザー(EA)であり、直近の高値・安値のブレイク(流動性の回収)を検出し、市場が反転の確認を示した際に取引を行うよう設計されています。 コア戦略 コア戦略はシンプルかつ効果的です: 直近高値の上、または直近安値の下での流動性スイープを検出 ローソク足のクローズによって反転を確認 オプションのEMA方向フィルターを適用 選択した市場セッションのみで取引 ストップロス(SL)、テイクプロフィット(TP)、ブレークイーブン、トレーリングストップによるポジション管理 このバージョンは、元の戦略ロジックを変更することなく、リアル口座での安定性を向上させるために最適化されています。 コア取引ロジック EAは設定可能なルックバック期間を使用して市場構造を監視します。 売り条件:価格が直近高値を上抜
TrendLines Pro EA v1.1 – プロフェッショナル・ゴールド・ブレイクアウト・スキャルパー TrendLines Pro EA   は、ゴールド市場( XAUUSD )専用に設計された高度なアルゴリズム取引システムです。機関投資家レベルのトレンドラインを自動的に識別し、流動性が最も高い時間帯に高確率なブレイクアウト・トレードを実行します。  バージョン 1.1 の新機能 旧バージョンと比較して、v1.1ではパフォーマンスと安全性を向上させるための重要なアップグレードが導入されました。 検証済みマージンコントロール(Validated Margin Control):   各トレードの前にアカウントの余剰証拠金をチェックする新しいセキュリティレイヤー。過剰なレバレッジを防ぎ、プロの取引基準を満たします。 強化された MQL4 アーキテクチャ:   最新の MT4 ビルドに合わせて完全に書き換えられ、超高速な実行速度とブローカーサーバー・プロトコルとの100%の互換性を確保しました。 改善されたロット正常化:   ブローカー固有の最小/最大ロット要件やステップ(刻み幅)
SMC Reversing v1.4 概要 (Overview) SMC Reversing は、Smart Money Concepts(SMC)、流動性スイープ(liquidity sweep)の検出、および反転トレードロジックに基づいて開発されたエキスパートアドバイザー(Expert Advisor)です。 本EAは、直近の高値と安値を監視し、ストップハントの可能性がある動きを検出します。価格が流動性レベルをスイープし、その後レンジ内に戻ってクローズした場合、システムは反転の可能性があるセットアップとして認識し、自動的に取引を管理します。 バージョン1.4は、実際の市場環境における実行の安定性、リスク管理、ブローカー互換性、およびフィルタリングの改善に重点を置いています。 バージョン1.4での改善点 前バージョンと比較して、以下の重要な点が改善されています: 高スプレッド環境での制御の向上 低ボラティリティ時のフィルタリング改善 重要な市場イベントに対する手動ニュースフィルターの追加 注文執行の安全性の向上 ブローカーのストップレベル処理の改善 取引セッション制御の追加 異なる
LiquiditySweep Pro Market MT5 v1.3 バージョン 1.3 – 2026.04.26 LiquiditySweep Pro Market は、Liquidity Sweep / Stop Hunt(流動性スイープ / ストップ狩り)コンセプトに基づいたエキスパートアドバイザー(EA)であり、直近の高値・安値のブレイク(流動性の回収)を検出し、市場が反転の確認を示した際に取引を行うよう設計されています。 コア戦略 コア戦略はシンプルかつ効果的です: 直近高値の上、または直近安値の下での流動性スイープを検出 ローソク足のクローズによって反転を確認 オプションのEMA方向フィルターを適用 選択した市場セッションのみで取引 ストップロス(SL)、テイクプロフィット(TP)、ブレークイーブン、トレーリングストップによるポジション管理 このバージョンは、元の戦略ロジックを変更することなく、リアル口座での安定性を向上させるために最適化されています。 コア取引ロジック EAは設定可能なルックバック期間を使用して市場構造を監視します。 売り条件:価格が直近高値を上抜け
Fractal Strategy Pro NR MTF – ユーザーガイド 1. このインジケーターについて Fractal Strategy Pro NR MTF は、トレンド分析、フラクタルロジック、MTFダッシュボード、自動フィボナッチ、Repaint / Non-Repaint切替機能を搭載した高度なMT4インジケーターです。 このインジケーターは以下を表示できます: BUY / SELL シグナル M30 / H1 / H4 マーカーライン トレンドライン(Trendlines) Auto Swing Fibonacci レベル マルチタイムフレームのトレンド方向 2. インストール方法 MetaTrader 4 を開きます。 次へ移動します: File → Open Data Folder 以下のフォルダを開きます: MQL4 → Indicators インジケーターファイル ( Fractal_Strategy.ex4 ) をこのフォルダへコピーします。 MT4を再起動するか、Navigatorウィンドウを更新します。 次の場所からインジケーターをチャートへドラッグします
Swing Highs Lows Candle Patterns Pro Swing Highs Lows Candle Patterns Pro is a professional price action indicator designed to identify important swing highs, swing lows and high-probability reversal candle patterns automatically. The indicator combines market structure analysis with candlestick confirmation to help traders locate potential BUY and SELL opportunities without cluttering the chart. Unlike ordinary swing indicators, it not only detects Higher Highs (HH), Higher Lows (HL), Lower Hi
FVG iFVG Smart Zones は、MetaTrader 4 用に開発されたプロフェッショナルなインジケーターであり、Fair Value Gap(FVG)および Inverse Fair Value Gap(iFVG)ゾーンをチャート上で自動検出・表示します。 このインジケーターは、市場構造と価格の非効率性に基づいて、強気および弱気のインバランスゾーンを自動的に識別します。ゾーンはリアルタイムでスマートな矩形として表示され、オプションのラベル機能によりチャート分析をより分かりやすくします。 主な特徴: • 強気・弱気 FVG の自動検出 • iFVG(ミティゲーション済みインバランス)の表示 • Close または Wick モードによるスマートミティゲーションロジック • ゾーン延長機能 • 軽量かつ最適化された構造 • プロフェッショナルでクリーンなチャート表示 • 色や設定を完全にカスタマイズ可能 • スキャルピング、デイトレード、Smart Money トレード向け設計 主な設定: • Lookback Bars — ゾーン検出に使用する過去バー数 • Show F
SMART REVERSAL PATTERN INDICATOR — User Guide 1. Installation Open your MetaTrader 4 platform. Go to File → Open Data Folder . Open the folder: MQL4 → Indicators Copy the indicator file into this folder. Restart MetaTrader 4 or refresh the Navigator panel. Find SMART REVERSAL PATTERN INDICATOR in the Navigator. Drag and drop it onto your chart. 2. How the Indicator Works SMART REVERSAL PATTERN INDICATOR detects reversal pattern structures based on ZigZag swing points. The indicator marks the lat


Smart Multi Timeframe Fractals – User Guide Overview Smart Multi Timeframe Fractals is a MetaTrader 4 indicator designed to show confirmed fractal signals directly on the chart. The indicator can display both current timeframe fractals and higher timeframe fractals such as M5, M15, M30, H1, H4 and D1. The main purpose of this indicator is to help traders identify important market turning points, support and resistance zones, and higher timeframe confirmation areas. Main Features Confirmed fracta

Swing Highs Lows Candle Patterns Pro Swing Highs Lows Candle Patterns Pro is a professional price action indicator designed to identify important swing highs, swing lows and high-probability reversal candle patterns automatically. The indicator combines market structure analysis with candlestick confirmation to help traders locate potential BUY and SELL opportunities without cluttering the chart. Unlike ordinary swing indicators, it not only detects Higher Highs (HH), Higher Lows (HL), Lower Hi
QB Institutional Bands NR QB Institutional Bands NR is a premium MetaTrader 4 (MT4) technical analysis indicator designed by Qiyas Baghirov to identify trends, volatility zones, and institutional market structures. It provides real-time, algorithmic trading visualizations across asset classes like Gold (XAUUSD), Forex, indices, and crypto markets. Key Technical Mechanisms Dual-Layer Volatility Tracking: Consists of Outer Gold Bands that outline exhaustion or profit-taking points, alongside Inne
Heiken Ashi Trend is a MetaTrader 4 indicator designed to help traders identify trend direction using Heiken Ashi candle structure combined with trend-confirmation filters. The indicator displays bullish and bearish trend phases directly on the chart, helping traders follow market direction more clearly and avoid unnecessary noise during fast price movement. Main Features Heiken Ashi based trend visualization Smooth trend-following structure Optional EMA line display ADX, CCI and MACD confirmati

Nested Pivot Arrows NR Nested Pivot Arrows NR is a non-repaint MT4 and MT5 indicator that identifies nested pivot structures and highlights potential market turning points directly on the chart. The indicator automatically detects: • Short-Term Highs (STH) and Short-Term Lows (STL) • Medium-Term Highs (MTH) and Medium-Term Lows (MTL) • Long-Term Highs (LTH) and Long-Term Lows (LTL) • Buy and Sell signals based on confirmed nested pivot formations Features: Non-Repaint Logic MT4 & MT5 Version
QB Compass Signal Pro QB Compass Signal Pro is an advanced predictive market direction indicator for MetaTrader 4. It transforms multiple technical factors into a visual compass that helps traders identify potential BUY, SELL, EXTREME BUY, and EXTREME SELL zones before traditional trend-following indicators react. Unlike conventional indicators that only follow price, QB Compass Signal Pro combines momentum, volatility expansion, EMA angle analysis, RSI slope, fractal breakouts, and market struc
Gold Market DNA Pro Gold Market DNA Pro is an innovative trading indicator designed with an original mathematical approach instead of relying on traditional technical indicators. Unlike conventional indicators based on moving averages, RSI, MACD, ATR, Fibonacci, or ZigZag, Gold Market DNA Pro analyzes the market through its own proprietary Market DNA Engine. Key Features - Original Market DNA calculation engine - No Moving Averages - No RSI - No MACD - No ATR - No Fibonacci - No ZigZag - No
Overview EMA Cross Pullback Pro is a professional non-repaint trend-following indicator designed for traders who use EMA crossovers and pullback entries. It combines fast and slow EMA analysis with reversal confirmation to identify high-probability trading opportunities. The indicator automatically detects: EMA Cross BUY and SELL signals Pullback/Reversal confirmation Trend direction Profit/Loss statistics Monthly performance summary Historical signal analysis from a user-defined start date Buil
QB Schumann Market Resonance MT4 QB Schumann Market Resonance MT4 is an advanced market rhythm indicator inspired by the concept of resonance and market pressure analysis. Instead of relying on traditional lagging indicators, it evaluates the balance between bullish and bearish pressure using candle structure, volatility, momentum, and tick activity to identify potential turning points and directional strength. The indicator displays an intuitive dashboard with live Bull Pressure, Bear Pressure,
Tree Market Growth MT4 Nature-Inspired Multi-Timeframe Trend Analysis Tree Market Growth MT4 is a visual trend analysis indicator that transforms market behavior into a 12-stage tree life cycle. It combines trend strength, momentum, volatility, market structure and multi-timeframe confirmation into a single easy-to-read dashboard, helping traders identify trend development, continuation and possible exhaustion. Features • 12-Stage Tree Life Cycle • Multi-Timeframe Analysis (M1, M5, M15, M30, H1,
ZigZag Probability Pro Color は、 MetaTrader 4(MT4) 用のインジケーターで、確定した スイング高値(Swing High) と スイング安値(Swing Low) を検出し、確率ベースの反転モデルによって各転換点を評価します。 このインジケーターは、 ティックボリューム(Tick Volume) 、 Awesome Oscillator(AO) 、 ATR(Average True Range) 、スイングサイズ(Swing Size)、バー数(Bar Count)、および過去のピボットパフォーマンスを分析します。これらの計算に基づき、確定した各ピボットには以下の4段階の反転確率が割り当てられます。 25% 50% 75% 100% 各 ZigZag セグメントは、計算された確率に応じて自動的に色分けされます。 25% — 緑 50% — 黄 75% — オレンジ 100% — 赤 検出されたピボットポイントには、 BUY(買い) または SELL(売り) の矢印とともに、計算された確率(%)が表示されます。シグナル
Nested Pivot Arrows NR MT5 Nested Pivot Arrows NR is a non-repaint MT4 and MT5 indicator that identifies nested pivot structures and highlights potential market turning points directly on the chart. The indicator automatically detects: • Short-Term Highs (STH) and Short-Term Lows (STL) • Medium-Term Highs (MTH) and Medium-Term Lows (MTL) • Long-Term Highs (LTH) and Long-Term Lows (LTL) • Buy and Sell signals based on confirmed nested pivot formations Features: Non-Repaint Logic MT4 & MT5 Ver
フィルタ:
レビューなし
レビューに返信