GetFund
- エキスパート
-
Rudi Rupian
 I started my trading journey in 2008 — not chasing quick profits, but building the discipline to understand how markets truly work. Over the years, I have developed a calm, long-term approach to trading: focused, systematic, and always probability-driven.
 - バージョン: 1.0
- アクティベーション: 5
Combining RSI and Stochastic: A Powerful Momentum Fusion
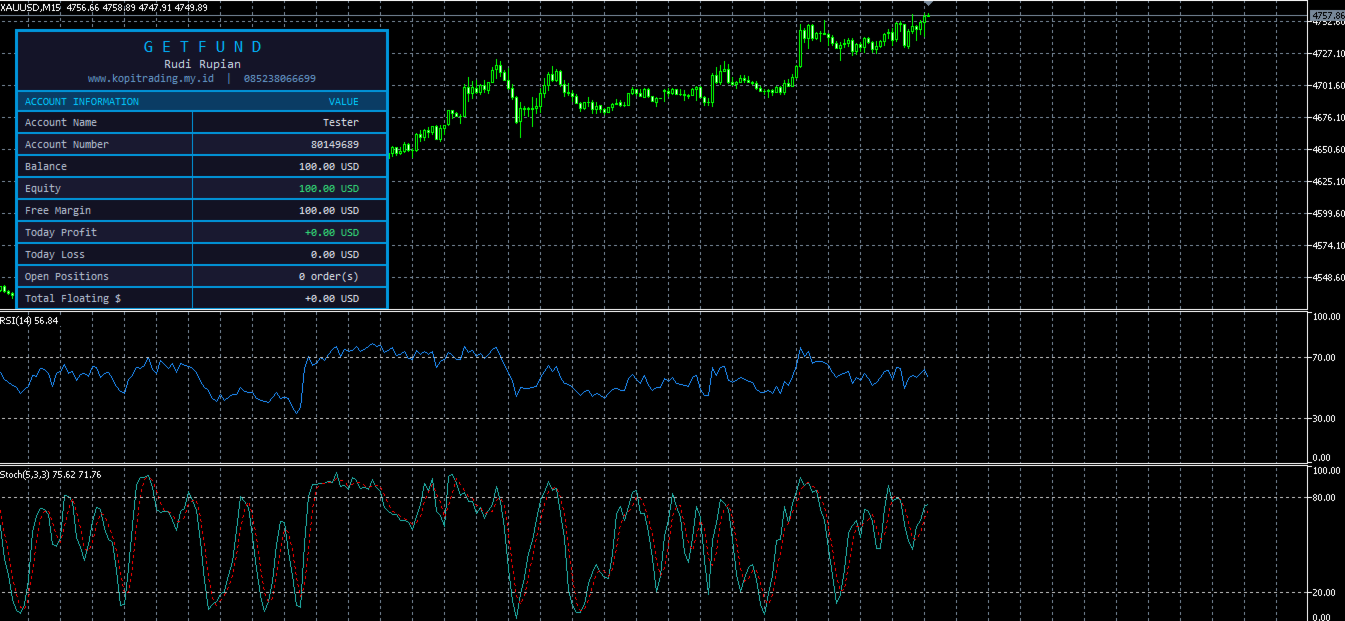
The combination of the Relative Strength Index (RSI) and the Stochastic Oscillator represents one of the most popular and effective pairings in technical analysis. Both indicators measure momentum and operate within bounded ranges, yet they do so through fundamentally different calculations — making their confluence particularly meaningful when signals align.
The RSI, developed by J. Welles Wilder in 1978, measures the magnitude of recent price changes to evaluate overbought or oversold conditions on a scale of 0 to 100. It uses the ratio of average gains to average losses over a defined period, typically 14 periods. The standard overbought threshold is 70 and oversold is 30. The RSI is a smoother, slower-reacting indicator that reflects sustained momentum over time.
The Stochastic Oscillator, by contrast, reacts more quickly to short-term price swings because it measures where the current close sits within the recent high-low range. This faster sensitivity makes it prone to more frequent signals — both valid and false. This is precisely where the RSI becomes invaluable: as a filter that confirms or rejects the faster Stochastic signals.
The core synergy between RSI and Stochastic lies in their complementary speed. When the faster Stochastic generates a buy signal — such as a %K/%D bullish crossover below 20 — and the RSI simultaneously confirms oversold conditions below 30 or is rising from that zone, the combined signal is substantially more reliable than either indicator alone. The trader has two independent momentum measurements both pointing in the same direction, which dramatically reduces the probability of entering a false breakout or a premature reversal trade.
For long entries, the ideal setup unfolds as follows: price approaches a known support zone or a prior swing low. The Stochastic drops into oversold territory below 20 and the %K line crosses above %D, indicating short-term momentum is turning upward. At the same time, the RSI is at or below 30 and begins curling upward, confirming that broader momentum supports the move. This dual signal, especially when accompanied by a bullish candlestick pattern such as a hammer or engulfing bar, creates a high-conviction buy opportunity.
For short entries, the mirror setup applies. Price reaches a known resistance zone or a prior swing high. The Stochastic rises above 80 and the %K line crosses below %D, signaling that short-term momentum is rolling over. Simultaneously, the RSI is at or above 70 and begins declining. This confluence creates a high-probability short entry, particularly when confirmed by a bearish candlestick pattern such as a shooting star or bearish engulfing.
Divergence becomes even more powerful when both RSI and Stochastic exhibit it at the same time. If price makes a new high but both the RSI and Stochastic form lower highs simultaneously, the bearish divergence warning is amplified significantly. Likewise, when price makes a new low but both indicators form higher lows together, the bullish reversal signal carries exceptional weight. Double divergence across two independent indicators is one of the strongest reversal signals available in technical analysis.
One critical consideration when combining these two indicators is avoiding redundancy. Since both RSI and Stochastic are momentum oscillators, traders must be careful not to treat their agreement as confirmation from unrelated sources. True diversification of signals comes from combining a momentum indicator with a trend indicator or a volume indicator. Nevertheless, the RSI-Stochastic pairing remains highly practical because their different calculation speeds and sensitivities provide genuine additional value beyond what either offers alone.
Risk management completes the strategy. Every trade triggered by RSI and Stochastic confluence should have a clearly defined stop-loss placed beyond the nearest significant swing point. Profit targets can be set at the next resistance level for long trades or the next support level for short trades. Risking no more than 1–2% of capital per trade ensures that the strategy remains viable through inevitable losing streaks, preserving capital for the high-quality setups that define long-term trading success.