Joker Arrow

Once upon a time, in the bustling streets of Gotham City, there lived a mysterious figure known only as the Joker. With his enigmatic grin and unpredictable nature, the Joker roamed the city's financial district, leaving chaos and uncertainty in his wake.

One fateful day, a group of traders stumbled upon a peculiar artifact hidden deep within the dark alleys of Gotham. It was a cryptic indicator known as the "Joker Arrow," rumored to possess the power to predict market movements with uncanny accuracy.

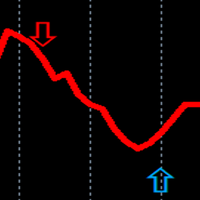
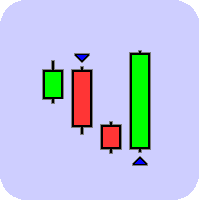
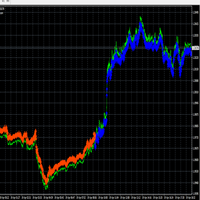
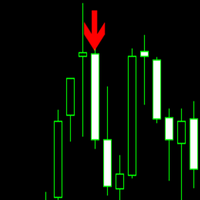
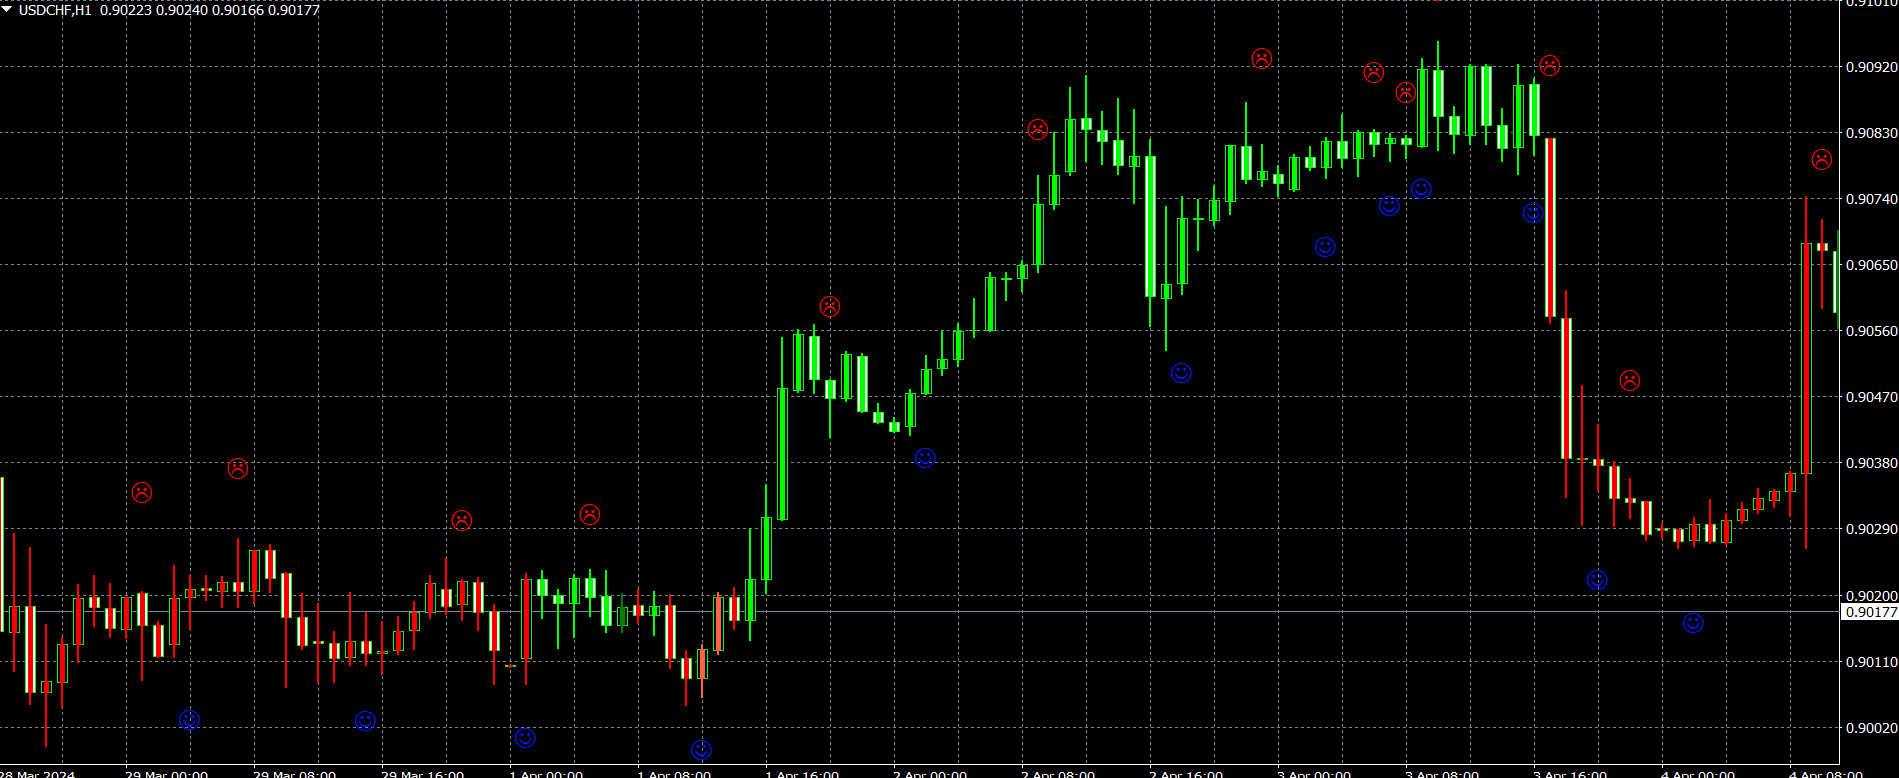
Intrigued by the promise of wealth and adventure, the traders decided to put the "Joker Arrow" to the test. As they studied its signals, they discovered a pattern: whenever the arrow turned blue, it signaled a buy opportunity, and whenever it turned red, it signaled a sell opportunity.

Excited by the prospect of unlocking the secrets of the market, the traders embarked on a journey, following the guidance of the "Joker Arrow." With each blue arrow, they entered the market with confidence, riding the waves of bullish momentum to new heights of prosperity.

But the market, like Gotham itself, was fraught with danger and uncertainty. As the traders navigated its treacherous waters, they encountered red arrows signaling impending downturns and bearish reversals. With nerves of steel, they heeded the warnings of the "Joker Arrow," exiting their positions before disaster struck.

Through triumphs and setbacks, the traders persisted, drawing strength from the guidance of the enigmatic indicator. With each trade, they honed their skills, mastering the art of timing their entries and exits with precision.

As the days turned into weeks and the weeks into months, the traders' fortunes soared, thanks to the wisdom of the "Joker Arrow." They became legends in the world of finance, their names whispered in awe and admiration by traders far and wide.

And so, with the help of the mysterious Joker and his cryptic arrow, the traders conquered the markets, turning chaos into opportunity and uncertainty into wealth. In the ever-changing landscape of Gotham's financial district, one thing remained constant: the power of the "Joker Arrow" to guide them towards prosperity.


おすすめのプロダクト
矢印インジケーター「クールボリューム」は、Mt4のティックボリュームに基づいています。 インジケータ自体は、一定期間(時間枠の選択)で購入または売却するボリュームの数を追跡します。 そして、売り手または買い手の量が異常に過剰になると、それは売るか買うためのシグナルを与えます。 色付きのヒストグラムは下のウィンドウに描かれており、緑色は現時点での買い手の優位性を示しています。これは、この価格帯で増加する可能性のある即時の逆転を意味します。 逆に、赤い色は売り手の優位性を示しており、これは潜在的な即時の下向きの逆転を意味します。 また、視覚的な利便性のために、矢印がメインチャートウィンドウに直接追加されました。 ユーザーの便宜のために、外部変数には、信号の周波数と履歴(HistoryBars)上のそれらの数の設定変数が含まれています。 ただし、値を1000を超えるように設定することはお勧めしません。 これの多くはあなたの端末のパフォーマンスを遅くします。 また、"===<<矢印設定>>>==="セクションでは、任意の矢印とヒストグラムパラメータを自分で設定することができます。
Implement
Vitalii Zakharuk
5 (1)
Implement analyzes market dynamics for pivot points. If you want to learn how to spot the correct reversals for consistently likely profitable trading, buy this indicator. Shows favorable moments of entering the market in stripes. Ready-made trading system. The principle of operation of the indicator is to automatically determine the current state of the market when placed on a chart, analyze historical data based on historical data and display instructions for further actions on the trader's
The "Market Profile" indicator displays the profiles and volumes of periods – weekly, daily, session (8-hour), 4-hour, hour, summary. The VAH/VAL price area is automatically highlighted by a dotted line for each profile (except for the summary). The indicator includes chroma Delta, which colors the profile areas. The areas of prevailing Buys is colored in green, that of Sells - in red. The intensity histogram features blue/red respectively. In the filter mode, the indicator displays the volume a
VWAP Indicator MT4
Kyra Nickaline Watson-gordon
5 (2)
Description : VWAP (Volume-Weighted Average Price) is the ratio of the value traded to total volume traded over a particular time horizon. It is a measure of the average price at which pair is traded over the trading horizon. Read More. All Symbols and All Timeframes are supported. Indicator Inputs :     VWAP Mode : Mode of VWAP Calculation. Options can be selected : Single,Session,Daily,Weekly,Monthly     Volumes : Real Volumes,Tick Volumes     Price Type : Used price for calculating.
Colored Volume
Seyed Ali Tabatabaei Lotfi
The Colored Volume is a simple, yet useful indicator that paints the color of the volume based on the price direction.  If the price has increased, the volume will be shown in green. If the price has decreased, the volume will be shown in red. This indicator will make it super easy for traders to track volume bars based on price movements. (The settings of the volume bars including line width and color can be manually changed by the trader.)
Implementation of indication of trend movement with moments for potential stops in the Cloud Power indicator. The transition to the shadow warns of a possible reversal. The entry of the price inside the shadow speaks of a flat movement. The indicator tracks the market trend with unmatched reliability, ignoring sharp market fluctuations and noise around the average price. Simple, visual and efficient use. The indicator does not redraw and does not lag. It can be easily used as an independent t
This indicator is designed for M1 time-frame and shows: Sum of ticks when the price goes up (color Green -The major component of a candlestick = the body). Sum of points when the price goes up (color Green -The extension lines at the top of the candle). Sum of points when the price goes down (color Red -The major component of a candlestick = the body). Sum of points when the price goes down (color Red -The extension lines at the lower end of the candle). Keep in mind that Sum of Points will be g
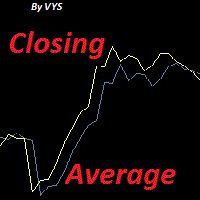
Closing average This is a completely new indicator in technical analysis. It is based solely on mathematical calculation. about signals It’s worth going into a buy transaction when the price has crossed the indicator line from bottom to top and it is under the price it is worth entering a deal on sell when the price is below the indicator line This author’s development, he doesn’t use any indicators of technical analysis in his analysis.
Real Trade
Thomas Bradley Butler
Real Trade は、1 時間未満の時間枠で取引します。 上昇トレンドと下降トレンドの方向で取引します。 より高い時間トレンド方向で取引し、最初のろうそくを取引します. 反対を使用して終了するか、レシオを使用して 1:1 以上を終了し、トレーリング ストップと共に使用します。 最良の結果を得るには、アクティブな時間帯にリアル トレンドをトレードし、より高いトレンド方向でトレードします。 結果と可能性を調べるためにテスターにインジケーターをロードします。 トレンドと取引するスキャルピング矢印を使用するか、Fib ターゲットを使用するか、またはその両方を使用します。 5 分または 15 分のチャートにおすすめです。 ターゲットとストップに FIb を使用: https://www.mql5.com/en/code/12813
Description Candle Power Color indicator which shows when the market is trending and when it is in a sideway movement KEY LINKS:   How to Install  –  Frequent Questions  -  All Product How is this indicator useful? It allow to detect trend and sideway movements in market NEVER repaints. It adapts to any market and asset. It can support any other trading strategy. Note 1:  This indicator should only be considered as a part of any trading strategy. You should complement this with other filters (e.
Trend based indicator Identify trends with this indicator A simple-to-use trend indicator No complicated settings Attributes: Can be used in all symbols Can be used in all time frames Relatively high signals No complicated settings Specific to the trend Lifetime support Settings: Alarm Show Alert: By activating these settings, after receiving the signal, you will receive an alarm in Metatrader Alarm Show Notification: By activating these settings, after receiving the signal, you will receive a
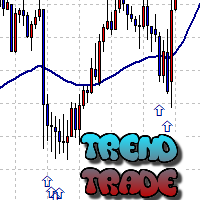
The Trend Trade indicator displays assumed turning points of the price on the chart in the direction of the trend after correction. It is based on data of the Prise Reversal oscillator with the period 6 and indicators which characterize strength and availability of the trend. When the value of Prise Reversal is in overbought or oversold area (area size is set by a user), and the current trend is confirmed, the Trend Trade indicator draws an arrow pointed to the further assumed price movement. I
The Elephant Candle is an indicator for MT4. It draws arrows when strong bullish or bearish candles appear. Strong candles frequently initiate a new trend. The arrows can be used in expert advisors. This indicator can improve already existing trading strategies. The indicator is very fast and doesn't repaint. Inputs Period Candle Multiplier Candle Niceness [%] Arrow Size Enable Alert Enable Push Notification Enable Email
Money Flow Profile MT5 HERE   Here   our more valuable tools SMC Trend Trading   ,  Easy SMC Trading  ,  Institutional SMC Architect Volume Analysis Tools  ,  Volume flow Profile  ,  Market volume profile  , FVG with Volume  , Liquidity Heatmap Profile  ,  Volume Spread Analysis This Master Edition is engineered for clarity and speed, featuring a unique Auto-Theme Sync system that instantly beautifies your chart layout upon loading. Key Features: True Money Flow Calculation: Goes beyond stand
ForecastPro is a price projection indicator based on historical pattern similarity. In simple terms, it searches for past price segments that closely resemble the current price pattern, then “borrows” the subsequent movement from that historical pattern and projects it forward. Key Features Data Source You can choose which price series is used for matching: Open, High, Low, Close, HL2, HLC3, or OHLC4. The better the source matches your analysis style, the more relevant the results. Training Data
MoveWave - Moving waves are very handy indicators for determining pivot levels. Most Forex traders make decisions based on technical analysis. This type of analysis determines patterns and trends in the market. With the help of complex mathematical equations that are combined and made out in the form of this indicator, the trader will be able to more accurately determine the price reversal levels. Wave theory mathematically represents various behavioral models of the market. It is used as the ba
This is a volume profile where you can customize the time period you want. You can do this with a line or choose automatic functions such as showing the volume from the last time period. The indicator also shows the maximum volume value (VPOC - VOLUME POINT OF CONTROL) and the average value, colors and settings you can adjust as you like, there are many possibilities. If you need an indicator that shows the constant volume time frames there is  ...HERE... Volume Profile  is an advanced charting
In the age of speed, everyone wants to gets what he/she wants quickly. Trading is all about gaining money, and scalping is a way of doing it in a short time. The "Scorpion Scalper Pro" has been named on the scorpion because of its speed. The indicator serves to provide signals for the M15 timeframe. It also sends Alerts (window alert, email alert, push notification alert) whenever a buy/sell signal occurs, and the alerts are customizable (they can be turned ON or OFF). Indicator inputs : - Buy
The First Dawn indicator uses a unique mechanism to search and plot signals. This keeps searching for signals, making it a great indicator for scaping and identification of changes in direction, swing trading and trend trading. The  First Dawn   helps you get early signals. The backtest gives the true picture of how the indicator works with real/demo accounts. Although this is a tiny indicator it is packed with advantageous settings that will help you whether you desire to: Snap the Peaks and
Smart Money Trap Detector は、スイングハイとスイングローにおける流動性トラップを識別します。価格がキーレベルを超えて反転した際に、機関投資家が仕掛けたブルトラップまたはベアトラップの可能性をシグナルとして検出します。各トラップはヒゲのサイズ、反転速度、出来高に基づいて1〜5の強度スコアを受け取ります。   動作原理 インジケーターは設定可能なルックバック期間を使用してスイングハイとスイングローを追跡します。価格がスイングハイを上抜けまたはスイングローを下抜けした場合、設定された確認足数以内に価格がレベルを戻って反転するかを監視します。ブレイクアウトのヒゲがATR比率の最小閾値を満たし、価格がレンジ内に戻って引ければ、トラップが確認されます。スコアは3つの要素から計算されます:ATRに対するヒゲのサイズ、反転速度、出来高の急増。すべてのシグナルはリペイントを防ぐために確定済みの閉じたバーに配置されます。   視覚機能 チャート上の矢印が確認されたブルトラップ(上向き矢印)とベアトラップ(下向き矢印)をマーク。流動性ゾーンがスイングポイント周辺に色付き矩形として描
This indicator was created to spot potential reversals in the market. It will help you find the edge while trading which is required to be profitable. The indicator does what its good at, processing data objectively and presents you with the results once a new setup has been formed. It can send you a notification or email and such, so you are not required to follow the market every move. This, coupled with the edge it gives, give you the time and rest to take the appropriate action. The Engulfi
Emotions are a weakness. QHO mathematics is the future of your trading! You know what really truly frustrating?  Information garbage and noise. All those legacy, lagging indicators on the charts look like an attempt to steer a rocket ship with a steam engine. They are useless. They look at the past while the market is already flying forward on next-gen tech. We created QHO. This is not just another indicator. This is pure mathematics crushing market chaos right on your chart. Imagine completely
Trend New Trend Indicator, shows the signals for entry. Displays both entry points and the trend itself. Shows statistically calculated moments for entering the market with arrows. When using the indicator, it is possible to optimally distribute the risk factor. Settings: Uses all one parameter for settings. Selecting a parameter, it is necessary to visually resemble it so that the appropriate graph has a projection of extremes. Options: Length - the number of bars for calculating the indica
Dynamic SR Trend Channel Dynamic SR Trend Channel is a simple indicator for trend detection as well as resistance/support levels on the current timeframe. It shows you areas where to expect possible change in trend direction and trend continuation. It works with any trading system (both price action and other trading system that use indicators) and is also very good for renko charting system as well. In an uptrend, the red line (main line) serves as the support and the blue line serves as the r
The Power calculates the strength of the long and short forces by the ratio of the price breakthrough to the average amplitude of the previous market. When the intensity is strong, the signal appears on the chart to estimate the direction of the next wave. There is no future function for the indicator. All signals will not move or disappear after they appear, and have a good real-world reference value. The indicator parameters allow the user to make individual adjustments. More EA and Indicators
The indicator allows you to trade binary options. The recommended time frame is М1 and the expiration time is 1,2,3 minutes. The indicator suitable for auto and manual trading. A possible signal is specified as a arrows above/under a candle. You should wait until the candle closes! Arrows are not re-painted Trade sessions: TOKYO section (Half-end) Currency pairs: USD/JPY Working time frame: M1 Expiration time: 1,2,3 minutes. The indicator also shows good results when using the martingale strateg
FREE
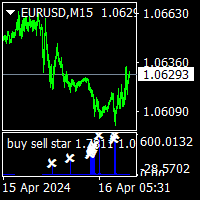
buy sell star indicator has a different algoritms then up down v6 and buy sell histogram indicators. so that i put this a another indicator on market. it is no repaint and all pairs and all time frame indicator. it need minimum 500 bars on charts. when  the white  x sign on the red histogram that is sell signals. when the white x sign on the blue  histogram that is sell signals. this indicator does not guarantie the win.price can make mowement on direction opposite the signals. this is multi tim
Нестандартный индикатор определения текущего тренда. Альтернативный подход к определению текущей рыночной тенденции. В основе лежит уникальный алгоритм. Не используются   скользящие средние , осцилляторы , супер-тренды и прочие стандартные индикаторы. Для таймфреймов:   от M15 до D1 . Для стилей торговли:  интрадэй, свинг, долгосрок . Может стать готовой торговой стратегией совместно с любым канальным индикатором. Например таким, как индикатор   "Snake" . Внимание! Это индикатор, а не советник,
This is a multi-timeframe version of the popular Hull Moving Average (HMA). The Double HMA MTF Light indicator combines two timeframes on a single chart. The HMA of the higher timeframe defines the trend, and the HMA of the current timeframe defines short-term price movements. The indicator is freely distributed and hasn't audio signals or messages. Its main function is the visualization of price movements. If you need advanced functionality of the HMA multi-timeframe indicator (information ab
FREE
PX Trend is a technical indicator that mathematically transforms the price of a currency pair in the form of signaling arrows on the chart, it is used to predict the direction of the market movement. This tool is basic for the interpretation of the parameters of the graphs in technical analysis. PX Trend refers to an arrow indicator Forex - a tool that gives unambiguous signals to buy or sell currencies using arrows. An arrow directed upwards recommends buying, downward - selling. The indicato
このプロダクトを購入した人は以下も購入しています
Trend SniperX MT4
Sarvarbek Abduvoxobov
5 (3)
Trend Sniper X は、トレーダーがトレンドの方向性と潜在的な反転ポイントを明確かつ正確に特定できるように設計された、MetaTrader 5 用のマルチタイムフレーム・トレンドフォロー指標です。 MT5版はこちら: https://www.mql5.com/en/market/product/181101 価格情報: 現在の価格はプロモーション価格であり、今後のアップデートや新機能の追加に伴い変更される場合があります。 Code2Profit チャンネル マルチタイムフレーム分析で市場をマスターしよう! Trend Sniper Xで勝率を最大化する方法:ルールとセッションのコツ 技術仕様 プラットフォーム MetaTrader 5 インジケータータイプ マルチタイムフレーム・トレンドインジケーター 動作タイムフレーム すべてのチャート時間足(上位足M1~MN1を独立して選択可能) 主要対象銘柄 為替(Forex)、ゴールド(XAUUSD)、その他のCFD 推奨口座 すべての口座タイプ ビジュアル表示 トレンドカラーローソク足(買い/売り/弱い/変化)+ 買い/売りシグナル
SR Liquidity は、市場の流動性が集中し、価格が最も強く反応する「隠れたゾーン」を可視化するために設計されたトレーディング指標です。こうした流動性の高いエリアは強力なサポート(支持)およびレジスタンス(抵抗)レベルとして機能し、市場が反転する可能性が最も高いポイントを明確に示してくれます。 単なる一般的なサポートラインやレジスタンスラインを描画するのではなく、「SR Liquidity」は実際の価格変動を分析し、売りと買いの圧力が集中するゾーンを特定します。これらは、市場の真の動きを牽引する「流動性のプール(溜まり場)」そのものです。それらをチャート上に直接可視化することで、価格が実際に反応する前に、その動きを予測することが可能になります。つまり、このインジケーターは価格の方向性が変わる可能性を予測するのです。生のプライスアクションを、市場の重要な水準(転換点となり得るポイント)を示す、明確で実用的なロードマップへと変換してくれます。 このインジケーターは、FX、株価指数、貴金属、仮想通貨など、あらゆる銘柄や時間足で使用可能です。 ご購入後、取引手順や無料の優れた追加インジケ
Miraculous Indicator Binary & Forex v3 StrategySafe Miraculous Indicator Binary & Forex v3 StrategySafe は、明確なシグナル、強力な確認ツール、そして Binary と Forex 市場で使える体系的な取引アプローチを求めるトレーダー向けのプロフェッショナル指標です。 v3 では、MIR Dashboard、Miraculous Confirmation Dashboard、GANN Law、Square of 9 レベル、GANN 角度、そしてより高度な Forex モードが搭載されています。 主な特徴 Binary と Forex の両方に対応。 MIR Dashboard による素早い市場分析。 Miraculous Confirmation Dashboard によるエントリー確認。 Forex 分析用の GANN Law drawing lines。 Square of 9 のライン、レベル、方向表示。 1x1 GANN Angle によるトレンド圧力の確認。 Entry I
Gann Made Easy は、ミスター・ギャンの理論を使用した取引の最良の原則に基づいた、プロフェッショナルで使いやすい外国為替取引システムです。 W・D・ガン。このインジケーターは、ストップロスとテイクプロフィットレベルを含む正確な買いと売りのシグナルを提供します。 PUSH通知を利用して外出先でも取引可能です。 ご購入後、取引方法の説明と優れた追加インジケーターを無料で入手するには、私にご連絡ください! おそらく、ギャンの取引手法についてはすでに何度も聞いたことがあるでしょう。通常、ギャンの理論は初心者のトレーダーだけでなく、すでにある程度の取引経験がある人にとっても非常に複雑なものです。なぜなら、ギャンの取引手法は理論的にはそれほど簡単に適用できるものではないからです。私はその知識を磨き、最良の原則を私の外国為替インジケーターに組み込むために数年を費やしました。 このインジケーターは非常に簡単に適用できます。必要なのは、それをチャートに添付し、簡単な取引推奨事項に従うだけです。このインジケーターは常に市場分析の仕事を行い、取引の機会を探します。適切なエントリーポイントを検出す
M1 Sniper
Oleg Rodin
4.97 (30)
M1 SNIPER は使いやすいトレーディングインジケーターシステムです。M1時間足向けに設計された矢印インジケーターです。M1時間足でのスキャルピングのためのスタンドアロンシステムとして、また既存のトレーディングシステムの一部としても使用できます。このトレーディングシステムはM1時間足での取引に特化して設計されていますが、他の時間足でも使用できます。元々、この手法はXAUUSDとBTCUSDの取引用に設計しましたが、他の市場においても役立つと考えています。 インジケーターのシグナルは、トレンドの方向と逆方向に取引できます。インジケーターのシグナルを利用して両方向に取引するのに役立つ特別な取引テクニックをご紹介します。この手法は、特別な動的なサポートとレジスタンスの価格帯を利用することに基づいています。 ご購入後、M1 SNIPER矢印インジケーターをすぐにダウンロードできます。さらに、M1 SNIPERツールのすべてのユーザーに、以下のスクリーンショットに表示されているApollo Dynamic SRインジケーターを無料で提供しています。この2つのインジケーターを組み合わせることで
DayTrader PRO MT5:  https://www.mql5.com/en/market/product/186222 DayTrader PROは、ジョン・エリュース(John Ehlers)のラグuerreフィルターと強力な自動最適化エンジンを組み合わせた、高度なトレーディング・インジケーターです。固定されたパラメーターを使用するのではなく、直近の市場状況に基づいて最適な設定を自動的に検索するため、手動による絶え間ない調整をすることなく、変化する市場のボラティリティに適応できます。 本インジケーターは、明確な「買い(BUY)」および「売り(SELL)」シグナルを生成し、現在の市場ボラティリティから算出された適応型のストップロス(Stop Loss)およびテイクプロフィット(Take Profit)レベルを表示します。トレンド、効率レシオ(Efficiency Ratio)、ボラティリティ、およびローソク足フィルターが内蔵されており、精度の低いセットアップを排除し、シグナルの精度を向上させます。 リアルタイム・パフォーマンスパネルには、現在最適化されている設定、プロフィッ
Scalper Inside PRO は日中トレンドの分析を助け、エントリー前にトレードを組み立てられるインジケーターです。中核となるのは、相場をより正確に読むための3つの専用ストラテジー。シグナルが出た瞬間に方向を自動で判断し、主要な価格帯を計算するので、想定エントリーポイント、予想ストップロス、複数の利確レベルを前もって確認できます。詳細なパフォーマンス統計が、各銘柄とストラテジーが過去にどう機能したかを示し、今の相場に合った資産選びを助けます。単体のスキャルピングツールとしても、あなたのシステムの一部としても、自作 EA のベースとしても使えます。MetaTrader 4 プラットフォームで動作します。 インジケーターはエントリー、3つの利確レベル - TP1、TP2、TP3、そして任意のストップロスをチャート上に直接表示します。自作の矢印インジケーターを接続し、その統計と収益性を検証することも可能です。 ご購入後は直接ご連絡ください。専用のボーナス add-ons、実トレードでの活用に関する追加情報、そしてご自身のトレードシステムや EA への正しい接続のサポートをお渡しします
この製品は 2026 年の市場向けに更新され、最新の MT5 ビルドに最適化されています。 価格更新のお知らせ: Smart Trend Trading System は現在 $99 で提供されています。 次の 30 件の購入 後、価格は $199 に上がります。 特別オファー: Smart Trend Trading System を購入後、私にプライベートメッセージを送ることで、 Smart Universal EA を無料 で受け取り、Smart Trend のシグナルを自動売買に変えることができます。 Smart Trend Trading System は、リペイントなし、再描画なし、遅延なしの完全なトレーディングシステムです。よりクリーンなシグナル、より明確なトレンド方向、そしてより整理された取引方法を求めるトレーダー向けに作られています。 Online course , manual and [download presets] . このシステムは、トレンド検出、反転ゾーン、Smart Cloud、トレーリングストップロジック、サポートとレジスタンス、ローソク足の色分け
Tokyo Indicatorは、トレンドの方向性、潜在的な取引シグナル、および市場状況を視覚的に分かりやすく表示します。 色分けされた階段状のトレンドラインにより、強気局面(青色)と弱気局面(マゼンタ色)が明確に区別されます。トレンドの変化に合わせて表示される方向矢印は、売買の好機を強調します。 統合されたダッシュボードには、現在のシグナル、市場のバイアス(傾向)、モメンタム、ボラティリティ、シグナルの品質がひと目で分かるようにまとめられています。これにより、トレーダーはパネルを切り替えることなく、価格変動(プライスアクション)とインジケーターの数値を照らし合わせて分析を行うことができます。 すっきりとしたチャート表示と簡潔な市場概要により、Tokyo Indicatorはトレンド分析や取引判断における体系的なアプローチをサポートします。 あらゆる時間足や銘柄に対応しており、特に金(ゴールド)の取引に適しています。 トレンド スキャナーの強力なサポートを利用して、無料のインジケーターを入手し、プライバシーを守ります。あーみー!     設定 ShowHUD - チャート上のパネ
割引は 24 時間後に終了します — 次の価格は$ 69 ZORYK — MetaTrader 4専用 XAUUSDシグナル・トレードプランニングシステム このような経験はありませんか。 ゴールドを分析し、エントリーを待ち、ようやくポジションを持った直後に価格が逆方向へ動く。 早すぎる決済をしてしまったり、Stop Lossを動かしたり、数秒迷っている間にチャンスを逃したりする。 その後、相場は自分が最初に予想していた方向へ進み、目標へ到達する。 問題は常に方向判断ではありません。 本当の問題は、明確な計画がなかったことです。 どこでエントリーすべきか。 どこでトレードの前提が無効になるのか。 近い利益を確保すべきか、より大きな値動きを待つべきか。 現在のsetupが本当に強いのか、それとも無理にトレードを探しているだけなのか。 ゴールドは非常に速く動きます。 正しい分析でも、明確なプランがなければ数秒で悪い判断に変わることがあります。 ZORYKは、その問題を解決するために開発されました。 ZORYKとは ZORYKは、MetaTrader 4とXAU
ボリューム ブレイク オシレーターは、オシレーターの形で価格変動とボリューム トレンドを一致させるインジケーターです。 私はボリューム分析を戦略に統合したいと思っていましたが、OBV、マネー フロー インデックス、A/D、ボリューム加重 Macd など、ほとんどのボリューム インジケーターにいつもがっかりしていました。 そのため、このインジケーターを自分で作成し、その有用性に満足したので、市場に公開することにしました。 主な機能: ボリュームの増加 (ブレイク) によってサポートされる方向に価格が動くフェーズを強調します。 ボリュームの増加が止まり、市場が縮小するフェーズを強調します。 特に時間枠 (<=15 分) のデイトレードでは、価格もボリュームも動かないため、市場が将来の動きに備えられるフェーズを強調します。 ボリュームの増加によってサポートされていない場合、他のエキスパート アドバイザーからの誤ったシグナルをフィルターします。 トレンドとレンジ フェーズを非常に簡単に視覚化できます 入力パラメーター: 計算設定: 計算タイプ: FAST、NORMAL、SLOW。同じ
Dynamic Forex28 Navigator - 次世代の Forex 取引ツール。 現在 49% オフ。 Dynamic Forex28 Navigator は、長年人気のインジケーターを進化させたもので、3 つの機能を 1 つにまとめています。 Advanced Currency Strength28 インジケーター (レビュー 695 件)  + Advanced Currency IMPULSE with ALERT (レビュー 520 件) + CS28 コンボ シグナル (ボーナス)。 インジケーターの詳細 https://www.mql5.com/en/blogs/post/758844 次世代の Strength インジケーターが提供するもの  オリジナルで気に入っていたすべての機能が、新機能と精度の向上によって強化されました。 主な機能: 独自の通貨強度計算式。 すべての時間枠でスムーズかつ正確な強度ライン。 トレンドの特定と正確なエントリーに最適です。 ダイナミックマーケットフィボナッチレベル (マーケットフィボナッチ)。 このインジケーターに固有
True Signal FX は、MetaTrader 4 向けに開発されたマルチタイムフレーム対応のトレードインジケーターです。チャート上で、1つの取引シナリオを構成するために必要な情報をまとめて表示します。 このインジケーターは単一の方向シグナルだけを表示するのではなく、市場分析、シグナル確認、取引レベルの計算を1つの画面に統合します。取引シナリオが検出されると、売買方向、エントリー(Entry)、ストップロス(Stop Loss)、テイクプロフィット(Take Profit)、現在のシグナルスコア、市場状態に関する情報を確認できます。 True Signal FX は、複数のテクニカル指標を毎回手動で比較し、それぞれの取引機会について取引レベルを個別に計算するのではなく、明確に定義された取引シナリオを基準として判断したいトレーダー向けに設計されています。 True Signal FX は自動で注文を発注しません。インジケーターは分析結果と取引シナリオを提供し、最終的な取引判断および注文の執行はトレーダー自身が行います。 動作原理 True Signal FX は、選択された複数の
Neuro Poseidon is a new indicator by Daria Rezueva. It combines precise trading signals with adaptive TP/SL levels - creating best possible trades as a result! Message me and get  Neuro Poseidon Assistant  as a gift to automize your trading process! What makes it stand out? 1. Proven profitability on all assets and timeframes 2. Only confirmed BUY and SELL signals present on the chart 3. Adaptive TP & SL levels generated by the software for each trade 4. Easy to understand - suitable for all
サポート線と抵抗線のプロットにうんざりしていませんか? サポートレジスタンス は、非常に興味深いひねりを加えてチャート内のサポートとレジスタンスラインを自動検出およびプロットするマルチタイムフレームインジケーターです。価格レベルは時間とともにテストされ、その重要性が高まるにつれて、ラインは太くなり、暗くなります。 [ インストールガイド | 更新ガイド | トラブルシューティング | よくある質問 | すべての製品 ] 一晩でテクニカル分析を強化 チャートを閲覧せずに重要な価格レベルを検出 一目ですべての価格レベルの相対的な強さを認識する すべての取引で最大30時間のプロットラインを節約 インジケーターは、すべての価格レベルの年齢を表示します インジケーターは再描画されていません 過去および現在の価格レベルは近接によって崩壊し、現在の市場行動に合わせて調整されます。動作は、必ずしもピークではない場所に線が引かれます。 価格レベルは、時間とともに拒否されるにつれて、より暗く、より広くなります ノイズを避けるために、重要でない価格レベルは定期的にクリアされます カスタマイズ可能な時間枠の
ご紹介     Quantum Breakout PRO は 、ブレイクアウト ゾーンの取引方法を変革する画期的な MQL5 インジケーターです。 13年以上の取引経験を持つ経験豊富なトレーダーのチームによって開発された Quantum Breakout PROは 、革新的でダイナミックなブレイクアウトゾーン戦略により、あなたの取引の旅を新たな高みに押し上げるように設計されています。 クォンタム ブレイクアウト インジケーターは、5 つの利益ターゲット ゾーンを備えたブレイクアウト ゾーン上のシグナル矢印と、ブレイクアウト ボックスに基づいたストップロスの提案を提供します。 初心者トレーダーにもプロのトレーダーにも適しています。 量子EAチャネル:       ここをクリック MT5バージョン:   ここをクリック 重要!購入後、インストールマニュアルを受け取るためにプライベートメッセージを送ってください。 推奨事項: 時間枠: M15 通貨ペア: GBPJPY、EURJPY、USDJPY、NZDUSD、XAUUSD アカウントの種類: ECN、Raw、またはスプレッドが非
現在30%OFF! 初心者やエキスパートトレーダーのためのベストソリューション! このダッシュボードソフトウェアは、28の通貨ペアで動作しています。それは私達の主要な指標(高度な通貨の強さ28と高度な通貨インパルス)の2に基づいています。それは全体の外国為替市場の大きい概観を与えます。それは、すべての(9)時間枠で28の外国為替ペアのための高度な通貨の強さの値、通貨の動きの速度と信号を示しています。チャート上で1つのインディケータを使用して市場全体を観察し、トレンドやスキャルピングの機会をピンポイントで見つけることができたら、あなたのトレードがどのように改善されるか想像してみてください。 このインディケータには、強い通貨と弱い通貨の識別、潜在的な取引の識別と確認がより簡単になるような機能が搭載されています。このインディケータは、通貨の強さや弱さが増加しているか減少しているか、また、すべての時間枠でどのように機能しているかをグラフィカルに表示します。 新機能として、現在の市場環境の変化に適応するダイナミックなマーケットフィボナッチレベルが追加され、すでに当社のAdvanced
The indicator no repaint!!!  The indicator has   MTF   mode, which adds confidence to trading on the trend (   no repaint   ). How to trade? Everything is very simple, we wait for the first signal (big arrow), then wait for the second signal (small arrow) and enter the market in the direction of the arrow. (See screens 1 and 2.) Exit on the opposite signal or take 20-30 pips, close half of it, and keep the rest until the opposite signal. By the way, it is on Scalping that most traders make m
CRT Candle Range Theory HTF MT4 - Ultimate CRT Indicator: 高度なICTコンセプトとMalaysian SnRトレーディングシステム 最も先進的なCandle Range Theoryインジケーターでマーケットメーカーの足跡をマスターしましょう。Ultimate CRT Indicatorを使用して、Smart Money Concepts (SMC)の真の力を解き放ち、機関投資家のように正確にトレードします。真剣なトレーダー専用に構築されたこのインジケーターは、ICT Concepts (Inner Circle Trader)の核となる柱である、非常に効果的なCandle Range Theory (CRT)を自動化し、Malaysian Support and Resistance (SnR)エントリー手法とFVG (Imbalance)ゾーンの致命的な精度でそれを強化します。 MT4またはMT5でForex、Crypto、Indicesのいずれを取引している場合でも、このアルゴリズムは市場のノイズを取り除き、ダマシ(fak
Update: Push to mobile notification is now added as optinal in the settings. Most traders fail to generate profit because of the lack of so-called filters and scanners. If you want to win at trading you need a solid system and also a filtering tool for some or all of your entry criteria. It is impossible to follow 24 currency pairs, all the indices, stocks and commodities without a filtering tool. Imagine you can get an email any time CCI crosses bellow 100 and 0 when the price is bellow MA5 an
Top Bottom Tracker は、洗練されたアルゴリズムに基づき、市場のトレンドを分析し、トレンドの高値と安値を検出することができるインジケーターです / MT5バージョン 。 価格は500$に達するまで徐々に上昇します。次の価格 --> $99 特徴 リペイントなし このインジケーターは 新しいデータが到着してもその値を変更しません 取引ペア すべてのFXペア 時間枠 すべての時間枠 パラメーター ==== インジケータの設定 設定パラメータ // 40 (値が高いほど、シグナルは少なくなりますが、より正確です) 上レベル値 // 80 (上水平線の値) 下限値 // 20 (下限水平線の値) インジケータ計算バー // 3000 (何本分のインジケータを計算するか。0を指定すると、全てのバーに対してインジケータを計算します) ==== アラーム設定 ポップアップアラート // true (端末にアラームを表示) メールアラート // true (アラームをメールで通知) アラート時間間隔 // 10 (アラーム間隔 (分)) 警告
TrendLine PRO MT4
Evgenii Aksenov
4.83 (168)
The Trend Line PRO indicator is an independent trading strategy. It shows the trend change, the entry point to the transaction, as well as automatically calculates three levels of Take Profit and Stop Loss protection. Trend Line PRO is perfect for all Meta Trader symbols: currencies, metals, cryptocurrencies, stocks and indices. The indicator is used in trading on real accounts, which confirms the reliability of the strategy. Robots using   Trend Line PRO   and real Signals can be found here:   
トレンドトレーディング は、タイミングのプルバックとブレイクアウトにより、市場で起こっているトレンドから可能な限り利益を得るように設計された指標です。確立されたトレンドの中で価格が何をしているかを分析することにより、取引の機会を見つけます。 [ インストールガイド | 更新ガイド | トラブルシューティング | よくある質問 | すべての製品 ] 自信を持って効率的に金融市場を取引する むち打ちにならずに確立されたトレンドから利益を得る 収益性の高いプルバック、ブレイクアウト、早期の逆転を認識する この指標は、独自の品質とパフォーマンスを分析します 複数時間枠のダッシュボードを実装します インジケーターは再描画されていません 電子メール/音声/視覚アラートを実装します 確立されたトレンドは多くの取引機会を提供しますが、ほとんどのトレンド指標はそれらを完全に無視しています。インジケーターの解釈はかなり簡単です: (1) トレンドの変化 (2) トレンドの方向への後退 (3) トレンドの方向へのブレイクアウト 赤いダッシュ は下降トレンド中の修正です 青いダッシュ は上昇トレンド中
Prop Firm Sniper MT4  is a professional market structure indicator that automatically identifies high-probability BUY and SELL opportunities using BOS and CHoCH analysis. Recommended Timeframes: For backtesting, use the indicator on   M5 or M15   for Gold (XAUUSD), and   M15 or H1   for more volatile Forex pairs such as   GBPUSD, USDJPY, EURGBP , and similar markets. CONTACT ME AFTER PURCHASE TO CLAIM YOUR FREE BONUSES! Prop Firm Sniper  is a professional market structure indicator designed t
現在20%OFF! 初心者やエキスパートトレーダーに最適なソリューションです。 このインディケータは、エキゾチックペア・コモディティ・インデックス・先物など、あらゆるシンボルの通貨の強さを表示することに特化したインディケータです。金、銀、原油、DAX、US30、MXN、TRY、CNHなどの通貨の強さを表示するために、9行目にどのシンボルでも追加することができます。独自の機能を多数搭載し、新しい計算式を採用したため、ユニークで高品質、かつ手頃な価格のトレーディングツールとなっています。新しいトレンドやスキャルピングチャンスのトリガーポイントを正確に把握することができるため、あなたのトレードがどのように改善されるか想像してみてください。 ユーザーマニュアル:ここをクリック   https://www.mql5.com/en/blogs/post/708876 すべての時間枠に対応します。あなたはすぐにトレンドを見ることができるようになります! 新しいアルゴリズムに基づいて設計されているため、潜在的な取引の特定と確認がより簡単になります。これは、8つの主要通貨と1つのシンボルの強弱
推測をやめて、統計的優位性を持って取引を始めましょう 株価指数はFXとは異なる動きをします。決まったセッションがあり、オーバーナイトでギャップが発生し、予測可能な統計パターンに従います。このインジケーターは、DAX、S&P 500、ダウ・ジョーンズなどの指数を自信を持って取引するために必要な確率データを提供します。 何が違うのか ほとんどのインジケーターは何が起こったかを示します。このインジケーターは次に何が起こる可能性が高いかを示します。毎取引日、インジケーターは100日間のヒストリカルデータに対して現在のセットアップを分析します。類似のギャップ、類似のオープニングポジションを持つ日を見つけ、価格が主要なレベルに到達した頻度を正確に計算します。ギャップが埋まるか、昨日の高値がテストされるかの推測はもう必要ありません。実際のデータに基づいた正確なパーセンテージが得られます。 すべての入力パラメータを説明した完全なマニュアルはこちら: https://www.mql5.com/en/blogs/post/766370 優れたセットアップを見つけるための戦略ガイドはこちら: https:/
Easy Breakout
Mohamed Hassan
4.71 (14)
After your purchase, feel free to contact me for more details on how to receive a bonus indicator called VFI, which pairs perfectly with Easy Breakout for enhanced confluence!    Easy Breakout is a powerful price action trading system built on one of the most popular and widely trusted strategies among traders: the Breakout strategy ! This indicator delivers crystal-clear Buy and Sell signals based on breakouts from key support and resistance zones. Unlike typical breakout indicators, it levera
この製品は 2026 年の市場向けに更新され、最新の MT5 ビルドに最適化されています。 価格更新のお知らせ: Atomic Analyst は現在 $99 で提供されています。 次の 30 件の購入 後、価格は $199 に上がります。 特別オファー: Atomic Analyst を購入後、私にプライベートメッセージを送ることで、 Smart Universal EA を無料 で受け取り、Atomic Analyst のシグナルを自動売買に変えることができます。 Atomic Analyst は、リペイントなし、再描画なし、遅延なしの Price Action トレーディングインジケーターで、手動取引、シグナルの明確化、EA 自動化のために設計されています。 User manual: settings, inputs and strategy.     &   User Manual PDF . 価格行動、強さ、モメンタム、マルチタイムフレーム方向、高度なフィルターを分析し、トレーダーがノイズを減らし、弱いセットアップを避け、より構造化された取引判断を行えるようにします。 こ
対称三角形パターンダッシュボードを使用すると、ここで利用可能な対称三角形パターンインジケーターによって描画される対称三角形パターンについて、複数の市場と時間枠を一度に監視できます。 https://www.mql5.com/en/market/product/68709/ 上記のインジケーターにアクセスして、対称的な三角形のパターンがどのように形成され、それらを取引するための戦略に従うのが簡単かについて詳しく学んでください。 ダッシュボードはスタンドアロン製品であり、インジケーターが機能する必要はありません。パターンを監視し、形成されたときにアラートを発行するだけなので、チャートでパターンを実際に確認したい場合は、対称的な三角形のパターンインジケーターも必要になります。 対称的な三角形のチャートパターンは、価格が上昇または崩壊することを余儀なくされる前の収縮と統合の期間を表しています。下のトレンドラインからのブレークアウトは新しい弱気トレンドの始まりを示し、上のトレンドラインからのブレークアウトは新しい強気のトレンドの始まりを示します。 このダッシュボードはこれらのパターンを識
Advanced Supply Demand
Bernhard Schweigert
4.91 (302)
現在30%オフ 初心者にもエキスパートトレーダーにも最適なソリューション このインジケーターは独自の機能と新しい公式を多数内蔵しており、ユニークで高品質かつ手頃な取引ツールです。このアップデートでは、2つの時間枠ゾーンを表示できるようになります。より長いTFだけでなく、チャートTFとより長いTF(ネストゾーンを表示)の両方を表示できます。すべてのSupply Demandトレーダーの皆さんのお気に召すはずです。:) 重要情報の公開 Advanced Supply Demandの可能性を最大化するには、 https://www.mql5.com/ja/blogs/post/720245 にアクセスしてください。   エントリーまたはターゲットの正確なトリガーポイントを正確に特定できれば取引がどのように改善されるか想像してみてください。新しい基盤となるアルゴリズムに基づいて構築されているため、買い手と売り手の間の潜在的な不均衡をさらに簡単に特定できます。これは、最も強い需要と供給のゾーンと、過去のパフォーマンス(古いゾーンを表示)がグラフィカルに表現されるためです。これらの機能は、最適な
作者のその他のプロダクト
NeuroScalper
Thomas Bradley Butler
5 (1)
アップデート!矢印が100レベルと200レベルに追加されました。 このインディケータは極値にアクセスするために正確であり、主に1分間の買いポジションをサポートします。他の時間枠を使用することもできますが、レベルは異なります。これは優れた発振器であり、他の発振器と比較して違いを確認します。 ニューロネットワークの概念を使用したデイトレード。このインジケーターは、基本的な形式のニューロネットワークを使用して売買するシグナルを生成します。 1分足チャートのインジケーターを使用します。インジケーターは再描画されません。 1分間のチャートまたはさまざまなレベルを使用する他のチャートを使用してテスターでダウンロードして実行し、取引を分析して自分で確認します。市場を頭皮にする多くの機会。より高い時間枠で使用できますが、レベルはあなたの裁量に応じて変更する必要があります。時間枠が長いほど、範囲が広くなります。 このモデルで考慮すべき概念と事項: 複数のインジケーターが使用され、重みが適用され、最大値と最小値に2つのデータポイントがあります。この指標は主に上昇トレンドを取引するためのものですオシレ
ForexReversal
Thomas Bradley Butler
4 (1)
忍耐はストレスのないスキャルピングの鍵です。 200の移動平均を通過するのを確認したら、矢印をトレードし、移動平均フィルターを使用せずに、最後のスイングポイントから拡大またはトレンドを作成します。 1分間の時間枠に最適で、日中の動きの勢いを捉えます。 トレーリングストップを使用して、簡単に20ピップを取るか、より大きなトレンドのために長く滞在します。 この指標からの本当に大きな取引の写真の例を見てください。 1分の時間枠が最適です。 ズームアウトしてトレンドを確認します。 矢印は再描画または再計算されません。 1分の時間枠に添付して取引を調査し、それが戦略に使用できるかどうかを確認します。 私 ルール: 購入のための青 販売のための赤 横向きの期間を避けてください 大量の取引と勢いの取引 ストップロスを使用する
株式(CFD)のみのデイトレード。 取引には手間がかかります。 すべてのエントリと終了を通知するショートカットやインジケータはありません。 利益は心の状態から来ます。 指標は、お金の管理と成功の心理学と組み合わせて使用されるツールです。 ボリュームプロファイルの不均衡を見つけます。 取引価格のボリュームの不均衡。 多くの不均衡は、クローズとオープンおよびニュースで発生します。 株の買い手と売り手を参照してください。 5分から1時間使用して、誰が価格を管理できるかを確認し、価格の不均衡を見つけます。 より大きな在庫は15分以上です。 カラーボリュームバーの上にマウスを置くと、過去のバーの数が表示されます。 現在のバーの音量は上隅に書かれています。 ボリュームの不均衡を見つけて、しばらくの間価格がどの方向に進むかを確認します。 最良の結果を得るために支配的な傾向に従ってください トレンドが発生した場合は、トレンドをトレードするようにしてください。 トレーリングストップを使用し、大量の反転の不均衡に注意してください。
GoldBuyBackScalper
Thomas Bradley Butler
4 (1)
このインジケーターはXAU / USD、1分足チャートのみを対象としています。 すべてのペアには、独自の特性と価格変動があります。 このインジケーターでV字型の反転をトレードします。 頭皮はトレーリングストップを使用して購入し、ニュースはより極端で突然の売りを引き起こす可能性があるため、ニュースを避けます。 バックテストで1分の時間枠にアタッチし、反転購入を確認します。 インジケーターが再描画または再計算されることはありません。 活動時間中のみの取引 このインジケーターはXAU / USD、1分足チャートのみを対象としています。 すべてのペアには、独自の特性と価格変動があります。 このインジケーターでV字型の反転をトレードします。 頭皮はトレーリングストップを使用して購入し、ニュースはより極端で突然の売りを引き起こす可能性があるため、ニュースを避けます。 バックテストで1分の時間枠にアタッチし、反転購入を確認します。 インジケーターが再描画または再計算されることはありません。 活動時間中のみの取引
This is based on short term strength or weakness and not on moving averages.  Moving averages are used for filter only. Trade supply and demand with arrows. Supply and demand breakouts and strength of the buyers or sellers .  Don't trade buy arrow to sell arrow.  Trade the strength with trendlines or moving averages and use stops.  The arrow can have some strong moves.  Trade on all time frames.  Try it out in the back tester. The pips can be made with this indicator, follow the arrows and make
Master scalping with this indicator.  Trade on any time frame for scalps on buy or sells.  Follow trends using a 200 moving average and stops and targets.  Use with your own system.  This indicator can give pips if following it correctly.  Stick to rules and pick up pips daily.  Use as entries in a trend, scalp for a few pips or exit on opposite signal.  Best to follow higher time frame trends. Indicator doesn't repaint or recalculate. Rules: Don't trade overnight, only trade during active sessi
This indicator is good for small time frames like 1 and 5 minutes and made for day trading. The indicator never repaints or recalculates. The indicator works is for trading swing points in day trading, following bulls or bears.  Its a simple to use, non cluttered indicator with a high success rate.  This indicator works well to capture ranges.  All indicators come with limitations and no indicator or system is always accurate. Use money management for long term trading success.   Place in backte
DTKGold
Thomas Bradley Butler
This is the DayTradeKing for gold on a 1 minute time frame.  It is a different calculation for the range. Use a 200 period moving average as a filter.  Always use stops and avoid news, wait for more conformation.  This looks to capture intraday ranges. Put it in the back tester on 1 minute to see the price action and how it works. Trade with trend Use filter Use stops Alerts are added for pop ups and sound. 
Trade trends with the Super Scalper Use on all time frames and assets it is  designed for scalping trends. Works good on small time frames for day trading.  The arrows are easy to follow.  This is a simple no repaint/no recalculate arrow indicator to follow trends with.  Use in conjunction with your own system or use moving averages.  Always use stops just below or above the last swing point or your own money management system The indicator comes with push notifications, sound alerts and email
This indicator is a simple stripped down version of any advanced support and resistance indicator.  All the support and resistance indicators work from a number of bars that have developed over time. Get rid of clutter and confusing levels.  Find levels according to a number of bars. Look at days, session, numbers of hours, periods of consolidation.  Watch levels develop and use as breakout points, or areas of buyers and sellers.  Features and things to consider This indicator is for a frame of
https://www.mql5.com/en/market/product/57345 このEAは、外国為替反転インジケーターに基づいています。 システムを手動で取引したい場合は、インジケーターをダウンロードして試してみてください。 EAはトレンドに従い、それに応じてポジションをオープンします。 結果は、より低いドローダウンで安定したゲインを示していますが、バックテスター、オプティマイザー、および時間枠でそれを試して、何が機能するかを確認してください。 示されているすべての結果は架空のものです。 注:これはマーチンゲールやグリッドではありません。 インジケーターにはヘッジ機能があります このEAには以下の機能があり、リスクに応じて変更してください。 EAは自由証拠金に従って追加し、パラメーターに従って売買します。 入力を通じてリスクを管理します。 inp5は売りです inp7は購入です ストップロットを修正 固定テイクプロフィット   フリーマージンの%
HFTHacker
Thomas Bradley Butler
最適化における複雑さとユーザーの混乱のため、これは回復することなくシンプル バージョンに戻っています テストおよび使用前に EA を最適化してください。最適化した場合にのみ購入してください。これは、最適化の方法を知っており、自分の実力で利益を上げたいトレーダー向けです。リスク パラメータは自分で設定します。勝率が高く、うまくいかないトレードにはストップをかけます。リスクを減らして長く使い続けましょう。これはすべてのアカウントで機能し、リスク管理ツールです。すべてのコメント、説明、および MT5 バージョン: https://www.mql5.com/en/market/product/74421 このエキスパート アドバイザー (EA) は、トレーダーのアカウント残高に基づいてポジション サイズをスケーリングしながら、売買トレードを自動化します。そのコア機能は、取引サイズを動的に調整し、口座が拡大または縮小しても、リスクが利用可能な資本に比例するようにすることです。これにより、特定の取引で過剰なレバレッジをかけたり、リスクが少なすぎたりすることなく、一貫した取引戦略を維持できま
MarketMaker
Thomas Bradley Butler
需要と供給の取引を自動化します。市場を作る。 このEAは、誰もが販売および模倣する人気のある需要と供給の指標に触発されて作成されました。 EAは取引とヘッジを続け、市場を作ります。非ヘッジ口座でも取引できます。リスクを評価し、時間枠、ロットサイズ、ヘッジ機能を使用する必要があります。一度に複数のペアをオンとオフで合計約1か月間取引しました。 システムの概念: EAは需要と供給のレベルを交換します。レベルが変わるので、EAは新しいレベルを交換し続けます。より低いロットの多くのペアに分散することは、システムの機能です。安定したゲインを維持しながら、大きなドローダウンを回避する必要があります。 SLは使用できますが、これをオプションにするために説明したヘッジされた側面。私が多くのペアで小ロットで得ているドローダウンは4%であり、これはSLなしです。より大きなロットは6%を示しています。したがって、小さいサイズは控えめで、大きいサイズはより積極的です。これらは、残高と比較して取引されるロットを低く保つ理由です。貿易は発展する余地が必要です。 特徴: 取引数 固定ロット ボリュ
Top Trader
Thomas Bradley Butler
Top Trader Indicator This is an arrow reversal indicator. This is with deviations and arrows.  Trade a blue arrow for buy and trade a red arrow for sell.  Change the time period and the deviations of the bands.  This is similar to others but these arrows don't repaint.  Load in back tester and study which periods and deviations work the best.  It works on all time frames.  15 min to 1 hr would give good results for take profits.  Try according to your own risk management.
Quant Bot
Thomas Bradley Butler
Quant Botは、EUR / USDの1時間の時間枠でのトレンド取引用です。 セットファイルはありませんが、他のペアを使用する場合は、最適化が必要になる場合があります。 ボットについて: 遺伝子生成を使用し、ATRを使用して取引します。 カーブフィットを防ぐためにウォークフォワード期間が使用されました EAはすべての取引でストップを使用します。 お金の管理は、バランスの%でスケールアップします バックセット期間は2003年から2020年までであり、前進は2020年から2022年まででした(写真を参照)。 Quant Botは、EUR / USDの1時間の時間枠でのトレンド取引用です。 セットファイルはありませんが、他のペアを使用する場合は、最適化が必要になる場合があります。 ボットについて: 遺伝子生成を使用し、ATRを使用して取引します。 カーブフィットを防ぐためにウォークフォワード期間が使用されました EAはすべての取引でストップを使用します。 お金の管理は、バランスの%でスケールアップします バックセット期間は2003年から2020年までであり、前進は2020年か
Crypto Net
Thomas Bradley Butler
Crypto Netは、1時間の時間枠でBTCUSDを取引するためのものです。 それは戦略を進化させるために遺伝的進化を使用します。 このEAトレードトレンドは、ATRと一目の嘘の指標に続いています。 これは構築され、モンテカルロやウォークフォワードを含む一連の堅牢なテストに合格しました。 入力: 最小リスクであるアカウントの割合。 最大ロット数 取引を停止する時間 他に何も変更されていません。 フォワードのみのトレード。 バックテストはありません。 ブローカーの時間は、戦略が組み込まれたものとは異なります。 Crypto Netは、1時間の時間枠でBTCUSDを取引するためのものです。 それは戦略を進化させるために遺伝的進化を使用します。 このEAトレードトレンドは、ATRと一目の嘘の指標に続いています。 これは構築され、モンテカルロやウォークフォワードを含む一連の堅牢なテストに合格しました。 入力: 最小リスクであるアカウントの割合。 最大ロット数 取引を停止する時間 他に何も変更されていません。
PropTrader
Thomas Bradley Butler
*使用前にEAを最適化してください* EUR/USD向けに最適化された外国為替取引戦略 Expert Advisor (EA) を使用して 1 ~ 2 年以内に多額の富を達成するというのは非現実的な主張です。 バックテストと実際の取引は、EUR/USD 通貨ペアに焦点を当てています。 この戦略について: これは私たちの戦略の最初の反復を表しており、さらなる進歩の可能性があります。 100% 品質のデータを使用して厳密にテストされており、MT4 エラーはありません。 この戦略は、トレンドフォローの論理原則に基づいて機能します。 トレンドが強気の場合、EA が開始してトレーリング ストップを展開します。逆の場合も同様です。 本質的には、これは単純なトレンド追跡アプローチです。 主な利点と考慮事項: 簡単なセットアップ: デフォルト設定をそのまま使用し、好みに応じてロットサイズを変更するだけです。 リスク管理: この戦略ではマーチンゲールやヘッジは使用されません。 リスク軽減: 各取引には、アベレージ トゥルー レンジ (ATR) によって決定されるトレーリング ストップおよび
Down Under
Thomas Bradley Butler
ダウンアンダーは1時間の時間枠でAUD/USDペアを取引します。 このEAはATRとOHLCをトレードします。 この時間枠でこのペア用にフォーマットされます。 複利は分で使用されます。 ロットサイズと最大。 ロットサイズ。 残高のパーセンテージは、勝ちトレードで合成されます。 バランスが変動すると、ロットサイズも変動します。 設定: mmリスク% mmロット 最大ロット 他に変更するものはありません。 これには、マーチンゲールまたはヘッジ機能はありません。 変更する他の機能は、取引している場合、AUD/USDのCFDのみです。 ブローカープラットフォームでこれを小数点以下で変更します。 リスク免責事項 先物、オプション、通貨取引はすべて大きな潜在的な見返りがありますが、大きな潜在的なリスクもあります。 これらの市場に投資するには、リスクを認識し、喜んで受け入れる必要があります。
Cable Trader
Thomas Bradley Butler
GBP/USD 1hr.  このEAは勢いとセッションを交換します。 これには固定ロットコンポーネントがあり、開発中にTPを変更し続けます。 設定: ロットサイズ 他に変更するものはありません。 これには、マーチンゲールまたはヘッジ機能はありません。 変更する他の機能は、取引している場合、GBP/USDのCFDのみです。 ブローカープラットフォームでこれを小数点以下で変更します。 リスク免責事項 先物、オプション、通貨取引はすべて大きな潜在的な見返りがありますが、大きな潜在的なリスクもあります。 これらの市場に投資するには、リスクを認識し、喜んで受け入れる必要があります。 リスク免責事項 先物、オプション、通貨取引はすべて大きな潜在的な見返りがありますが、大きな潜在的なリスクもあります。 これらの市場に投資するには、リスクを認識し、喜んで受け入れる必要があります。
Euclidean
Thomas Bradley Butler
ユークリッドは、私が8年前に思いついたユニークな取引アルゴリズムです。 このEAはこのシステムの一部です。 閉鎖系として機能します。 EAは、トレンドをキャッチするために角度の程度が正しいときに購入を開始します。 ストップロスは角度から10%です。 とても簡単です。 入力: ロット1マイクロロットの残高の%($ 1,000) ボリューム上位ロット=ロットの最大量 利益レベルを取る=デフォルトは50ピップス 方法と考慮事項: ストップロスが組み込まれており、10%の角度で価格に応じて取引されます。 テイクプロフィットは50ピップスに設定されていますが、希望する金額にすることができます。 1分から5分のような短い時間枠で取引します。 バックテスターでこれをテストする際のエラーはありませんでした。 プラットフォームやブローカーが異なればデータも異なるため、テストするデータのダウンロードを確認してください。 外国為替取引のリスク免責事項 証拠金で外国為替を取引することはリスクが高く、すべての投資家に適しているとは限りません。 過去のパフォーマンスは将来の結果を示すものではありま
Pip Scalper
Thomas Bradley Butler
みんなのための指標 Pip Scalperは、スキャルピングトレンド用です。 この指標を使用して、トレンドに長くとどまります。 すべての時間枠とアセットで機能します。 このツールで毎日のピップを拾います。 200の移動平均を使用して取引をフィルタリングします。 より短い時間枠をお勧めします。 デイトレードに使用します。 使用方法と使用方法: Pips Scalperは、長期的なトレンド取引に基づいています。 青で購入 赤で売る フィルターとして200移動平均を使用し、アクティブな期間中に取引します。 Pip Scalperは、スキャルピングトレンド用です。 この指標を使用して、トレンドに長くとどまります。 すべての時間枠とアセットで機能します。 このツールで毎日のピップを拾います。 200の移動平均を使用して取引をフィルタリングします。 より短い時間枠をお勧めします。 デイトレードに使用します。 使用方法と使用方法: Pips Scalperは、長期的なトレンド取引に基づいています。 青で購入 赤で売る フィルターとして200移動平均を使用し、アクティブな期間中に取
Evolved Trends
Thomas Bradley Butler
テスト前に最適化し、最適な入力を見つけるために使用します こんにちは、トレーダーの皆さん! MT4 プラットフォーム用の最先端の Expert Advisor が必要ですか? 進化したトレンド以外に目を向ける必要はありません。 機械学習テクノロジーで作成されたこの強力な取引アルゴリズムは、1 時間の時間枠での GBP/USD の取引に焦点を当てています。 ただし、最適化のために他のアセットや時間枠を自由に試してみてください。 自分のリスク許容度に合わせて入力をカスタマイズするだけです。 ATR に基づくストップ機能と、利益を確定し、損失をカットする機能を備えた Evolved Trends は、あらゆる取引システムに最適な資金管理を保証します。 さらに、独自のリスク スケーリング機能がアカウント残高に基づいて調整されます。 Evolved Trends でトレーディング ゲームを次のレベルに引き上げましょう!
Trade any Forex combine out there.  Many prop firms offer challenge or instant funding combines.  The biggest problem is controlling the loss.  With this indicator you can get a visual system that can limit loss and teach discipline.  This uses the MACD and the strategy is scalping.  You can determine the risk and reward.  Visually follow small trends for scalps.  Trade during active sessions.  It's just a simple system to instill discipline while limiting loss and scalping pips with the paramet
Holy Grail arrow is for scalping.  The period you use will determine the trend.  You can try different time frames and periods to see what works best for your strategy.  Filters can be applied like a moving average or trendlines.  The 1 minute works good for scalps and always trade during active periods and avoid consolidation times.  Using other indicators to determine trends is recommended but this can also be a free flowing scalping system alone with tp and sl. Inputs: Period = trend period
OPTIMIZE EA BEFORE TEST AND USE No EA turns hundreds into millions in a year or 2.  This is a lie if presented this way. Trade Twenty Eight Forex Pairs.  Use this EA to trade the pairs and time frames with tp and sl according to risk.  This comes with advanced money management built in.  It has break evens and take profits on 50% with sl and tp accordingly.  1 hour recommended but try on others for intraday or swing trading.
Fulltrend
Thomas Bradley Butler
Improve trading with this indicator.  Find areas of buys or sells in Fibonacci retracement areas.  Fulltrend is for scalping and making swing trades.  Fib levels are added for take profits and stop losses. This works on any time frame and can be used by itself or together with other systems and indicators for filters. The indicator doesn't repaint.  Alerts are added and can be true or false.  No need to sit glued to the computer, just set on charts and listen or the alerts to come.  Take a posi
Scalping Code is for trend scalping.  It is simple to use and is profitable.  It can work on any time frame and any asset.  This indicator can be used on it's own or together with another system.  The arrow does not repaint or recalculate.   The rules are as follows:   A blue arrow above the moving average is a buy. An exit for the buy above the moving average is a red arrow or target. A red arrow below the moving average is a sell. An exit for the red below the moving average is a blue arrow
OPTIMIZE BEFORE BACKTEST AND USE FOR A YEAR TO FIND BEST VALUES Order Flow is unique in that is trades the volume.  It was built on EUR/USD and is optimized from  11/11/2021 to 10/24/2022 on 1 hour charts.  Optimization inputs for money management are used.  This EA uses strict money management, it is not a get rich quick martingale or EA without a sl. Trading is about risk management, not gambling.   Run on EUR/USD 1 hour chart or if you want to find other assets and time frames to optimize th
AI Signal
Thomas Bradley Butler
AI Signal is an indicator that is a ready to made scalping system that doesn't repaint Instructions: Load indicator.  Use arrows as entries in trends and stay out of sideways markets.  Trade with the larger trend and trade only active volatile hours Buy blue arrow above yellow and exit at red arrow or at discretion.  Sell red arrow below yellow and exit at blue arrow  or at discretion.  Easy to follow and is based on trends.  The indicator works on all time frames and assets. Use at your own d
*OPTMIZE* High Speed Low Drag trades XAU/USD on 1 hour charts.  The EA was made with machine learning and uses RSI and moving averages to trade its logic. By default the take profit is at 150 and stops are at 50 with additional advanced money management like movable stops.  I would suggest this if you have the know how but this is for beginner or advanced as is. The money management system scales the balance so you can figure what % you want to start and then the max lots to trade.
フィルタ:
レビューなし
レビューに返信