TPSpro RFI Levels MT5
- インディケータ
- Roman Podpora
- バージョン: 3.4
- アップデート済み: 21 1月 2024
- アクティベーション: 7
A key element in trading is zones or levels from which decisions to buy or sell a trading instrument are made. Despite attempts by major players to conceal their presence in the market, they inevitably leave traces. Our task was to learn how to identify these traces and interpret them correctly.
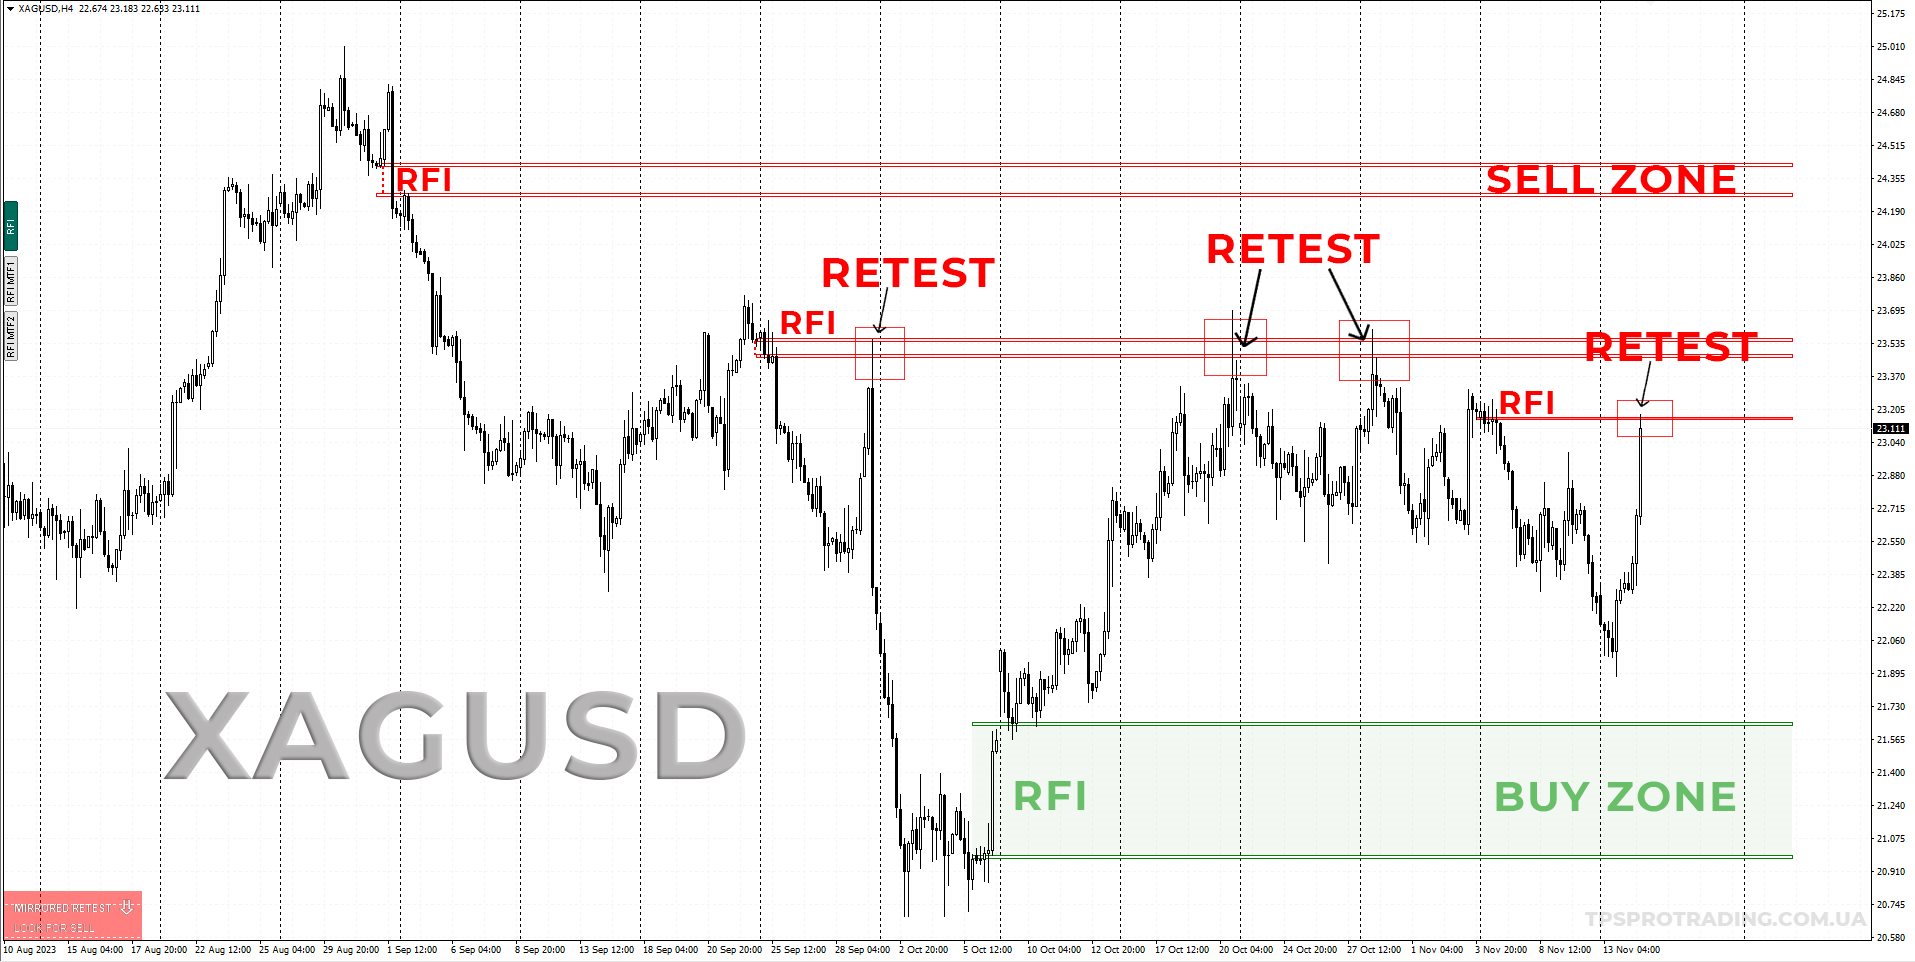
Reversal First Impulse levels (RFI)
- Version MT4 INSTRUCTIONS RUS ENG Recommended to use with an indicator - TREND PRO
Main functions::
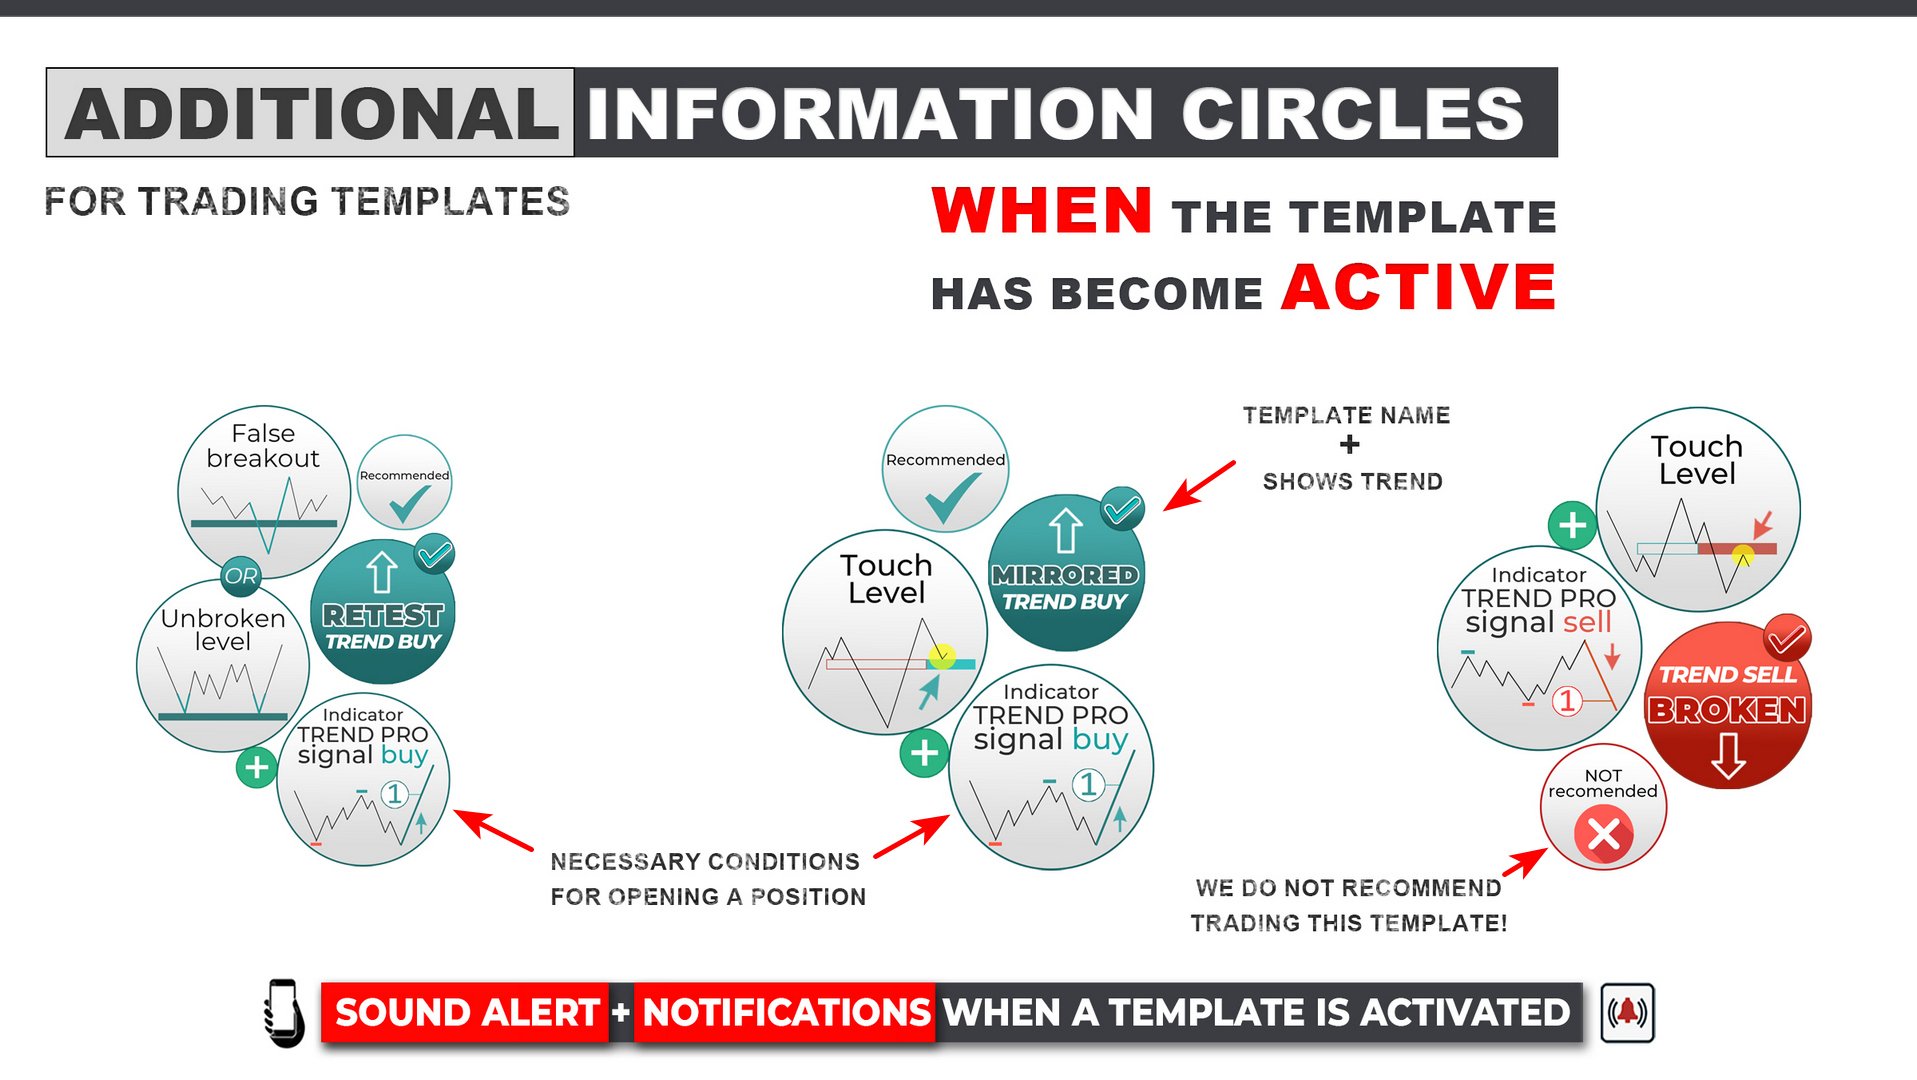
- Displaying active zones for sellers and buyers! The indicator showcases all correct initial impulse levels/zones for buying and selling. Upon activation of these levels/zones, where the search for entry points begins, the levels change color and fill with specific shades. Additionally, arrows appear for a more intuitive understanding of the situation.
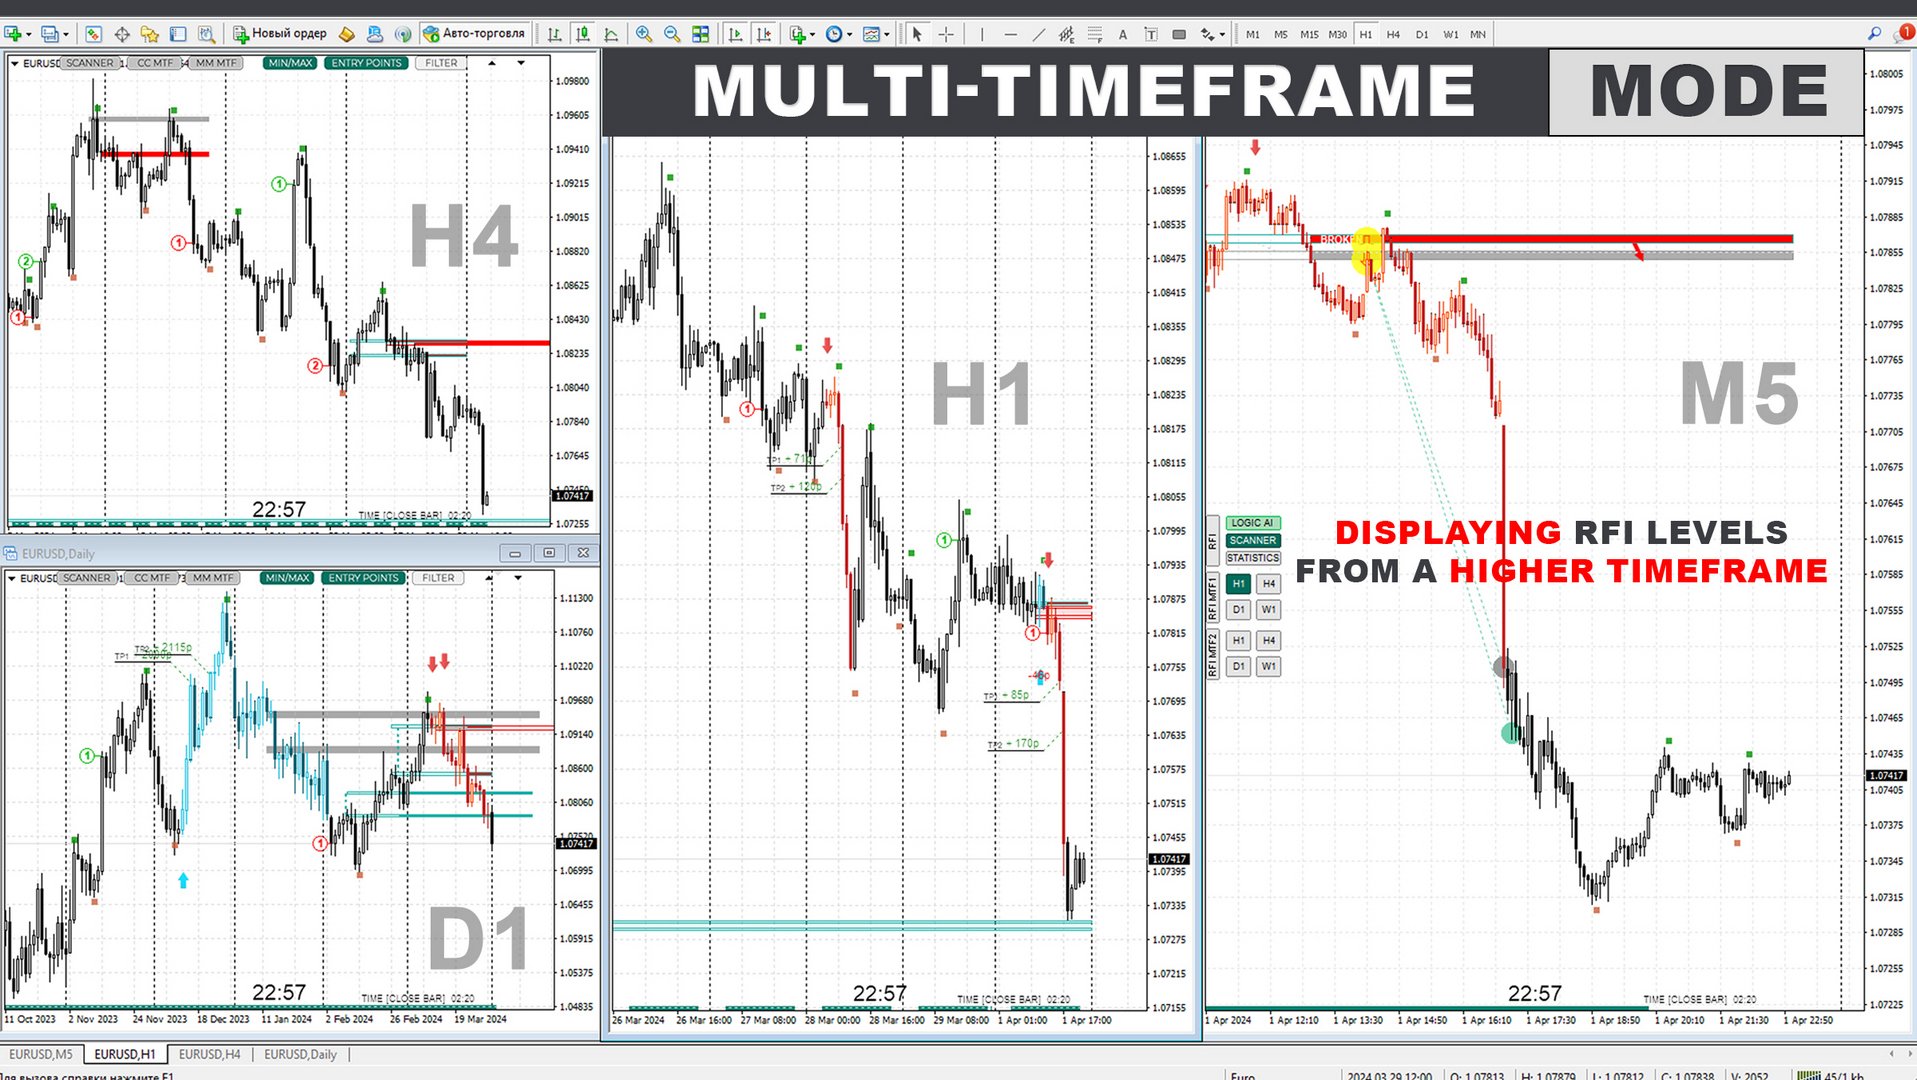
- Displaying levels/zones from a higher timeframe (MTF mode)
Added the function to display levels/zones using a higher time interval. Additionally, the indicator features an automatic trend detection function (TPSproTREND PRO).
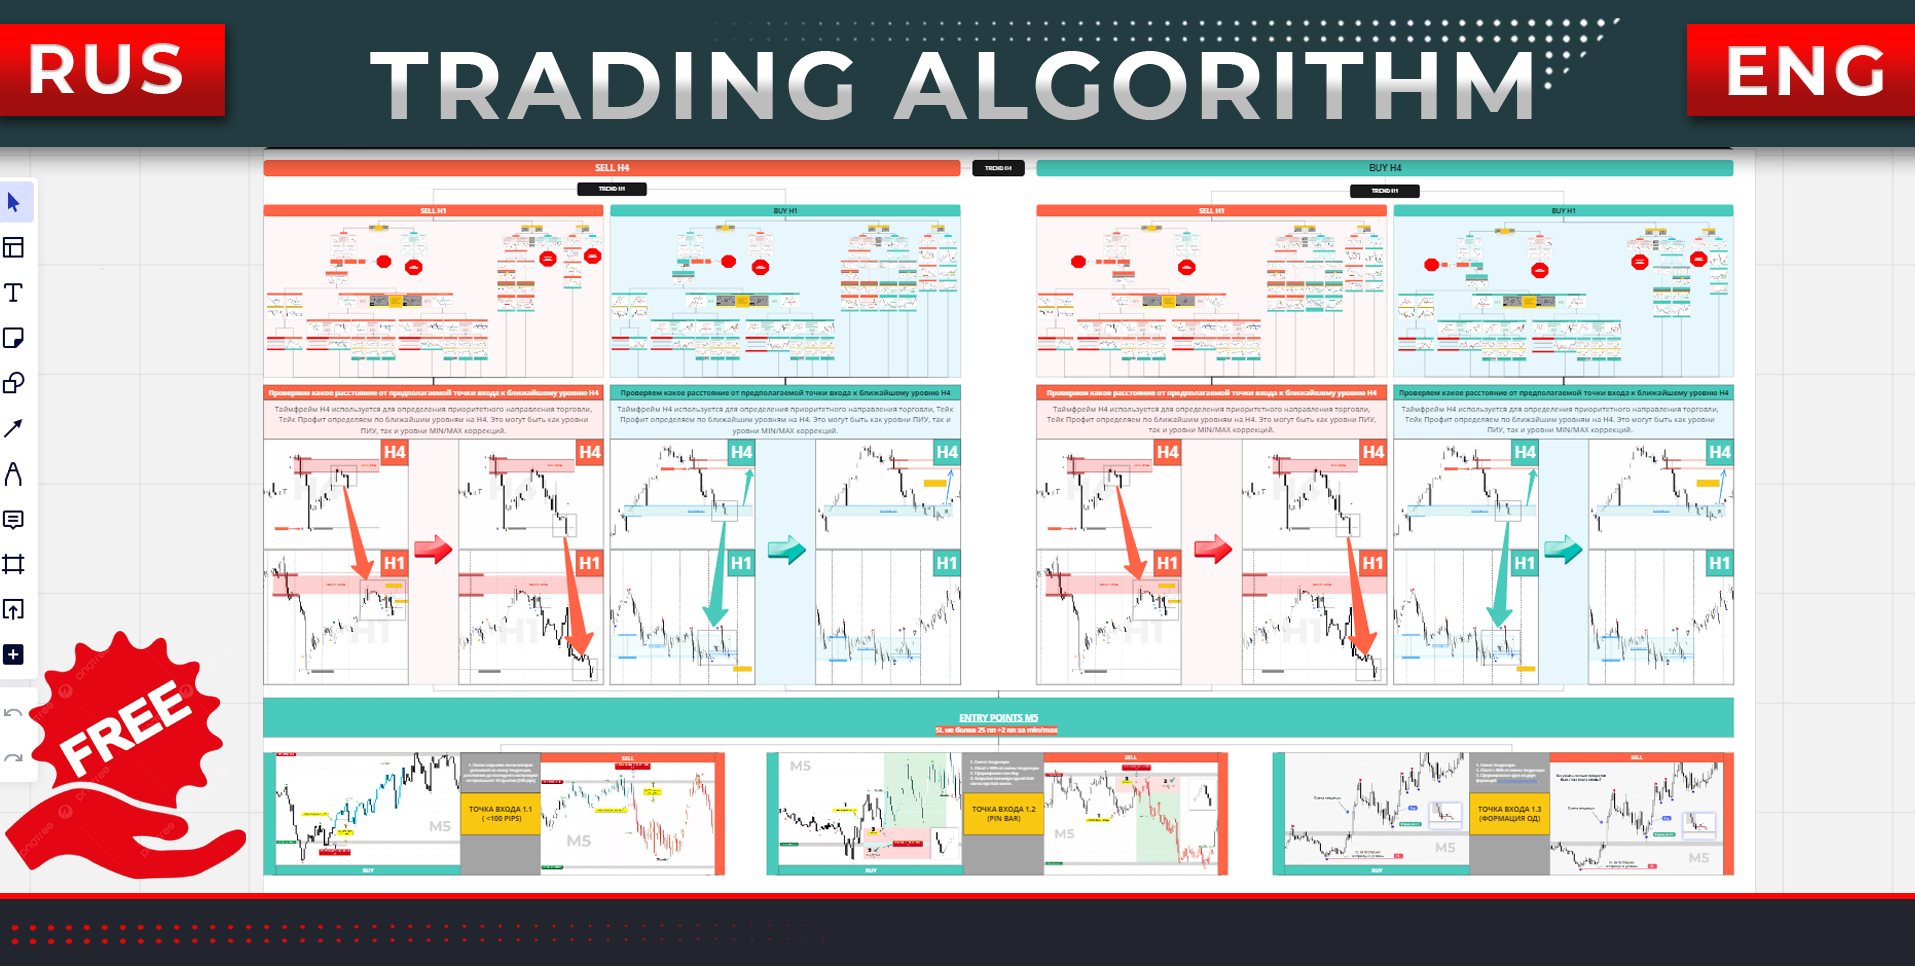
- A separate professional step-by-step algorithm for trading. The algorithm is designed for intraday trading, both following the trend and against it. A detailed instruction is provided for each active template.
- Works on various timeframes. The TPSpro RFI Levels indicator can be used on any timeframes on the chart, starting from the one-minute (M1) and going up to the monthly (MN).
- Graphic and sound alerts. The indicator provides both graphic and sound indications, ensuring you don't miss trade entry signals. Mobile phone notifications are also available.
- Simple and effective active pattern scanner. This is an extremely compact active pattern scanner that automatically alerts and sends notifications to your phone when patterns are activated across all timeframes in one direction.
- For experts and beginners.
A step-by-step video guide and instructions will explain how to work with the indicator using a specific example, even if you're doing it for the first time.
With this indicator you can:
- It is easy to determine levels for entry points into the market both behind the trend and against the trend.
- Determine goals (exit points) on any timeframe with high accuracy.
- Include levels (RFI) from a higher timeframe - MTF mode.
- There are only three templates for determining the priority for trading.
Hotkeys:
- R - Show all RFI levels on history
- Z - Hide/show panel


My personal opinion: this indicator is at least two levels above anything else here. I use it together with TrendPro, and the first effect is that instantaneously it cleared my mind and I could see what is important on the chart. This had two consequences: it helped me not to overtrade ( but to wait the right moment when it's important to trade ) and improved the odds for the trades taken at levels in accordance with the rules. These two consequences means an overall edge improvement. This indicator managed to catch the intrinsic logic of the market, and the AI logic embeeded it's crystal sharp - I still didn't see a losing trade from the yellow circle! OK, I know it will be, but still the win rate combined with risk-reward is clearly a wining card. It has even a psychological effect of relaxation, because I have always an overall image about what's going on, and there are only a couple of patterns to which I should react - nothing too complicated, but extremely efficient. The additional training videos and articles are also very educative - I catched the overall idea ( which is brilliant ) from the first sight. The author always had a very clear, to-the-point and helpful answer to any question I raised, generally in a matter of minutes. I feel like blessed to arrive in contact with this very affordable, efficient and finely tuned indicator, which will stay on my charts as long as MT5 will be alive! I still don't know why there are so little reviews here - probably the other customers are busy making their profits, there is no other explanation! :) Wonderful work, Roman!