YouTubeにあるマーケットチュートリアルビデオをご覧ください
ロボットや指標を購入する
仮想ホスティングで
EAを実行
EAを実行
ロボットや指標を購入前にテストする
マーケットで収入を得る
販売のためにプロダクトをプレゼンテーションする方法
MetaTrader 5のための新しいエキスパートアドバイザーとインディケータ - 37

このインジケーターは、「回帰チャンネルツール」のコンセプトに基づいた堅牢な市場分析手法を提供します。このツールを活用することで、トレーダーはチャートの回帰チャンネルに対して優れたコントロールを行い、より情報を得てトレードの決定を行うことができます。 回帰チャンネルツールは、トレーダーのツールボックスにおける強力な道具です。価格トレンドや潜在的なサポートと抵抗レベルに対する貴重な洞察を提供することを目的としています。このツールは特にトレンド内の修正波動を視覚化するのに効果的であり、価格のダイナミクスの包括的なビューを提供します。 以下は、このインジケーターを使用する際の主な特徴と利点について詳しく説明します: チャンネルレベルとサポート/レジスタンス: このインジケーターの主な利点の一つは、動的なサポートとレジスタンスゾーンとして機能するチャンネルレベルを生成する能力です。これらのレベルは潜在的なエントリーポイントや出口ポイントを特定するのに重要であり、トレーディング戦略の精度を向上させます。 修正波動レベル: 修正波動レベルを有効にすることで、トレーダーは大きなトレンド内での潜

Papa EA バージョン 6.0 は Big Boy バージョン 3.0 に基づいています。 新しい取引アイデアや機能が追加されました。 これにより、Papa EA は Big Boy よりもはるかに優れたものになります。考えてみてください。
そして入力はあまり変わっていません。 つまり、非常に使いやすいEAがまだ手元にあるということです。
BasicBalance を 55 (以上) に変更し、EA を 15 分 EURUSD チャートに設定するだけです。
>>> ライブ PAPA EA シグナル <<<
入力は次のとおりです。
1) ExpertComment (変更可能): 各取引に使用される基本的なコメント
2) ExpertMagic: BigBoy によって開かれた取引の一意の識別子
3) パネルの色: このドロップダウンを使用してパネルの色を変更します。
4) AutoLots: true の場合、EA は利用可能な残高に基づいてロットの自動計算を使用します。
5)FixedLots(AutoLots==falseの場合):上記のA

EA は高度な AI を使用して、米国セッション中の影響力の高いニュースの結果を利用して市場の方向性を検出します。 このシステムは、過去のデータを使用した古い指標に依存するのではなく、膨大な量のデータを瞬時にリアルタイムで分析し、利益目標に達するまで新しいトレンドの方向に向かって売買取引をトリガーします。
EA が動作するには、必ず「WorkMode」設定を「mode_Real」に変更してください。 Expert Advisor はニュース Web サイトに接続するため、[Tools] > [Options] > [Expert Advisors] で [Allow WebRequest] にチェックを入れる必要があります。 「 https://ec.forexprostools.com 」、「 https://worldtimeserver.com 」を追加し、「OK」を押します。
リアルタイムの結果はここで 確認できます 。 個人ボーナスを獲得するには、購入後すぐにご連絡ください。 設定・マニュ アルはこちら
EA は m1 チャートのすべての米ドルペアで動作します
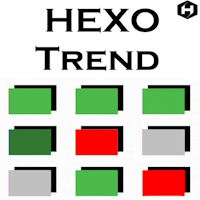
Hexo Trend は、金融市場を対象とした広範な研究開発作業を経て、最新の取引テクノロジーを導入した高度なトレンド トラッカーです。 私たちのインジケーターは金融市場で見られるフラクタル理論に基づいており、トレンドを特定し、中立的な市場センチメントの期間をフィルタリングします。市場でより収益を上げる方法はトレンド取引であることを理解しています。 トレンド取引は、現在の市場の動きの方向に取引します。 上方向: このような動きは強気の動きと呼ばれます。 下向きのトレンドは弱気と呼ばれます。 トレンドに従って運用するということは、同じ方向にポジションを持つことを意味します。 私たちのメソッドは、流れに逆らうよりも流れに乗って泳ぐほうが良いことを理解しているため、トレンドに合わせて行動する必要性を強調しています。 市場が動いている方向にトレードすることは、非常に簡単そうに見えて難しいことであり、主観的にトレンドを特定することに頻繁にさらされることを意味します。 現在の市場の方向でのトレードが成功するかどうかを決定する要因は数多くあります。たとえば、トレンドの「健全性」を定義することは常に困

Equity BotTrader は基本的にヘッジ手法を使用しますが、増分数を指定した分だけ勝ちポジションのボリュームを増分します。その全体的な目標は、口座の資本を指定された金額だけ増やし、すべてのオープン ポジションまたは保留中の注文をクローズすることです。 、そしてあなたが生きている中で最も裕福な人になるまで、最初からやり直してください。
これはMT5でのみ動作します。
例えば。
5ロットの買いポジションから開始します
買いポジションから 30 ピップス離れた同じロット サイズの 5 ロットで売りストップ注文をオープンします。
20 ピップス利益を得た人は、株式サイズに達するまでボリュームが増加し、すべてのポジションを閉じて新たに開始します。
---------
この EA はすべての口座サイズで機能し、USDJPY のような不安定な市場で最も有利であり、ピップの取得が早ければ早いほど、手仕舞いも早くなります。
使用する前にバックテストを行って、アカウントのサイズが少なくとも収益性があることを確認し、定期的に利益を引き出してください。
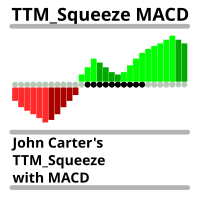
This indicator created based on original John Carter's TTM_Squeeze indicator and represents "squeeze" of the market which can be followed (or maybe not) by significant moves. Original indicator prints black dots when Bollinger Bands are inside Kelthner Channels and exactly this implemented in this custom version. Instead of original implementation as momentum indicator MACD indicator with standard settings 12-26-9 is being used. Mainly, the indicator is useful for understanding when it's better
FREE
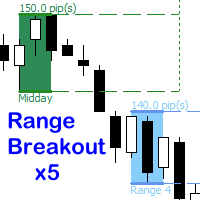
Trade multiple time range breakouts.
This EA offers up to 5 different time range zones all individually customizable. Bracket one candle or a whole range of candles. Enable all five ranges or just one. Each range have individual stop loss, break even or take profit options. Select the number of historical breakout zones to display on the chart. Each breakout zone indicates the number of pips in the range. Customise each range label in the EA, this will be displayed in the comments section of t

Original supertrend indicator in Tradingview platform. Indicator type: Price Action indicator Introduction: The Supertrend Indicator - Enhancing Your Trend Analysis. If you haven't yet found a Supertrend indicator with good graphics on the MQL5 platform, this is the indicator for you. Overview: The Supertrend Indicator is a powerful tool designed to provide traders with valuable insights into the current and historical trends of financial markets. It serves as a valuable addition to any t
FREE

After every 10 sales, the price is increased by $50 and the robot will ultimately cost $1,000
Introducing our newest robot built on a brand new strategy learned in neural network strategy. The robot makes trading decisions based on indicators built into the robot's strategies and price action. Our machine uses the latest technologies and adapts to the market in real time to obtain the best possible results. Together with our team of programmers, we have created a product of the highest quali

This is a simple Candle Stick Pattern Indicator, which shows in the current time period all standardisized Patterns in the chart. All Patterns will be calculatet automatically based on standard conditions. Following Candle Stick Patterns are included: Bullish Hammer | Bearish Hammer Bullish Inverted Hammer | Bearish Inverted Hammer Bullish Engulfing | Bearish Engulfing Piercing | Dark Cloud Cover Bullish 3 Inside | Bearish 3 Inside There are only a few settings at the begining to take. Every Pat
FREE
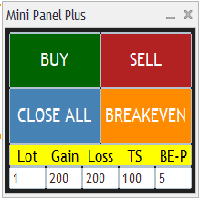
Remodeling the BoletaMiniPanel, the Mini Panel Plus has the same functionalities, but is now in the form of a box that allows it to be minimized and placed anywhere on the chart. Simple Panel with Stop loss (Loss), Stop gain (Gain), Trailing stop (TS) and Breakeven (BE-P). The Lot is the number of contracts to be traded. Gain is the number, in points, at which the stop gain will be positioned. If you don't want to place a stop gain, just put 0 (zero) in its place and when you open the order it w
FREE

Volume Profile is a very useful indicator . it allows you to spot the price levels where important price action took place. It is similar to support and resistance levels but with a different logic.
One of the first thing that traders mark up when analyzing a chart is support and resistance. Volume Profile can be used for doing that too.
The indicator scans the defined number of previous bars and calculates the volume of activity at each price level.
You can set the indicator to display t
FREE

Blue Moon Ai is a groundbreaking product based on artificial intelligence, specifically designed to continuously predict the price of the XAU/USD pair. With the ability to analyze a vast amount of historical data and employ advanced machine learning models, Blue Moon Ai can identify trends and forecast price fluctuations in the XAU/USD pair with remarkable accuracy and predictive capability. Blue Moon Ai is train in 2010-2022 whith real tick data, backtest in 2022-2023.
Update versions 4.1
BL
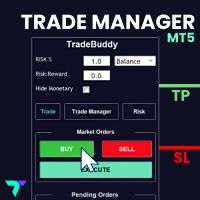
This adds an easy to use trading panel to your MetaTrader5 chart, enabling you to enter the market at lightning speed with your risk automatically calculated. Plus, it will help you automate your trade management with automatic & one click partial profits, stop loss to breakeven and more. Click here for the full Trade Buddy user guide If you want to test Trade Buddy before you purchase, please message us by visiting our profile and we will provide you with a 7 day free trial. Best of all, it’s c

xTrendでトレンドを一目瞭然に! メリット ・トレンドが一目瞭然:違う色と違う太さの上昇線、下降線、レンジ線が互いに繋がって指定された過去一定期間(Barの数)から現在までの全体的なトレンドが目立ちに表示されて裁量トレードを速やかに実現できる! ・Pipsが表示可能:そのトレンド線がどれほど変化したかはPipsの表示ですぐに明らかになる。 ・設定簡単:表示期間、各線の色と太さ、Pips表示、それだけの設定。もデフォルトの値は最適ですので 設定なしでもぜんぜんOK!アルゴリズムに関する難しいパラメターは一切なしので全てアルゴリズムに任せて良い! ・独自のアルゴリズム:長い年月に磨いた世界唯一無二のアルゴリズム、トレンド判断の正確率抜群! ・任意の時間足に適用 ・任意の銘柄に適用 ・任意のFX会社 に適用 ・MT4版・MT5版両方対応

This is the Full Version, to get the free version please contact me. The free version works on “GBPCHF” charts. All symbols and time frames scanner. Harmonic Pattern
Harmonic patterns are used in technical analysis that traders use to find trend reversals. They are considered one of the most accurate technical analysis tools, as they allow traders to predict the future price movement direction and the potential trend targets. Also, unlike many other technical tools, the number of false signal

SETTINGS Make sure to select Chart shift option in the chart.
(Right click in the chart ---> Properties (dialog box) ----> Select Chart Shift)
Kindly rate and comment about the product for upgradation & Support
When using candlestick timers, keep in mind that the timing of candlestick patterns can play a crucial role in your trading strategy. For instance, different timeframes (such as 1-minute, 5-minute, hourly, ) can provide varying insights into price movements and trends. Make sure t
FREE

GOLD ESCAVATOR TRADING BOT A trading bot for XAUUSD.
Lotsize is calculated by multiplying the lot factor by each 100 USD on account. You can adjust your risk level from 1 to 4 to suit your needs; Advisable to use account sizes of USD 200 and above. Account types: Hedge accounts, Standard accounts are preferred i.e. no commissions, Use well regulated brokers eg ICMarkets. all this provides room for the strategy to work smoothly for stabilized results and removing the possibility of the model
FREE

//// Forex Bulls GBPUSD ////
No Martingale ,No HFT ,NO Grid one Shoot Trader Make Sure to Active Weekdays input For Bcaktesting and Live
This Expert Working 5 day a week 12 month of years Live Signal =
FTMO Mode = unique strategy where it continuously splits a single trade into seven smaller trades. This means that each time the EA executes a trade, it automatically divides it into seven smaller positions. Forex Bulls GBP USD stands out from other expert advisors due
FREE

This is the Full Version, to get the free version please contact me. The free version works on “USDJPY” charts. All symbols and time frames scanner. Contact me after payment to send you the User-Manual PDF File. OVER and UNDER
Over & Under pattern is an advanced price action trading concept in the trading industry. The Over & Under pattern is more than a confluence pattern or entry technique than a trading strategy. It is a reversal pattern that is created after a significant obvious trend. I

Upon launching the script, you will need to specify three parameters: the desired Take Profit, an acceptable Loss level, and a Magic number. Following this, a panel with five buttons is generated: Close all trades - regardless of profit or loss. Close only BUY trades. Close only SELL trades. Close trades with profits greater than Take Profit. Close trades with losses exceeding Loss. All closures are performed ONLY based on the specified Magic number. The panel can be moved within the chart windo
FREE
This is the Demo version of the easy ea builder
With this version it takes 4 hours to create a robot and you cannot close the builder before you finish creating your robot other wise you will lose everything, this demo builder only works on demo accounts. The robots created on this builder only work on demo accounts and on EUR/USD only.
The easy ea builder enables you to build expert advisors/robots without writing a singe line of code. It can be used by anyone. you can combine as many indica
FREE

The indicator has only one parameter - the number of bars for analysis. The indicator calculates statistics for when the market was moving down, when it was moving up, and the number of bars for each movement. From this data, the average number of bars is calculated, which is displayed in the indicator window. If the indicator values sharply decrease, then the market is preparing for an upward movement. If the indicator values persist at high levels for an extended period, then the market is pre
FREE

The indicator based on Bollinger Bands parameters determines the bar's position and displays the value in the indicator window.
When a bar closes below the lower Bollinger Bands line, the indicator value becomes negative.
In such a case, one can expect an imminent market reversal and an upward movement.
When a bar closes above the upper Bollinger Bands line, the indicator value becomes greater than 1.
In such a case, one can expect an imminent market reversal and a downward movement.
It
FREE

The custom Bollinger Bands Height indicator measures and displays the current state of the Bollinger Bands indicator, showing whether the bands are widening (moving away from each other) or narrowing (starting to converge). Contraction, indicated by the narrowing of the bands, suggests that the current market movement is losing momentum and hints at the potential start of a new strong movement. This can be a signal to look for an opportune moment to enter a position, as a sharp price change ma
FREE
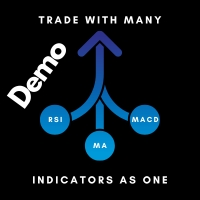
This is the demo version of the trade many indicators tool. it only works on EUR/USD on demo accounts.
Trade Many Indicators is a tool that enables you combine and use 30 plus indicators at the same time without the confusion or cluttering up your chat . You receive a bullish signal when most of the indicators you turned ON indicate bullish and you receive a bearish signal when most or the indicators you turned ON give a bearish signal. All the indicators are customizable to your own needs.
FREE
Dax index M5 Strategy
"AV Dax Breakout EA MT5" is an Expert Advisor for MetaTrader 5, which follows a DAX M5 opening strategy . Typically, no more than one trade is opened per day on the german index.
After trend determination with the "AV SuperTrend MT5" indicator and other conditions, a breakout trade is automatically opened as a pending order in the direction of the trend. If the conditions are not suitable, a retest trade can then be carried out and possibly later a retracement trade

Hello community, on this occasion I am pleased to introduce you to the EA called. Dex900 Down Fog, where it fulfills the function of passive inputs, with the help of the stochastic indicator, along with its 2 Emas of 7 and 21 to better focus on your entry points, The bot is used in a time frame of 15 Minute (M15) and the lot has to be modified, which is recommended. lot, 0.50 SL 500000 TP 600 Recommended Balance: 400 USD The rest is left as is, It also works for the Dex900 UP pair, but they are
Trade Many Indicators is a tool that enables you combine and use 30 plus indicators at the same time without the confusion or cluttering up your chat . You receive a bullish signal when most of the indicators you turned ON indicate bullish and you receive a bearish signal when most or the indicators you turned ON give a bearish signal. All the indicators are customizable to your own needs.
It also includes a tool to automatically calculate your lot-size and open positions depending on how you p
The easy ea builder enables you to build expert advisors/robots without writing a singe line of code. It can be used by anyone. you can combine as many indicators as you want and you can also customize their settings to suit your needs. You can choose to use the robot only for alerts and notifications or for auto-trading .The tutorial video explains every thing in detail. You own all the rights to the robot you create as it comes with its source code separate from the ea builder. All the robots

Being part of our trading system which is made up of three indicators: Hexo Trend - Main Indicator Hx Stochastic – Our version of the Stochastic Oscillator. Hexo Zones: made up of two indicators that help you enter and stay in a trend. Being a special moving average and our 07-color coloring rule. - Hx Moving Average: Average with special calculation, which tries to define the trend. Figuratively, we consider the average as the division into two zones. Above average zone, we only think about sh

Hello Community, here I present the EA called Super Sayan Crash500
It is a bot worked for the Crash500 pair of (Deriv)
where it has the strategy of,
Stochastic accompanied with a MacD,
with the right parameters to make entries at certain levels to hunt better
the trend candle!
It is used in a time frame of M5 (5 Minutes)
Recommended lot from 0.50 to 1 depending on the account balance,
It is recommended to start with a capital of 300 to 500 USD
The Stop Loss and Take Profit are

Hello community, I present to you the new EA called Crash300 Sniper Boss It is used only in the Crash300 pair From the broker (Deriv) has the strategy, of a stochastic together with 2 emas of 100 and 7 periods It is used in a time frame of 5 Minutes and is used with the lot 0.50 / 1.00 according to the account balance It is recommended to start with a balance of 300 USD The recommended Stop loss and take profit is modified TP 300 SL 30000 The rest is left as it comes, It is used in time from 5 M

The Stochastic Momentum Index (SMI), developed by William Blau and featured in the January 1993 edition of Technical Analysis of Stocks & Commodities magazine, introduces a unique perspective to trading analysis. Distinguished from the conventional Stochastic Oscillator, which evaluates the current close in relation to the recent x-period high/low range, the SMI assesses the close's position relative to the midpoint of this range. This innovation yields an oscillator with a range of +/- 100, re
FREE
Hello There,
i introduce about Swing Premium Forex Mt5 Indicator
it work all currency pair
it work all time frame,
100% non repaint, no delay
Swing trading is a method in which traders attempt to take advantage of market fluctuations. They buy a security when they believe the market will rise and sell if they feel the market will fall, which, as you can imagine, is common in most trading strategies, irrespective of trading style.
The four most frequently occurring patterns in the swing t

Indicador MAPS Indicador é um oscilador que faz o plot da Curva de Retorno de uma regressão de segundo grau para os preços de fechamento do ativo do gráfico. A Curva de Retorno é a linha central do indicador MAPS e representa a região de equilíbrio do preço entre vendedores e compradores. Os plots do indicador são: Linha central - C0 - cor da mesma varia de acordo com a tendência do mercado, sendo verde para tendência de alta e vermelho para baixa; Linhas superiores: S1, S2, S3 e S4, sendo que a
FREE

AT Scalper Helps trader to place order seamlessly Close mulitple position at a time Place SL or TP for multiple position in a click Place hedge order same time with predefined SL and TP Place multi layer pending order in a click Place martingale layer Be informed about SL and TP in currency Get to know time remaining in current candle Get to know current spread View PnL, Balance, Equity on screen
FREE

Basing Candles indicator is an automatic indicator that detects and marks basing candles on the chart. A basing candle is a candle with body length less than 50% of its high-low range. A basing candle or basing candlestick is a trading indicator whose body length is less than half of its range between the highs and lows. That's less than 50% of its range.
The indicator highlights the basing candles using custom candles directly in the main chart of the platform. The percentage criterion can be
FREE

The Average Cross System indicator is a versatile tool designed for traders using the MetaTrader 4 (MT4) platform. This indicator provides a straightforward yet effective way to identify potential buy and sell signals based on moving average crossovers, a widely used technical analysis strategy. Key Features: Moving Average Crossovers: The heart of the Average Cross System is the detection of moving average crossovers. It automatically identifies when a shorter-term moving average crosses above
FREE

Name: ICT MULTITF EA ️️
Description:
Our Price Action Expert Advisor is a powerful trading tool designed to help you make informed decisions in the dynamic world of financial markets. It utilizes a robust price action strategy across multiple timeframes, providing you with a competitive edge in your trading endeavours. Here are the key advantages and features of our product:
Advantages :
1. Profitable Trading : Our expert advisor is built on a proven price action strateg

JCRC风险控制EA 1.显示账户信息 姓名、账号、净入金 余额、净值、持仓 日收益(收益率) 周、月、总收益(收益率) 2.风险控制模块,选择性 按净值风控、按百分比风控,默认全都关闭,自行调整。 ①选择性启动:日熔断,昨日结算余额计算当日比例,浮亏达到,则立即强制平仓,今日不得交易,第二交易日恢复交易。 ②启动风控直接开启本金强平机制:本金回撤直接强制平仓,作为风控第三方后台,通知该交易员,账号已经冻结,不得交易。 ③按净值强平,到达则强平。 可以定制风控,日熔断比例,本金回撤比例,可以作为第三方风控,监管旗下交易员。禁止权力绕过制度,给个人或团队公司造成重大的损失。 备注:如需帮助联系邮箱:16692618587@163.com
FREE
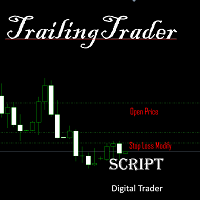
啟用TrailingTrader腳本後 報價視窗的交易品種 將會進行移動止損
設定參數 TrailingDistance 啟動移動的點數 TrailingCallBack 移動止損的回調點數
工作原理 持倉單在獲利的條件下 市價超過設定的點數時 腳本自動設定止損線在市價回調的點數位置 當市價繼續往獲利的方向運行時 止損線會持續往運行方向調整 直到市價回調到止損線時獲利平倉 當同一品種持有多張持倉單時 移動止損會分開運行 當盈利超過一定的範圍時 移動止損線會形成同步狀況
特點 當交易員習慣手動開單 又無法長時間盯盤時 可以啟用移動止損 當持倉單一旦觸發工作 就可以確認該單會在獲利的條件下出場
起用條件 需要使用MT5交易的電腦全天候開機運行 可以啟用腳本後 再同步到官方VPS 此時同步的腳本可以全天候監視交易帳戶
FREE

Basic Gold Predictor is a sophisticated Expert Advisor meticulously crafted for traders and investors with a keen interest in the precious metal, gold. This advanced algorithm combines the power of multi-timeframe analysis and fundamental technical analysis to provide accurate and timely predictions for gold price movements.
Key Features: Multi-Timeframe Analysis: Basic Gold Predictor leverages multiple timeframes, from short-term intraday charts to longer-term daily charts. By considering var

Hello My Dear Friend,
im introduce about Binary Option Premium V8
it work, all currency pair
1 minute time frame,
1-5 minute expire
100% non repaint,
no delay signal
Alright. This indicator works on MT5 and is very easy to use. When you receive a signal from it, you wait for that candle with the signal to close and you enter your trade at the beginning of the next new candle. A red arrow means sell and a green arrow means buy. for easy identification of trade signal. Are you okay with tha

This product is designed for the MT5 platform and offers two key features: VWAP (Volume Weighted Average Price) calculation and Volume Profile analysis. Advantages: VWAP Calculation: The product calculates the VWAP, which is a popular indicator used by traders to determine the average price of a security based on its trading volume. It helps identify potential buying or selling opportunities by comparing the current price to the average price weighted by volume. Volume Profile Analysis: The prod

This pass-band oscillator seeks to pass-band out both high and low frequencies from market data to eliminate wiggles from the resultant signal thus significantly reducing lag. This pass-band indicator achieves this by using 2 differenced EMA's of varying periods. (40 and 60). Trigger points for the pass-band oscillator are added with a RMS cyclic envelope over the Signal line. Output of the pass-band waveform is calculated by summing its square over the last 50 bars and taking the square root of

Divergence Detection: The indicator is designed to identify divergences between the price movement and the Stochastics oscillator. This can help traders spot potential trend reversals or trend continuation opportunities. Early Warning System: By capturing divergences, the Stochastics Divergence Indicator can provide an early warning of possible market turning points. This allows traders to take timely action and make informed decisions. Versatility: The indicator can be applied to various finan
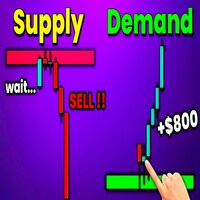
Best Solution for any Newbie or Expert Trader! This indicator is a unique, high quality and affordable trading tool because we have incorporated a number of proprietary features and a new formula. With this update, you will be able to show double timeframe zones. You will not only be able to show a higher TF but to show both, the chart TF, PLUS the higher TF: SHOWING NESTED ZONES. All Supply Demand traders will love it. :)

Otto is an expert advisor (EA) that utilizes proprietary indicators and trend lines while implementing a robust risk management strategy. It focuses on generating consistent and secure profits over the long term. By employing a fractional lot approach across various currency pairs, it effectively diversifies risk and increases trading opportunities for generating profits. Additionally, Otto can be applied to trading gold to potentially yield substantial returns. The EA executes daily transactio

Unlock the power of precise trend analysis and supercharge your trading strategy with Momentum Trend on MT5! Our cutting-edge trading tool is designed to provide traders with the essential insights and data needed to navigate the dynamic world of financial markets. Key Features: Accurate Trend Analysis : Momentum Trend utilizes advanced algorithms to accurately identify market trends, helping you stay ahead of the curve and make informed trading decisions. Real-Time Data : Stay updated with real

ATR Stops is an indicator which shows Dynamic support and resistance lines by considering ATR value and also a multiplier. its highly effective to find out the trend direction and also is useful for using as stop loss levels. it could be used in different ways one usual way is to buy when line becomes green and sell when it becomes red. when its combined with money management rules and risk reward considerations there is good results.

Pivot Point Super Trend is another type of famous super trend indicator which is equipped with pivot points in different way. this indicator used to be available in the Trading view and this is converted from there to the MT5 language. MT4 version of the indicator is also available and you can find in my products. there are also buy/sell signals shown on the screen.

Important Note: Trend Starter Indicator (TSI) detailed settings manual, trading strategies (coming soon) and setfiles (coming soon) are available in this LINK The Trend Starter Indicator (TSI) provides traders with precise and actionable signals for potential market entry points. By capitalizing on the unique interplay of two internal oscillators combined with astute price action monitoring, TSI optimizes and simplifies the decision-making process in the dynamic world of trading. But that'
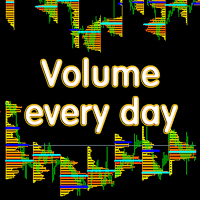
Основные отличия и преимущества индикатора Volume every day от похожего продукта Volume Profile V6 В Volume every day можно параметром Range period задать временной диапазон построения профиля, а параметром Range count задать количество профилей данных диапазонов. Например, на втором скрине Range period=1Day, а Range count=10 - это значит, что профиль будет строиться на периоде один день, десять последних дней. Важно, что переключение тайм фрейма графика не влияет на построение профиля, что т

The VIX Fix is a volatility indicator developed by renowned trader Larry Williams. It's designed to measure volatility in assets that don't have options or futures, such as individual stocks and forex markets. Essentially, it acts as a synthetic VIX (Volatility Index) for any asset , providing a gauge of market uncertainty. This modified version of William's indicator helps you to find market bottoms and market tops. It comes with 2 styles: Stochastic and histogram style. Please see screenshots

Special Offer ... It is totally free for all. New one coming soon...................
About This Indicator: RSI vs SMA Indicator: A Comprehensive Technical Analysis Tool for Better for Identify the Short and Long Signals.
The RSI vs SMA Indicator is a powerful technical analysis tool designed to understanding Market Price Fluctuation for Long or Short signals. This user-friendly Indicator good for both novice and experienced traders, providing valuable indication in price chart and separate wi
FREE

About This Indicator: RSI vs SMA Oscillator: A Comprehensive Technical Analysis Tool for Better View of Market Price
The RSI vs SMA Oscillator is a powerful technical analysis tool designed to understanding Market Price Fluctuation for buy or sell signals. This user-friendly Oscillator good for both novice and experienced traders, providing valuable insights into market trends and price movements. Key Features: - RSI Cross Alert: The indicator is based on the Relative Strength Index (RSI), a po
FREE

Introducing Laforeze , a trend-based EA designed for trading on the US30 index specifically on the daily timeframe.
To look at live result follow this trading signal Laforeze ! Laforeze utilizes four key indicators - RSI, MA, ATR, and RVI - to accurately determine its trend direction. With this approach, it aims to provide high-quality trades rather than focusing on quantity. T o ensure flexibility and customization for traders, Laforeze offers adjustable parameters that allow you to fine-tun
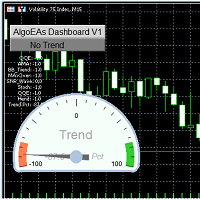
AlgoEAs Trend Dashboard V1 Indicator for MT5
Introduction: This is a Dashboard Indicator based on 7 built in Multi Timeframe indicators. This strategy gives Buy/Sell Ideas based on 9 trend states. Easy to view gas guage to view current trend. Has as optional Alerts to enable with 9 messages. Run on M15 chart, with M15, H1, and H4 indicator time frames. Great tool!
Features: Non-Repainting Dashboard For Desktop MT5 Only, Works On Any Mt5 Pair Great for Intraday and Swing Trading Easy view ga

ShadowMate EA: Your Seamless Trading Ally
For traders who want the edge, ShadowMate EA acts as a silent partner, streamlining your trading process so you can focus on what truly matters. Whether you're trading from the Metatrader mobile app or tired of the nitty-gritty calculations for each trade, ShadowMate handles the fine print, letting you concentrate on the bigger picture.
Key Features:
Instant Oversight: Monitors all manual opened trades, regulating SL/TP levels for precision. Adaptabl

This Automatic support/resistance indicator calculates various peaks and troughs of the price action, identifies relevant levels and draws support and resistance automatically. It uses the built-in "ZigZag" indicator in Metatrader as a data source hence, very much accurate indicator. The support and resistance lines are contineusely updated as new levels and formed. The indicator has only 5 parameters to set, and mostly it can be used with the default values: The description of the settings is

请使用欧元兑美元货币对,进行交易,参数设置如截图所示,你也可以自己进行测试和回测,获得适合你的参数,希望你交易顺利。如何确认市场走势结构级别之间的关系是很多交易者的共性问题,也是比较棘手的问题,因为对于市场走势级别的关系的确认也是确认交易市场走势的关键入场位置结构和离场的位置结构,甚至是拓展一下可以涉及到交易走势的加仓和减仓的位置逻辑。
当然这里我要说,做交易还是要具有一致性转一性,我这么说或许很多交易者还不是很清楚,说以我觉得有必要说的详细一些。
重点: 做交易,至少对于很多交易新手来说或者说没有到交易水上的(水上=交易不亏损or交易小盈利)也就是交易账户目前属于不亏损状态的或者有稳定逻辑清晰的交易系统体系规则,不要觉得我很碎碎念。因为真的想帮助大家解决问题,有些细节真的很重要。

Deeptrader AIは、人工知能と従来のテクニカル分析を組み合わせて市場の動きを予測する複雑で斬新なアルゴリズムです。このExpert Advisorは、テクニカル分析指標からのデータを使用して訓練されたリカレント・ニューラル・ネットワーク、特にLong-Short-Term-Memoryセルを使用しています。この方法により、EAは将来の値動きに最も関連する指標を学習し、それに基づいて行動することができます。さらに、LSTMネットワークは短期と長期の両方の履歴データを考慮できるため、時系列分析に特に適しています。 注:これは 限定販売 です:このEAは現在の価格で 10本中1本のみ 販売されます。次回価格: 999ドル このEAの価格は、このシステムで取引するユーザー数を制限するために、着実に値上げされます。 ライブ信号: https://www.mql5.com/en/signals/2061655 MT4バージョン: https://www.mql5.com/en/market/product/104723 重要: 追加情報や特典をご希望の方は、商品ご購入後、PMを通して直接

Zenvo EA は、オープンかつ完全に自動化された多通貨取引システムです。
Only 1 Copies of 10 Left for 645 $ Next Price 1290 $
Zenvo ガイド 信号 最適化 アップデート Not Grid , Not Martingale , Not AI , Not Neural Network. Default Settings for One chart AUDCAD H1 (Supports 1OHLC mode for weak PCs) 現在のパターンは以下に基づいて特定されました。 前向き最適化 アルゴリズム (FOA) 2022 年 12 月まで。 これは、現在 脆弱性 市場ではすでに 顕現する 2023 年 1 月から今日まで。 2022 年 12 月以降はすべて 継続 現在のデフォルト設定での取引の説明。 各ポジションには常に 固定SL そして ドローダウン中であっても、 完全な取引追跡

OrderManager をご紹介:MT5用の革新的なユーティリティ 新しく設計されたOrder Managerユーティリティを使用して、MetaTrader 5での取引をプロフェッショナルなものにしましょう。シンプルさと使いやすさに焦点を当てたこのユーティリティは、各取引に関連するリスクを簡単に定義し、視覚化できます。これにより、情報に基づいた意思決定が可能になり、取引戦略を最適化できます。OrderManagerに関する詳細は、マニュアルをご参照ください。 [ マニュアル ] [ MT4 バージョン ] [ Telegram チャンネル ]
主な特長: リスク管理:取引のリスクを素早く簡単に定義し、より良い意思決定を行い、取引パフォーマンスを向上させます。 視覚表現:オープンなポジションとそれに関連するリスクをグラフィカルに表示し、明瞭かつ簡潔な理解が可能です。 注文変更:数回のクリックで注文を簡単に変更またはクローズし、取引プロセスを効率化し、貴重な時間を節約します。 手のひらの上の最新ニュース:ボタン一つで最新の市場ニュースに常にアクセスできます。
MT5トレーダーにと

Moving Average Convergence Divergence(MACD)トレーディング戦略は、勢いとトレンドの方向の変化を特定するために使用される人気のあるテクニカル分析ツールです。 MACDは、26期間の指数移動平均(EMA)から12期間のEMAを引いて計算されます。 MACDの上には、トリガーとして機能する9期間のEMAである「シグナルライン」がプロットされます。 MACDラインがシグナルラインの上にある場合、MACDはブルッシュ領域と見なされ、下にある場合はベア領域と見なされます。トレーダーはこの情報を使用して、潜在的な買いと売りの機会を特定することがよくあります。 MACDは多目的な指標であり、さまざまな方法で使用できます。一般的な使用方法のいくつかは次のとおりです。 クロスオーバー:MACDラインがシグナルラインを上回るときにはブルッシュクロスオーバーが発生し、MACDラインがシグナルラインを下回るときにはベアクロスオーバーが発生します。 ダイバージェンス:MACDが新しい高値をつけている間に基礎となるセキュリティがそうでない場合、ブルッシュダイバージェンスが発
FREE

QM (Quasimodo) Pattern is based on Read The Market(RTM) concepts. The purpose of this model is to face the big players of the market (financial institutions and banks), As you know in financial markets, big traders try to fool small traders, but RTM prevent traders from getting trapped. This style is formed in terms of price candles and presented according to market supply and demand areas and no price oscillator is used in it. RTM concepts are very suitable for all kinds of investments, includi

この製品は、ニュースタイム中にすべてのエキスパートアドバイザーと手動チャートをフィルタリングするため、急激な価格変動によるマニュアルトレードのセットアップの破壊や他のエキスパートアドバイザーによって入力された取引について心配する必要はありません。この製品には、ニュースのリリース前にオープンポジションとペンディングオーダーを処理できる完全な注文管理システムも付属しています。 The News Filter を購入すると、将来のエキスパートアドバイザーのためにビルトインのニュースフィルターに頼る必要はなく、今後はすべてのエキスパートアドバイザーをここからフィルタリングできます。
ニュース選択
ニュースソースは、Forex Factoryの経済カレンダーから取得されます。 USD、EUR、GBP、JPY、AUD、CAD、CHF、NZD、CNYなど、任意の通貨数に基づいて選択できます。 Non-Farm(NFP)、FOMC、CPIなどのキーワード識別に基づいて選択することもできます。 影響レベルによってフィルタリングするニュースを選択することができ、低、中、高の影響範囲から選択できます

Heracles Indicatorをご紹介します。このインジケーターを使用すると、分析を行う必要なしに簡単に取引できます。自動的にビルドアップゾーン、エントリーポイント、明確な利益確定レベルを特定します。
Heracles Indicatorは、価格が購入または売却のエントリーポイントに到達した際にアラートを表示し、信号矢印を表示し、さらには利益確定のための3つのレベルを提案します。
これは初心者トレーダーとプロトレーダーの両方に適しています。
チャンネルサポート: こちらをクリック MT4バージョン: こちらをクリック
おすすめ:
時間枠:M5およびM15 通貨ペア:どの通貨ペアでも アカウントタイプ:ECN、RawまたはRazorで非常に低いスプレッド 推奨されるストップロス:50ピップスまたはハイ/ローゾーン 推奨される利益確定レベル:25ピップス、50ピップス、75ピップス
仕様:
1/ 自動的にビルドアップゾーンを描画します 2/ 自動的に購入/売却のエントリーポイントを提案します 3/ 高精度で3つの利益確定レベルを提案します 4/ 初心者向

説明:
「市場構造 HH HL LH LL」指標は、金融市場の価格動向を分析するための強力であると同時にシンプルなツールです。この指標は、トレーダーや投資家がトレンドの変化を特定し、価格時系列の重要なポイントを特定するのに役立ちます。
インジケーターの主要なコンポーネント:
HH (Higher High): 価格が前の高値を上回って終了する高値。 HH は上昇傾向の強さを示します。 HL (Higher Low): 価格が前の安値を上回って終了する最小値。 HLは上昇傾向の継続を確認します。 LH (Lower High): 価格が前の高値を下回って終了する天井。 LHはトレンド反転の可能性を示唆しています。 LL (Lower Low): 価格が前の安値を下回って終了する最小値。 LLは下降トレンドの始まりを確認します。
使い方:
「市場構造 HH HL LH LL」指標は、トレーダーや投資家が市場の現在の傾向を判断するのに役立ちます。上昇トレンドは HH と HL のシーケンスによって特徴付けられ、下降トレンドは LH と LL のシーケンスによって特徴付け
MetaTraderマーケットはMetaTraderプラットフォームのためのアプリを購入するための便利で安全な場所を提供します。エキスパートアドバイザーとインディケータをストラテジーテスターの中でテストするためにターミナルから無料のデモバージョンをダウンロードしてください。
パフォーマンスをモニターするためにいろいろなモードでアプリをテストし、MQL5.community支払いシステムを使ってお望みのプロダクトの支払いをしてください。
取引の機会を逃しています。
- 無料取引アプリ
- 8千を超えるシグナルをコピー
- 金融ニュースで金融マーケットを探索
新規登録
ログイン