YouTubeにあるマーケットチュートリアルビデオをご覧ください
ロボットや指標を購入する
仮想ホスティングで
EAを実行
EAを実行
ロボットや指標を購入前にテストする
マーケットで収入を得る
販売のためにプロダクトをプレゼンテーションする方法
MetaTrader 5のためのテクニカル指標 - 34

The indicator Universal Separate Window MT5 works according to your rules. It is sufficient to introduce a formula, along which the line of the indicator will be drawn.
This indicator is intended for use in the separate chart window.
All indicators of the series Universal :
Main window Separate window Free MT4 Universal Main Window Free MT5 Universal Main Window Free MT5 MT4 Universal Separate Window Free MT5 Universal Separate Window Free MT5 Full MT4 Universal Main Window MT5 Universal Ma
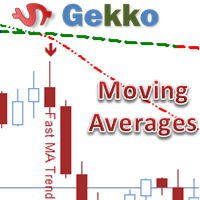
his is Gekko's Moving Averages indicator. It extends the use of the famous moving averages and calculates strong entry and exit signals using Price versus a Fast Moving Average versus a Slow Moving Average. You can set it up in many different ways, eg: price crossing, moving averages crossing, moving averages trend, among others.
Inputs Number of Bars to Plot Indicator: number of historical bars to plot the indicator, keep it low for better performance; FAST Moving Average Details: settings f

Rush Point Histogram Continuity force indicator. Operation: After a breach of support or resistance of an asset, the trader can understand by reading the histogram if such a move tends to continue, thus filtering false breaks or short breaks without trend formation. Through a simple, level-based reading, the trader can make a decision based on the histogram, where: Below 21: No trend formation 21 to 34: Weak trend 34 to 55: Strong Trend 55 to 89: Strong tendency Suggested Reading: Observed disru

Rush Point System
It is a detector indicator of breakage of support and resistance with continuity force.
Operation:
The Rush Point System detects in real time when a buying or buying force exceeds the spread limits in order to consume large quantities of lots placed in the book, which made price barriers - also called support / resistance.
At the very moment of the break, the indicator will show in the current candle which force is acting, plotting in the green color to signal purchasin

Tarzan この指標は、相対力指数の読み取りに基づいています。
速い線は、シニア期間からのインデックスの読み取り値です。たとえば、H4期間からのインジケーターの読み取り値が設定され、インジケーターがM15に設定されている場合、シニア期間の1つのバーに収まるバーの数だけ再描画されます。 、再描画はM15期間で16小節になります。
スローラインは、平滑化された移動平均インデックスです。
インディケータは、設定に応じて、さまざまなタイプのシグナルを使用して取引の決定を行います。 インジケーター設定の説明: TimeFrame-インジケーターが計算されるチャート期間。 RSI_period-インデックスを計算するための平均期間。 RSI_applied-中古価格。 MA_period-インデックス平滑化期間。 iMA_method-アンチエイリアシングメソッド アラート-カスタムデータを含むダイアログボックスを有効にします Text_BUY-買いシグナルのカスタムテキスト Text_SELL-売りシグナルのカスタムテキスト Send_Mail- [メール]タブの設定ウィンドウで指定

WavesTrends このオシレーターは、価格が一定の範囲内で変動する場合に使用される市場指標の1つです。オシレーターには独自の境界(上限と下限)があり、近づくと、市場参加者は売られ過ぎまたは買われ過ぎの市場に関する情報を受け取ります。インディケータは、特定のボラティリティの範囲内で価格変動を登録します。 オシレーターシグナルが価格チャートで確認されると、取引の可能性が高まります。この方向は、オシレーターのいわゆる上部ゾーンと下部ゾーンに反映されます。楽器は買われ過ぎと売られ過ぎの状態に基づいています。これらのパラメータを決定するために、特別なレベルが設定されます。 発振器は本質的に二次的です。これは、主要なツールとしてではなく、分析のための補助的なツールと見なす必要があります。主なパラメータは常に実際の価格変動です。 インジケーター設定の説明: Waves_Period-インジケーターを計算するための主要な期間 Trends_Period-インジケーターを計算するための2次期間 Width_Period-線の間の幅を計算するための期間 ARROW_SHIFT-信号ポイントの垂直

Delta EMA is a momentum indicator based on the changes of closing price from one bar to the next. It displays a histogram of the exponential moving average of those changes, showing magnitude and direction of trend. Positive delta values are displayed as green bars, and negative delta values are displayed as red bars. The transition from negative to positive delta, or from positive to negative delta, indicates trend reversal. Transition bars that exceed a user specified value are displayed in br

Панель предназначена для быстрого визуального нахождения и отображения внутренних баров по всем периодам и на любых выбранных валютных парах одновременно. Цвет сигнальных кнопок, указывает на направление паттерна. По клику на сигнальную кнопку, осуществляется открытие графика с данным паттерном. Отключить не используемые периоды, можно кликом по его заголовку. Имеется поиск в истории (по предыдущим барам). Прокрутка (scrolling) панели, осуществляется клавишами "UP" "DOWN" на клавиатуре. Имеется
BinaryPinMt5 is an indicator developed and adapted specifically for trading short-term binary options. The indicator's algorithm, before issuing the signal, analyzes many factors, such as market volatility, searches for the PinBar pattern, calculates the probability of success when making a deal. The indicator is set in the usual way. The indicator itself consists of an information window where the name of the trading instrument is displayed, the probability of making a successful transaction,

This is Gekko's customizable version of the famous Heiken Ashi indicator. It extends the use of the famous Heiken Ashi and calculates strong entry and exit signals. Inputs Number of Bars to Plot Indicator: number of historical bars to plot the indicator, keep it low for better performance; Produce Arrow Signals: determine if the indicator will plot arrow signal for long/short; Produces Signal Only When a Bar Closes: wait for a bar to close to produce a signal (more accurate, by delayed entry

Market profile was developed by Peter Steidlmayer in the second half of last century. This is a very effective tool if you understand the nature and usage. It's not like common tools like EMA, RSI, MACD or Bollinger Bands. It operates independently of price, not based on price but its core is volume. The volume is normal, as the instrument is sung everywhere. But the special thing here is that the Market Profile represents the volume at each price level.
1. Price Histogram
The Price Histogram

This is a complete and customizable Trading HUD (Head-Up Display) combining all important tools and information for professional trading in one window. Features:
1. Display key indicators that most professionals consider for their trading decisions Current daily, weekly and/or monthly Pivot Points with 7 Levels (PP, S1, S2, S3, R1, R2, R3) Complete history of daily, weekly and/or monthly Pivot Points Current level of exponential moving averages (EMAs) from different timeframes. The User can de

Description
The base of this indicator is an ZigZag algorithm based on ATR and Fibo retracement. The ZigZag can be drawn like a classic ZigZag or like Arrows or needn't be drawn at all. This indicator is not redrawing in sense that the ZigZag's last shoulder is formed right after the appropriate conditions occur on the market. The shoulder doesn't change its direction afterwards (can only continue). There are some other possibilities to show advanced information in this indicator: Auto Fibo on
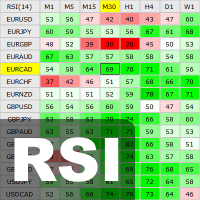
This indicator shows the current RSI values for multiple symbols and multiple timeframes and allows you to switch between timeframes and symbols with one click directly from the matrix. With this indicator, you can analyze large number of symbols across multiple timeframes and detect the strongest trends in just a few seconds.
Features Shows RSI values for multiple symbols and timeframes simultaneously. Colored cells with progressive color intensity depending on the RSI values. Ability to chan
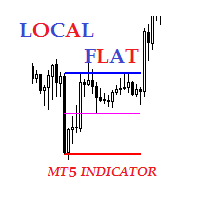
Description The indicator of local flat. The indicator allows to find local flats in the following options: Width of channels that is not more than certain number of points Width of channels that is not less than certain number of points Width of channels that is not more and not less than certain number of points The indicator displays the middle and boundaries of the channel. Attaching multiple instances of the indicator to the chart with different ranges leads to displaying a system of chann
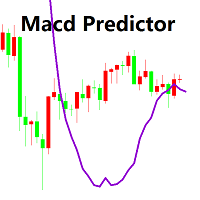
Macdのメインチャートインジケータ
1. MACDが買いから売りに変わる価格を決定することができます。逆も同様です。 これはオシレータの予測子のいとこです。 当時のポジションを知っていれば、正確な価格、現在および次の(将来の)列はMACDクロスオーバに到達する必要があります。 あなたは、現在のポジションが次のMACDクロスオーバーフォースによって助けられたりブロックされたりする前に、市場がどのくらい離れていなければならないかを見ることもできます。 プレディクタはリアルタイムで更新されるため、すべての時間枠でこれを行うことができます。
2. MACD予測変数の履歴を使って価格行動を明確に観察し、棒グラフに直接重ねることで、市場の「動圧」を決定できます。 ダイナミックな圧力とは、信号を売買する市場の反応を指します。 MACDで30分間販売していて、市場が平坦であれば、次の購入信号が簡単に大きな勝者になることがわかります! これは私がよく標準MACDで行うことですが、今は見やすいです! input: Fast EMA - period of the fast Moving Av

This indicator uses volume and volatility information to indicate the trend or to indicate the market reversion/correction. There are 2 indicators in one. The indicator works in two styles: values per candle and accumulated values. Using the volume and volatility information, when well adjusted, this indicator has a good probability to indicate the right direction, both in lower (M1, M2, M5) and higher (M15, M30) timeframes.
Strategy 1: Trend indicator Indicates the operation direction. To u
Технический индикатор Angry Alligator является расширенной авторский интерпретацией индикатора от B. Williams’а. Данный индикатор имеет такие же принципы работы, что и классический индикатор Alligator и основан на тех же параметрах. Ключевым отличием и преимуществом данного индикатора заключается в том, что в нем реализован дополнительный торговой сигнал в виде ещё одной линии. Продолжая тему B. Williams’а сигнал отображает «укус» котировок индикатором - Alligator’s Bite. Дополнительный параметр
Технический индикатор Awesome Oscillator является классической реализацией торгового подхода Билла Вильямса. Индикатор имеет те же параметры что и интерпретация в МТ5 (отображает дельту между МА с периодом 5 и 34 рассчитанную по средним ценам). Ключевым отличием является графическое отображение каждого торгового сигнала, что позволяет более качественно провести анализ актива и получить звуковое оповещение о появлении сигнала. Торговые сигналы индикатора: 1. Crossed zero line : данный торговый с
Технический индикатор Bollinger Bands классически отображается двумя линиями, которые демонстрируют отклонение котировок от МА 20. Для этого используется стандартное отклонение, параметр которого собственно и задаёт динамику двум полосам. Так как индикатор отображает момент повышенной волатильности на рынке, закрытие котировок за полосами свидетельствует об импульсном направлении рынка или же выхода с длительной зоны проторговки. Таким образом, работа на пробой позволяет войти в момент отклонени

Технический индикатор широко известен читателям и поклонникам стратегии «черепах». Отображается линией по нижней/верхней точке цены за определенный интервал времени. Значение ценового канала также используют для определения зон поддержки и сопротивления. Если котировки актива прорывают и закрываются ниже/выше канала, то это является сигналом работы в сторону пробоя. Способы применения: Индикатор является самодостаточным и не требует дополнительных фильтров для начала работы. Однако для надёжност

Технический индикатор Price Channel & Bollinger Bands является комбинацией двух наиболее популярных канальных индикаторов. Данный индикатор отображает моменты пробоя как каждого канала по отдельности, так и генерирует сигналу в момент одновременного закрытия цен за линиями поддержки/сопротивления. Каждый пробой подсвечивает свечу определенным цветом, что позволяет убрать линии для более комфортной работы с графиком. В случае одновременного пробоя PC и BB, индикатор также отобразит необходимый ма

Технический индикатор Universal Oscillator является комбинацией торговых сигналов самых популярных и широко используемых осцилляторов. Индикатор представлен гистограммами, а также линиями fast и slow MA, что позволяет расширить список получаемых торговых рекомендаций и работать как по тренду, так и в боковом движении рынка. Таким образом, гистограммы позволяют определить момент пробоя ценовых значений и движение в новой фазе рынка, а линии указывают на зоны перекупленности и перепроданности. Ос
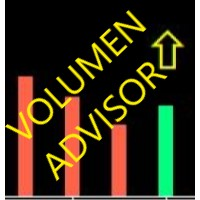
ボリューム入力によって可能な動きを検出したときに通知する便利なツールです。
基本的には先物です。
NO OFFER / NO DEMANDの領域を検出します。
進行中のろうそくの容積を前の容積と比較する。
ボリュームが減少している場合、現在の契約が前の契約を上回ると、ALERT!
- メインのグラフィックまたはウィンドウにロードすることができます。
- どんな一時的なものでも。
- ポップアップウィンドウで警告を表示します。ポップアップウィンドウでは、アラームのグラフが表示されます。
- パターンが検出されると、音響警報が鳴ります。
...............................................

Multicurrency and multitimeframe modification of the Fractals indicator. Displays the last two fractals — their sequence (and which one is broken), or the distance between them. You can specify any desired currencies and timeframes in the parameters. Also, the panel can send notifications on a fractal's breakout. By clicking on a cell with a period, this symbol and period will be opened. This is MTF Scanner. The key to hide the dashboard from the chart is "D" by default.
Parameters Calculatio
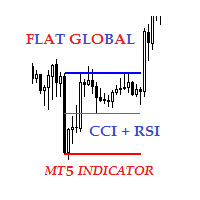
Description The indicator of local flat for CCI and RSI indicators. Users can select financial instruments. The indicator allows to find local flats in the following options: Width of channels that is not more than certain range Width of channels that is not less than certain range Width of channels that is not more and not less than certain range The indicator displays the middle and boundaries of the channel.
Purpose
The indicator can be used for manual or automated trading within an Exper

Панель предназначена для быстрого визуального нахождения и отображения внешних баров по всем периодам и на любых выбранных валютных парах одновременно. Цвет сигнальных кнопок, указывает на направление паттерна. По клику на сигнальную кнопку, осуществляется открытие графика с данным паттерном. Отключить не используемые периоды, можно кликом по его заголовку. Имеется поиск в истории (по предыдущим барам). Прокрутка (scrolling) панели, осуществляется клавишами "UP" "DOWN" на клавиатуре. Имеется Pus

Deposit Supercharger: Optimized Trend Indicator This indicator is based on three technical analytical indicators and two filters, providing more accurate signals. Description: Technical Indicators: The indicator is based on three technical analytical indicators that help determine the trend direction and possible reversal points. Filters: To filter signals, price highs and lows for the past two days (support and resistance levels) are set, as well as a volume indicator, improving signal qualit

The FourierExtrapolationMA indicator transforms and extrapolates the Moving Average function by the Fast Fourier Transformation method.
1. The transformation period is set by two vertical lines, by default the first blue line and the second pink.
2. By default, the Moving Average (MA) line is drawn in red.
3. By Fourier Transform, the indicator builds a model of N harmonics, which is as close as possible to the MA values. The model is drawn by default in blue over the MA for the period bet

This indicator uses VWAP and projects this VWAP into up to 3 levels, shifted by a percentage of the chart's symbol.
How to configure: Choose the symbol and desired graphic time Set the start time of the symbol (in bovespa, WIN and WDO start at 9 o'clock). This time is used as the cutoff reference for VWAP. Check which VWAP period fits the chart better: Ideally, a period when VWAP is not too distant from the chart Set percentage levels: Ideally, you should set levels based on history, so that l

Pivots Points are significant levels traders can use to determine directional movement, support and resistance. Pivot Points use the prior period's high, low and close to formulate future support and resistance. In this regard, Pivot Points are predictive and leading indicators. Pivot Points were originally used by floor traders to set key levels. Floor traders are the original day traders. They deal in a very fast moving environment with a short-term focus. At the beginning of the trading day,
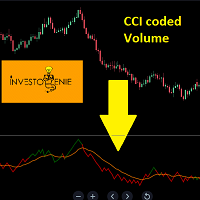
The Indicator is based on Commodity Channel Index (CCI) coded on Volume. The concept is to try and analyze the movement of Volume and Price in a certain direction
Concept:
If the Price of the indicator moves below the threshold price, it turns RED indicating the direction downwards is getting strong.
If the Price of the indicator moves above the threshold price, it turns GREEN indicating the direction upwards is getting strong.
The moving average acts as a great filter to decide entry/exi

HV Models is an Indicator that containes 4 methods for calculating historical volatility of the selected asset. Volatility is one of the fundamental values describing changes in the underlying asset. In statistics, it usualy describes as a standard deviation. The price chart has 4 values (Open High Low Close) when we calculate volatility using a standard indicator, only one of these values is used as a result we get one-sided volatility picture. The presented indicator uses 4 volatility ca

Market Sentiment is an indicator for MT5. Market sentiment is the feeling or tone of a market . Also called investor sentiment, it is generally described as being bullish or bearish : When bulls are in control, prices are going up . When bears are in control, prices are going down . Markets being driven by emotions, the market sentiment is about feelings whereas fundamental value is about business performance .
Settings : Range in bars : numbers of bars used for the calculation, at your own
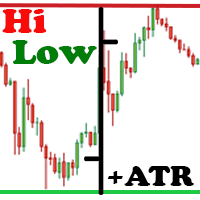
The Hi Low Last Day ( Hi Lo Last Day ) indicator shows the high and low of the last trading day and the second trading day. There are many trading strategies on the daily levels. This indicator is indispensable when using such trading strategies. In fact, everything is simple in trading, you just need to understand and accept it for yourself. There is only price!!! What is price? This is the level on the chart. The level is the price that the buyer and the seller are holding back. What price is

KT COG is an advanced implementation of the center of gravity indicator presented by John F. Ehlers in the May 2002 edition of Technical Analysis of Stocks & Commodities magazine. It's a leading indicator which can be used to identify the potential reversal points with the minimum lag. The COG oscillator catches the price swings quite effectively.
MT4 version of the same indicator is available here KT COG Advanced MT4
Calculation of COG The COG indicator is consist of the two lines. The mai
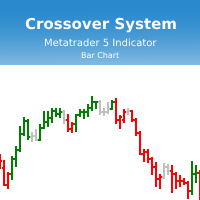
Индикатор Crossover System основан на трех скользящих средних, который изменяет цвет баров в зависимости от определенных условий скользящих средних. Этот индикатор позволит реализовывать системы из одной скользящей средней, из двух скользящих средних и из трех скользящих средних. Параметры индикатора: fastperiod - период быстрой скользящей средней fastMethod - метод построения быстрой скользящей средней fastPrice - метод вычисления быстрой скользящей средней fastshift - сдвиг быстрой скользя

Engulfing Candlestick Bulkowski The engulfing candlestick is a well-known candle pattern composed of two candles. This indicator for showing engulfing candlestick that describe by Thomas Bulkowski.
If you need for MetaTrader 4 version, please visit here: https://www.mql5.com/en/market/product/34193
Feature Highlights Show bullish engulfing and bearish engulfing. Customizable "Up Symbol". Customizable "Down Symbol". Customizable symbol distance from candlestick. Customizable "Down Color". Cus

Outside Days Candlestick Bulkowski The Outside days candlestick is a well-known candle pattern composed of two candles. This indicator for showing outside days candlestick that describe by Thomas Bulkowski.
If you need for MetaTrader 4 version, please visit here: https://www.mql5.com/en/market/product/34411
Feature Highlights Show outside days candlestick. Customizable "Symbol". Customizable symbol distance from candlestick.
Input Parameters Symbol - Input symbol code from "wingdings" for

KT Pin Bar identifies the pin bar formation which is a type of price action pattern which depicts a sign of reversal or rejection of the trend. When combined with support and resistance, BRN and other significant levels, Pin Bar pattern proved to be a very strong sign of reversal.
Basically, a pin bar is characterized by a small body relative to the bar length which is closed either in upper or lower 50% part of its length. They have very large wicks and small candle body.
A pin bar candlest

The indicator High Trend Pro monitors a big number of symbols in up to 4 timeframes simultaneously and calculates the strength of their signals. The indicator notifies you when a signal is the same in different timeframes. The indicator can do this from just one chart. Therefore, High Trend Pro is a multicurrency and multitimeframe indicator. High Trend Pro uses emproved versions of popular and highly demanded indicators for calculating its signals. High Trend Pro calculates the signal strength

KT Psar Arrows plots the arrows on chart using the standard Parabolic SAR indicator. A bullish arrow is plotted when the candle's high touch the SAR. A bearish arrow is plotted when the candle's low touch the SAR. The signals are generated in the real-time without waiting for the bar close.
Features
A beneficial tool for traders who want to experiment with the trading strategies that include the use of Parabolic Sar indicator. Can be used to find turning points in the market. Use custom PSA
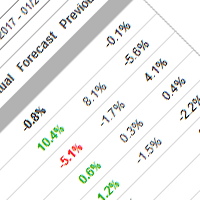
インディケータはfxstreet.comからの通貨商品の履歴と将来の経済ニュースを表示し、ニュースがリリースされる前にニュースで取引したり、ポジションをクローズまたはヘッジしたりすることができます。
デモのテスト方法については、以下のビデオをご覧ください。 経済カレンダーデータをロードするには、経済ニュースカレンダーローダースクリプトを使用します。 https://www.mql5.com/ja/market/product/34738
主な機能: ウェブサイトからの2001年以来の経済ニュースの歴史 ターミナルでの通知、ニュースのリリース前に設定可能な時間電話または電子メールにプッシュ EA(アドバイザー)との互換性:インジケーターは、ニュースのリリース前の構成可能な時間のシグナルを提供し、構成可能な時間の後にオフになります ストラテジーテスターと互換性があります(実際のニュースを使用) 必要な機能が見つかりませんでしたか?私に書いてください、私はすぐに追加します。 利用可能な42カ国からのニュース: 国のコード 国 AR Argentina AU Australia AT
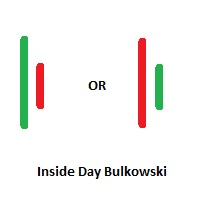
Inside Days Candlestick Bulkowski The Inside days candlestick is a well-known candle pattern composed of two candles. This indicator for showing outside days candlestick that describe by Thomas Bulkowski.
If you need for MetaTrader 4 version, please visit here: https://www.mql5.com/en/market/product/34725
Feature Highlights Show inside days candlestick. Customizable "Symbol". Customizable symbol distance from candlestick.
Input Parameters Symbol - Input symbol code from "wingdings" for ins
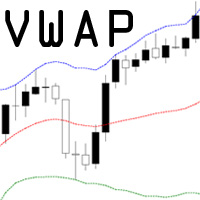
VWAP = Volume Weighted Average Price The concept of VWAP is not equal to a normal Moving Average. The VWAP starts always with zero at the beginning of a new day and successively forms an average to the traded volume relative to price. Professional trading firms and institutions use VWAP for a measure of the real weighted trend of an underlying. With the addition of the standard deviation you can spot support and resist at the outer boundaries.

Minions Labs' Candlestick Pattern Teller It shows on your chart the names of the famous Candlesticks Patterns formations as soon as they are created and confirmed. No repainting.
That way beginners and also professional traders who have difficulties in visually identifying candlestick patterns will have their analysis in a much easier format. Did you know that in general there are 3 types of individuals: Visual, Auditory, and Kinesthetic? Don't be ashamed if you cannot easily recognize Candlest

The indicator displays the delta and the cumulative delta based on the "Time & Sales" deals list data. In addition to the standard timeframes, the indicator displays data regarding the seconds timeframes (S5, S10, S15, S20, S30) to choose from. Using the rectangle, user can select an arbitrary area in the indicator subwindow to view the ratio of the volumes of deals of buyers and sellers within this area.
Indicator features:
The indicator works correctly only on those trading symbols for whi

魔動MT5はプロの指標のMetaTrader5端子です。
移動平均とは異なり、Magic Movingはより良い信号を提供し、長期的な傾向を特定することができます。
インジケータでは、アラート(アラート、メール、プッシュ)を設定することができますので、単一の取引信号を見逃すことはありません。
インジケータの利点 スキャルピングに最適です。 最小の偽信号を生成します。 初心者や経験豊富なトレーダーに適しています。 すべての時間枠で動作します。 外国為替、CFD、バイナリオプション:任意の金融商品に取り組んでいます。 インジケータは再描画されません。 電子メールやモバイルデバイスへの信号の送信。
推奨シンボル EUR/USD、GBP/USD、AUD/USD、USD/CAD、ゴールド。
使用に関する推奨事項 開買い注文が価格を横切る指標線は上向きになるようにします。 価格が下向きのインジケータラインを横切るときにオープン売り注文。
パラメータ Period -値を増やすとインジケータが遅くなり、信号の品質が向上し、その数が減少します。 減
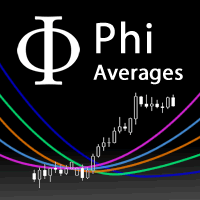
A fan of special weighted moving averages, able to predict tendency reversal and give references about price movements during consolidation and drawbacks. This special moving average is based on Phi fractals and is not available on others indicators. Reproduce this method with another kind of average will not have the same results. The fan has the following averages: 17: Purple 34: Blue 72: Orange 144: Green Blue 305: Dark Blue 610: Grey How to use the fan to analyze price behaviour: If the pric

KT Advance Ichimoku plot the arrows and provide alerts for the four trading strategies based on Ichimoku Kinko Hyo indicator. The generated signals can be filtered by other Ichimoku elements.
Four Strategies based on the Ichimoku Kinko Hyo
1.Tenkan-Kijun Cross Buy Arrow: When Tenkan-Sen cross above the Kijun-Sen. Sell Arrow: When Tenkan-Sen cross below the Kijun-Sen. 2.Kumo Cloud Breakout Buy Arrow: When price close above the Kumo cloud. Sell Arrow: When price close below the Kumo cloud.

KT Volatility oscillator analyze the past and current market data with a mathematical formula to display the result in a form of an oscillator. The growing and deteriorating waves are equivalent to high and low volatility in the asset. In a nutshell, volatility is simply a measurement of the price fluctuation of an asset over a certain period of time. Without volatility, there would not much movement in the market and traders would not be able to profit from the price movements.
Use of Volati
MAからの価格偏差
別ウィンドウの区分には、移動平均の指定値(移動平均)からの価格偏差(%)の値が表示されます。
ポジションの確定と新規ポジションのオープンの両方に使用できます。
入力パラメータ 移動平均を計算するための平均化期間。 平均化方法。 ENUM_MA_METHOD値のいずれかになります。 MODE_SMA - 単純平均 MODE_EMA - 指数平均 MODE_SMMA - 平滑化された平均化 MODE_LWMA - 線形加重平均 中古価格です。 ENUM_APPLIED_PRICE価格定数のいずれかになります。 PRICE_CLOSE - 終値 PRICE_OPEN - 始値 PRICE_HIGH - その期間の最大価格。 PRICE_LOW - 期間の最小価格 PRICE_MEDIAN - 中央値価格(高値+安値)/ 2 PRICE_TYPICAL - 典型的な価格、(高+安+終値)/ 3; PRICE_WEIGHTED - 加重平均価格、(最高+最低+終値+終値)/ 4。

Ultimate Engulfing Bar Scanner (Multi Pair And Multi Time Frame) : ---LIMITED TIME OFFER: NEXT 25 CLIENTS ONLY ---46% OFF REGULAR PRICE AND 2 FREE BONUSES ---SEE BELOW FOR FULL DETAILS Nothing is more important than institutional price action and order flow.
And a strong engulfing candle is a clear indication that the institutions have flipped their sentiment.
Engulfing bar patterns are widely used by institutional traders around the world. As they allow you to manage
your trades withi

Ultimate Correlation Scanner (Multi Pair And Multi Time Frame) : ---LIMITED TIME OFFER: NEXT 25 CLIENTS ONLY ---46% OFF REGULAR PRICE AND 2 FREE BONUSES ---SEE BELOW FOR FULL DETAILS Correlations exist because of ongoing patterns in global capital flows.
Correlations are a fundamental market principle that underpin the markets.
And correlations will never go away. Global capital tends to flow (in unison) in and out of risk sensitive currencies.
While at the same time flowing in and out o

Ultimate Moving Average Scanner (Multi Pair And Multi Time Frame) : ---LIMITED TIME OFFER: NEXT 25 CLIENTS ONLY ---46% OFF REGULAR PRICE AND 2 FREE BONUSES ---SEE BELOW FOR FULL DETAILS Institutional traders use moving averages more than any other indicator. As moving averages offer a quick
and clear indication of the different phases of a trend. Such as expansion, pullback, consolidation and reversal.
And viewing the market through the same lens as the institutions is a critical part of y

Ultimate Volatility Scanner (Multi Pair And Multi Time Frame) : ---LIMITED TIME OFFER: NEXT 25 CLIENTS ONLY ---46% OFF REGULAR PRICE AND 2 FREE BONUSES ---SEE BELOW FOR FULL DETAILS Volatility expansion and contraction is a fundamental market principle that will NEVER go away.
And some of the largest institutions in the world invest enormous amounts of capital into various
types of volatility strategies. Not only for profit driven trading strategies, but also for risk control.
VOLATILITY

An indicator for finding patterns of candles. Through this indicator it is possible to recognize several patterns of candlesticks: hammer, inverted hammer, doji, maximum swallow, minimum swallow and inside bar. The patterns can be found by modifying the values of the indicator parameters. In this way it becomes possible to recognize an infinity of patterns.
How to use: Add the indicator to the chart.
Parameters: [doji -> max body size] represents the maximum body size of the doji (difference

It is an indicator that works with oscillations based on golden proportions. Through this indicator it is possible to operate using the proportions of the number of gold to elaborate strategies with the golden ratio. In this way, it is possible to make market analyzes respecting the proportions of Fibonacci. How to use: The closer the lines are to each other, the greater the possibility of retraction or inversion of the movement, the same is true for the distance of the lines. Nearby lines, sug

Бинарный индикатор находит свечной паттерн "Поглощение" и рисует соответствующий сигнал для входа рынок. Имеет встроенные фильтры и панель для просчета количества успешных сделок.
Особенности Работает для всех валютных пар и любых таймфреймов. Индикатор рассматривает комбинацию из 2-х или 3-х свечей в зависимости от настроек. Имеется возможность фильтровать сигналы путем настройки количества свечей одного цвета (тренда) до образования паттерна. Присутствует панель для отображения точности

The Wolfalizer Indicator combines the functionality of the Engulfing Stochastic along with the ConsecutiveRSI and adds alerts along with more detailed output to the journal. This Indicator will alert you when RSI or Stochastics cross into oversold or overbought. You can set the oversold and overbought levels for RSI and Stochastics separately. You can pick if you want an engulfing candle to appear on the cross or set a number of consecutive candles you would like to see. Interesting Inputs inc

It's a self-learning indicator. You need to set a starting time and download the relevant historical data for it to learn. Learn as few rules as possible and give the maximum freedom to the indicators. Therefore, the principle of choosing the best outcome during the learning period does not guarantee that every transaction is profitable. In general, the longer the study, the more reliable the results. In the strategy tester, you need to set the time parameter before the test starts so that the i

According to trading experience: Some symbols are easy to reverse on certain days, such as Monday, or afternoon, and so on. So comparing the current price with the corresponding historical moment price is valuable. If the price coordinate system uses a logarithmic price, you will get a lot of valuable information. 1. What is this?
This program can convert the symbol price and add it to your Chart. You can compare it with your major chart. The DEMO version Link: https://www.mql5.com/en/market/p
Professional traders know that volume is the fuel for price movement. Large players try to hide their true intentions, but they can be recognized by volume bursts. The standard vertical volume does not show us specific price levels, but the cluster volume and especially its surges provide a very clear picture and specific price levels (areas).
The DBS Cluster Search indicator searches for clusters of the specified size in tick data and highlights them with colored figures on the chart. These
Time Adjusted ATR The Time Adjusted ATR indicator is used to determine the anomalous volatility for exactly specified time of day. The indicator is useful for early identification of reversals, breakthroughs and considering volatility corrections. Options • ATR period: the number of bars of the standard ATR indicator for which the averaging is taken (recommended value = 1). • Normalized Base: how many days (bars) are used to calculate normalization (recommended value = 10 ~ 50). How is "Time

This indicator calculates the Daily VWAP and projects its Bands in 3 upper levels and 3 lower levels (Supports and Resistances), offset by the Standard Deviation selected by the user.
How to configure: Choose the symbol and the desired graphic time; Choose the type of price that is most suitable to calculate the Desired VWAP; Choose whether or not you want the Bands to be plotted; Choose the type of Volume you want to use (Ticks or Real); Choose the type of Calculation of the Bands (Deviation
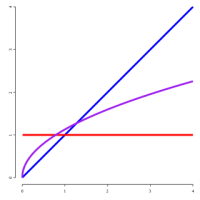
From https://en.wikipedia.org/wiki/Fractional_calculus:
Fractional calculus is a branch of mathematical analysis that studies the several different possibilities of defining real number powers or complex number powers of the differentiation operator D
This indicator execute fracional differentiation on data, you can select the differentiation D value and execute some tweaks like execute Log(value) before difefrentiation or execute a window normalization on last [diffNormalizeWindo
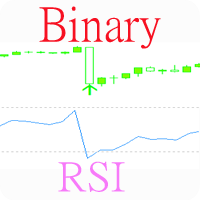
Индикатор, показывающий моменты пересечения важных уровней индикатора RSI. Может быть использован для поиска моментов пересечения уровней для успешной торговли на отскок или по тренду. Подходит для бинарной торговли, т.к. имеется возможность посчитать точность сигналов, в зависимости от времени экспирации.
Входные параметры Inform about finding the signal - параметр, отвечающий за получение уведомлений (Alert) о найденном сигнале. По умолчанию - да Show Panel - Показать/ скрыть панель Period
This indicator implements the well-known trend trading strategy for Stochastic, with two levels for purchases (40 and 80) and two levels for sales (60 and 20). When an upward movement begins, the oversold level rises, from 20 to 40. When there is a downward movement, the overbought level goes down, from 80 to 60. Thus, the strategy has 4 levels. Obviously, tracking signals using the usual 4-level Stochastic is not very convenient, therefore, this indicator illuminates the inputs and outputs with

TradeLeader PD - Pontos Decisivos
O indicador TradeLeader PD completa seu trade system com as informações realmente relevantes.
No painel você verá diversas informações consolidadas e sua relação com o preço. Compare os fluxos de compras e vendas(agressão), delta e muito mais.
Veja abaixo o que somente o TradeLeader PD pode oferecer em um só indicador, elevando o Metatrader a outras plataformas profissionais especializadas.
Painel Variação em porcentagem e ícone. Livro de ofertas: Resist
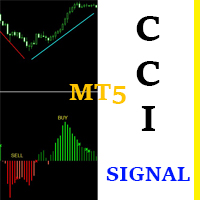
CCI Signal This indicator is based on a custom CCI that is colored to reflect the trend. It was created with the idea in mind: "THE TREND IS YOUR FRIEND". It is simple and easy to use. Even a newbie can understand and use it to achieve great trade results. Simply follow the colors. RED means SELL. GREEN means BUY. It DOES NOT repaint and can be used for Scalping, Day Trading and Swing Trading. It can be used for any time-frame and any currency pair. CCI Signal is highly reliable and provides p
MetaTraderマーケットは自動売買ロボットとテクニカル指標を販売するための最もいい場所です。
魅力的なデザインと説明を備えたMetaTraderプラットフォーム用アプリを開発するだけでいいのです。マーケットでプロダクトをパブリッシュして何百万ものMetaTraderユーザーに提供する方法をご覧ください。
取引の機会を逃しています。
- 無料取引アプリ
- 8千を超えるシグナルをコピー
- 金融ニュースで金融マーケットを探索
新規登録
ログイン