YouTubeにあるマーケットチュートリアルビデオをご覧ください
ロボットや指標を購入する
仮想ホスティングで
EAを実行
EAを実行
ロボットや指標を購入前にテストする
マーケットで収入を得る
販売のためにプロダクトをプレゼンテーションする方法
MetaTrader 4のための新しいエキスパートアドバイザーとインディケータ - 253

Moving band is a trend based, custom indicator which combines multiple Moving Averages and Bollinger Band .
Features Trend based Indicator Does not repaint No False Signals Works on all Time Frames Applicable on Forex, Indices and Stocks
Input Parameters Show Indicator after Testing : True/False Sound an alert : True/False Send an email : True/False Send a notification : True/False Signals The signals are generated with intersection of multiple Moving Averages with mid Bollinger Band Buy whe

MArketwave is a multicurrency, trend following indicator which combines three of the most commonly used parameters. Parameters Moving Averages Bollinger Bands Stochastic Oscillator The parameters have been customized to provide accurate signals. Signals Thick dark green up arrows - Uptrend Thin light green up arrows - Buy Thick red down arrow - Downtrend Thin red down arrow - Sell Trading tips Check the trend with thick arrows Buy or sell with thin arrows only in the direction of the main trend
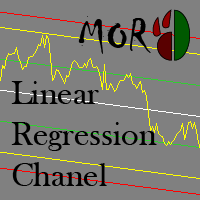
This indicator is designed for plotting the linear regression channel. For convenience, it has multiple operation modes and drawing of data from the selected timeframe.
Input parameters Price - the price to be used for calculation and plotting the upper and lower boundaries of the channel PriceHighLow - the value of bar's High and Low PriceOpenClose - the value of bar's Open and Close Mode - indicator operation mode Static - the linear regression channel is always plotted starting from BarStar

This panel closes trading positions at multiple symbols. The panel displays the situation for all open symbols on the account: Balans - account balance Equity - account equity Margin - used margin Freemargin - free margin Summ Position - the summary position on the account, in lots Position buy - the summary buy position, in lots Position sell - the summary sell position, in lots Summ Profit - the total profit (loss) at all positions Profit buy - the total profit of buy positions Profit sell - t

FutureForecast is one of the few indicators looking into the future, or rather calculating the current candle's High and Low price values.
Advantages of the indicator no repainting works on any timeframes works with any trading instruments perfectly suitable for scalping and trading binary options
Parameters alert - enable/disable alerts about signals. Enabled by default.
Parameters (Colors) FutureHigh - estimated High price line color. FutureLow - estimated Low price line color.
Recomme

Ichimotor is a trend based, custom indicator which combines the Ichimoku Cloud and Alligator
Features Trend based Indicator Does not repaint No False signals Works on all timeframe Applicable on Forex, Indices and Stocks
Input Parameters Show Indicator after Testing : True/False Sound an alert : True/False Send an email : True/False Send a notification : True/False
Signals The signals are generated when there is intersection of the Alligator with the Ichimoku Cloud Thick green Up arrows -

Lobster is a ready-made trading system with a flexible market analysis algorithm. It performs most of the work for a trader. All you have to do is open and close orders following the indicator signals. The indicator will be very useful for both beginners and professionals. It is able to work with other indicators and independently.
Features No signal repainting; Any pair; Any timeframe; Flexible market analysis system.
How to trade When the blue arrow appears, open a buy order; When the blue

The indicator analyzes the direction of the short- and long-term trend over the given periods taking into account market volatility. This approach allows combining high sensitivity of the indicator with a high probability of its signals.
The indicator use principle is very simple: indicator histogram above 0 is a buy signal; indicator histogram below 0 is a sell signal; The indicator is not redrawn on completed bars. This indicator is designed for trading pending orders. Thus, the confirmation

Binary Options Pal Studio is analytical tool for constructing a profitable Binary Options trading strategy, combining technical data and money management systems.
Features Most of indicator parameters are optimizable for best win rate or simulated balance, generating best possible outcome. Daily, hourly ITM statistics are displayed on interactive dashboard, every day of the week and hour can be switched to set up specific time patterns. Trade size, payout, spread and money management systems (
FREE
MACD MTF Signal is an indicator for understanding a trend reversal in any market . It is calculated using the MACD Histogram, which results from the difference between MACD and Signal Line. The strength of MACD MTF Signal is the ability to see more time frames at the same time if they are greater than the one displayed on the chart. In this way it is possible to understand a convergence of ascent or descent on several time frames, which means a strong push in one direction or the other. Another

Trend CruiserGT (for CAD/CHF) It is a swing trading system that trades on CAD/CHF currency pair on 4-hrly chart . The EA is custom designed to take advantage of the start of rising Canadian dollar in 2017, after seeing over 7 year period of downtrend against the Swiss Franc (CHF). The design of the EA have taken consideration of fundamental analysis over last several quarters for the CAD and CHF counterparts, and analyzing the multi-year chart pattern of this pair. The strategy will take full ad

This Indicator Shows 5 lines: Avg Buy - Average Buy price line & total size for all open long positions in your chart Avg Sell - Average Sell price line & total size for all open short positions in your chart B / E - Breakeven price line & total size for all open (long & short) positions in your chart S / L - Stop Loss price line T / P - Take Profit price line Calculation includes Commissions and Swaps Works for a specific Magic Number trades or all trades on chart All currency pairs and all cur
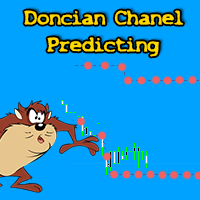
「ドンチャンチャネルの予測」インジケータを使用すると、現在の価格ポジションに基づいて、将来のドンチャンチャネルレベルの変化を予測できます。 標準のジグザグインジケーターは、反対側のドンチャンチャネルに接触すると、99%でビームを描画し始めます。 チャネル境界レベルの予測は、修正のエンドポイントまたはトレンド変化のポイントを見つけて、これらのイベントが発生する可能性のある時期を見積もるのに役立ちます。 ................................................................................................................ 設定 期間-ドンチャンチャネルを計算するための期間。推奨値は12〜240です。 ................................................................................................................

このインジケーターは、単純な線形平滑化プロセスを実装します。
指数平滑化の欠点の 1 つは、信号が急速に減衰することです。これにより、価格帯の長期トレンドを完全に追跡することは不可能になります。線形平滑化により、信号のフィルタリングをより正確かつ細かく調整できます。
インジケーターは、パラメーターを選択して構成されます。
LP - このパラメーターを使用すると、平滑化期間を選択できます。値が大きいほど、インジケーターが表示する長期的なトレンドが多くなります。有効な値は 0 ~ 255 です。 SP - このパラメーターはインジケーターの感度に影響します。このパラメータが大きいほど、価格系列の最後の値の影響が大きくなります.このパラメータの値がゼロの場合、インジケータは LP+1 に等しい期間の単純移動平均を表示します。有効な値は 0 ~ 255 です。

Trading Machine is an Expert Advisor (Robot) for any financial instrument on the MetaTrader 4 platform. All input parameters are optimized for EURUSD M1 . Of course, you are able to optimize these parameters for any currency pairs and timeframe. The main input parameters are A, B, C, D, and E , which can be any positive numbers. These are input parameters (weight coefficients) of the one layer neural network. The EA checks for a new trend and opens a position accordingly. If a trend changes its

Steed is a trend-following multicurrency Expert Advisor, intended for long-term and safe investment. The strategy is based on the analysis of statistics of currency pair movements, as well as the correlation between te underlying currencies of the currency pair the EA is trading. Decision on each specific entry is made through technical analysis, while considering the data from different timeframes. It is necessary to understand that periods (weeks or months) of drawdown or operation with zero p
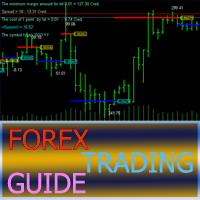
The Forex Trading Guide indicator works based on the standard RSI indicator with an adjustable period. Crossing the internal level calculated mathematically, the indicator gives a signal for opening a trade in a certain direction, showing it on the price chart with the corresponding line (blue - deal up, red - deal down) and the price label of the corresponding color . In other words, if the previous directive was to deal down (the line and the price label in red), then the next directive will b
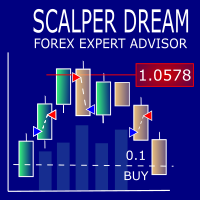
The Scalper Dream Expert Advisor trades based on price movement speed.
Trading Strategy The EA is designed for trading the rebounds after significant price impulses. The EA trades at market, exiting positions by stops or trailing stop. The EA features the ability to swap the signals using the Reverse parameter. In this case, the positions are opened in the direction of the price movement. If the trade volume is set to zero in Lots , the lot size will be calculated depending on the deposit size

This small tool takes over the manually opened positions and treats them according to the predefined settings with the dynamic stop loss and Money Management, which predicts which position size should be used for the trade. The program dynamically tracks the stop loss as soon as the position comes into the plus. Possible commissions and swaps are taken into calculation. It should only be installed on one chart window per symbol.
Settings LotRiskPercent = 25 - Percentage of the item size. Calcu

How would you like to instantly know what the current trend is? How about the quality of that trend? Finding the trend on a chart can be subjective. The Fractal Trend Finder indicator examines the chart for you and reveals what the current trend is based on objective criteria. Using the Fractal Trend Finder you can easily tell if you are trading with the trend or against it. It also identifies those times when the market is not trending. Theoretically, you could trade with the trend when the tre
FREE

BinaryWizardMT4 is a powerful indicator for trading short-term binary options. In fact, this is a ready-made trading system. The indicator calculates the reference point and a short-term support and resistance levels. After the current price crosses the resistance level, a sell signal is formed (SIGNAL: SELL). Similarly, after the price crosses the support line, a buy signal is activated (SIGNAL: BUY).
Parameters x1, y1 - binding coordinates of the indicator window to the upper left chart corn
FREE

This is a fully automated Expert Advisor that does not require stopping during the news release. Trade is conducted by the trend determined by the indicator Ichimoku. Opening the orders occurs near the support (resistance) levels and in presence of the confirmation signals from other indicators. The EA does not require ECN accounts. It works on 4- and 5-digit quotes. The type of quotes is determined automatically. The timeframe of the chart does not matter. The default settings are optimized for
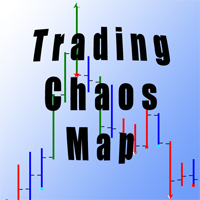
For those who studies Bill Williams' books "New Trading Dimensions" and "Trading Chaos (Second Edition)" and tries trading using these methods, it becomes evident that the standard set of indicators is not sufficient for full-fledged work. The Trading Chaos Map indicator draws the "market map", thus allowing you to the charts the same way as the author of the trilogy. Parameters provide options for enabling and disabling each signal. You can use any of the methods, or use them in conjunction. Yo
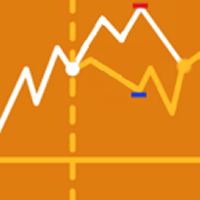
The EA identifies divergences in two correlated currency pairs and trades in the direction where they converge back. Working timeframe: M30
Input parameters MagicNumber - identification number for the EA. OrdersComment - comment to order, automatic if an empty value is set. Lots - lot size. DepoPer001Lot - automatic lot calculation (specify the balance per 0.01 lot) (if 0, the value from 'Lots' parameter is used). TimeFrame - working timeframe. Symbol #2 - correlated currency. Symbol #2 revers

MultiFiboDynamicMT4 is a powerful, professional indicator for estimating the most important support and resistance levels. The main advantage is that it plots the Fibonacci levels at all timeframes simultaneously, which allows the trader to see the full picture of the possible price movement of the trading instrument!
Advantages of the indicator The indicator is perfect for scalping and trading binary options. Suitable for beginners and experienced traders. Works on all timeframes. Works on an
FREE
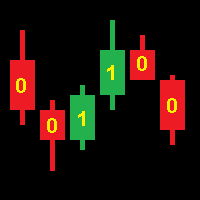
Operation of the CodEx 4 Expert Advisor is based on patterns composed of consecutive candles. Positions are closed when opposite signals appear. Sequences of candles are encoded into an integer according to the following rule. The code number must be converted to binary form and the highest bit must be discarded. The resulting sequence of bits encodes a continuous sequence of candles, where 1 is a bullish candle, 0 is a bearish candle. The higher bits encode the earlier candles. For example: 19[
FREE

Superio is semiautomatic Expert Advisor. It will follow your Buy Stop or Sell stop order. First order will follow your lot on Buy Stop or Sell Stop. Superio is a combination of Martingale and Hedging strategy. After 7 wrong positions, it will change position and start hedging position. It was backtested and optimized using real ticks with high quality. The Expert Advisor has successfully passed the stress test with slippage approximate to the real market conditions. This EA can run on several in
FREE

AR Canada Standard is a fully automated Expert Advisor optimized for trading USDCAD H1. The Expert Advisor DOES NOT use hedging, martingale, grid strategies, arbitrage, etc. It uses a trading algorithm based on the intersection of two moving averages for analyzing the market conditions. The Take Profit and Stop Loss values are fixed and have a ratio of 1 to 3,6. The EA closes positions when Take Profit or Stop Loss are reached. Risk management is a key concept in Forex trading. This EA allows se
FREE
The presented indicator uses the Laguerre filter to build a classical type oscillator, similar in its appearance and method of application to the regular MACD. At the same time, this tool is much more flexible in settings compared to the usual MACD and, thanks to the Laguerre filter, is more sensitive to price movements. Laguerre Osc allows you to choose the parameters in such a way as to be effective for almost any market or time period. Both the crossing of its zero value by the oscillator and
FREE

AR Canada Lite is a fully automated Expert Advisor optimized for trading USDCAD H1. The Expert Advisor DOES NOT use hedging, martingale, grid strategies, arbitrage, etc. It uses a trading algorithm based on the intersection of two moving averages for analyzing the market conditions. The Take Profit and Stop Loss values are fixed and have a ratio of 1 to 4. The EA closes positions when Take Profit or Stop Loss are reached.
Parameters Lots - lot size; MagicNumber = 3 - unique magic number of the
FREE

This script allows selecting the TakeProfit and StopLoss levels. It analyzes the history data, and then calculates the probability of reaching a given price level.
How the script works Suppose you have a trading strategy and you want to select the TakeProfit and StopLoss levels. Run the script and set the parameter: Number of Bars - the average position holding time in bars. Once the script operation is complete, the AIS-PPL.csv file will be created in the Files folder in the terminal data cat
FREE

This indicator displays the trend movements.
Parameters Trend: Displays the trend movements, true/false. X: moves the trend left and right. Y: moves the trend up and down. How to understand the status: (M1), square indicates the timeframe for 1 minute. If the square is green, trend is up. If the square is red, trend is down. (M5), square indicates the timeframe for 5 minute. If the square is green, trend is up. If the square is red, trend is down. (M15), square indicates the timeframe for 15 m

High Volatility is an utility indicator that has the task of locating volatile candles. The recognition and counting function of bullish and bearish candles make it an excellent ally to understand the market volatility. This point often defines possible reversals and moments of continuity. A rectangle is drawn on the chart to identify the candle with greater volatility in long and in short. This indicator is very effective for short, medium, and long-term trading. An alert will notify you when a

This trade panel is designed for opening market orders with predefined values of Magic, TakeProfit and StopLoss. The panel displays the following data: Ask - current Ask price; Bid - current Bid price; Spread - spread equal to (Ask-Bid)*0.0001 for 4- and 5-digit quotes, and (Ask-Bid)*0.01 for 3- and 2-digit quotes; Buy - button for sending a request to open a Buy order; Sell - button for sending a request to open a Sell order; TakeProfit - set TakeProfit: pips - in pips (0.00001) for 4- and 5-di

EW Oscillator PRO is an indicator for MetaTrader 4 based on mathematical calculations on the price chart. This is one of the most common and useful indicators for finding the trend reversal points. EW Oscillator PRO is equipped with multiple types of notification (push notifications, emails, alerts), which allows opening trades in time. A panel for displaying the information on the indicator signals from different timeframes is located in the top left corner (see screenshot #2).
Distinctive fe
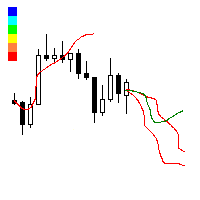
This utility searches the history for price patterns, which are similar to those present in the intervals selected by trader (there are several intervals, see the screenshot). The length of the pattern and selected intervals is the same and is given by the number of bars. The similarity is estimated by comparing the colors of bar bodies, sizes of bars' bodies and wicks. For all identified patterns, further movement of the price is visualized as lines. The color of lines determines the degree of

The indicator improves the idea implemented in the standard Bulls and Bears indicator. This indicator displays the difference between the High and Low for the current period of time and the values of the channel constructed at the maximum and minimum prices for a longer period. The growth of the indicator values above zero indicates that the High for the current period is greater than the average of the maximum prices for the period chosen as the indicator parameter. This situation in most c

CHF Portal is designed for Trading USDCHF specifically.
Trading Concept The operation concept of CHF Portal is based on an algorithm which tries to determine the Trend. To be more specific, CHF Portal works with its own calculation logic according to historical volatility and price movement. It is trying to find out the Top or Bottom in a Trend, and open the Short or Long Position accordingly. Don't expect CHF Portal can be able to open the trade on the highest or lowest level, because CHF Por

EPriceJPY is a auto-trading EA focused on USDJPY.
Trading Concept The operation concept of EPriceJPY is based on an algorithm that tries to determine the Trend. To be more specific, EPriceJPY works with its own calculation logic based on simulation. It is trying to find out the Top or Bottom in a Trend, and open the Short or Long Position accordingly. Don't expect EPriceJPY to open the trade on the highest or lowest level, because EPriceJPY will trade only when the Top/Bottom can be confirmed.

Secret Scalper PRO is pro version of Secret Scalper. The EA is a medium-term scalper. Original version is available here:
https://www.mql5.com/en/market/product/24112
PRO Advantages Trailing SL for First Order: This is classic trailing stop only for first order. Basket Profit Trailing: EA will trail basket orders, if the basket in profit. Day&Time Filter: You can choose EA's working days and times. Orders Closure Type: Profit&Loss To Close can be calculated by Equity&Balance %.
Requirement

This EA takes advantage of Momentum in the Major Currencies . If a certain currency has enough momentum, the EA makes trades on the related pairs. The User Inputs of the EA are so straight-forward, they are in form of questions and suggestions. For example, you will see such questions or statements in the input panel: "Should we trade maximum once per day per pair?" "Close order if Break Even not activated after these seconds:" You will specify the required percentage difference between a Bullis
FREE

Fenrir is a fully automated quantitative swing trend follower EA. It trades Forex pairs using an adaptive market neutral multi-strategy neural network. It is scalable, and can manage SL and TP for orders opened by concurrent EAs on the same product (so called wolfpack mode ), so that the user can add third party logic. The multi strategy structure reserves all magic numbers in the range of x666xxx, and can manage order injection from other EAs. To work in wolfpack mode , just set any other EA to

As it is known, one of the winning parameters in Forex market is Money Management, which is more crucial than a good strategy. So it is good to know that there is a hidden fact in the market, so called pip's value. Most traders pay no attention to this fact. Here comes an example to brighten up. If you have an EUR account, pip's value for each 0.1 lots on EURGBP is around 1.10380 (it depends on the current rate) and on EURUSD is around 0.85050, it means if you take a trade on each of these curre

London Trader EA uses a breakout strategy that can be set to London Session, Tokyo Session, New York Session and Sydney Session.
Recommendations Time frame: H1 Pairs: EURJPY, EURCAD, EURAUD, CADCHF, USDCHF and other pairs can be used. Minimum Leverage: 1:100.
Benefit No martingale or No grid. Can be optimised to any markets time Session. Equity protection by Stop Loss application. EA has a safe mode option. Multicurrency EA.
Input parameters London Trade Time Start : London session opening
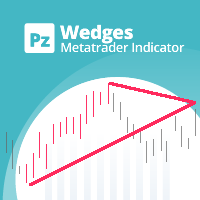
このインディケーターは ウェッジを 見つけます。 ウェッジ は、価格統合期間を囲む収束トレンドラインによって識別される継続パターンです。フォーメーションブレイクアウトと一緒にドンチャンブレイクアウトを使用してトレードを通知します。 [ インストールガイド | 更新ガイド | トラブルシューティング | よくある質問 | すべての製品 ] 使いやすい カスタマイズ可能な色とサイズ ブレイクアウト信号を実装します あらゆる種類のアラートを実装します
最適な使用法 オーバーラップする可能性があるすべてのサイズのウェッジを表示するには、異なるサイズ(6、12、18、24など)でインジケーターをチャートに数回ロードします。
入力パラメータ サイズ:検出されるパターンのサイズ。代替ポイント間のバーとして表されます ブレイクアウト期間:取引を通知するドンチャン期間
最大履歴バー:チャートで調べる過去のバーの量 強気パターンの色:このパラメーターは一目瞭然です 弱気パターンの色:このパラメーターは一目瞭然です 切れ目のないパターンの色:このパラメーターは一目瞭然です 線幅:パターン線のサイ

The indicator shows and highlights the chart candles, which are formed as a result of large players entering the market in large volumes. Such candles can also be formed after achieving a certainty on the market, when most of the participants hold positions in the same direction. The movement is likely to continue in that direction after such candles. The indicator highlights the significant candles from the existing ones on the chart; The indicator allows identifying the trends based on candles

The HeLL_Cat Lite Expert Advisor is a powerful trading tool, suitable both for professionals and beginners. Its arsenal includes various strategies - the semi-automatic HeLL_Cat mode, the Safe mode and the News mode. The semi-automatic HeLL_Cat mode uses the adaptive trading strategy based on a neural network consisting of 4 interconnected logical cores. Unlike the other versions, HeLL_Cat Lite does not open the first order, it only manages the orders opened by user. A distinctive feature of thi

RSI Currency Strength Meter uses RSI (Relative Strength Index) to monitor how strong a currency is, or in other words, if it's being bought or sold by the majority compared to the other currencies. It displays the strength-lines of the currencies of the pair (base and counter currency of the chart) with changeable solid lines. Also, you can add up to five additional currencies to the "comparison pool". If you want to look and compare, for example, EUR, USD and JPY, it will only look at the EURUS

First RSI level indicator analyzes and displays the level, at which the first crossing of the standard RSI maximum or minimum value took place for the subsequent definition of strong trends. The indicator allows you to track the beginning of a trend that does not follow the signals of the standard RSI trading strategy, for example, when the price rushes downwards after reaching an oversold level instead of reversing. In this case, we have to conclude that a strong trend is underway and the next
FREE

The HeLL_Cat PRO Expert Advisor is a powerful trading tool, suitable both for professionals and beginners. Its arsenal includes various strategies - the HeLL_Cat mode, the Safe mode and the News mode. The PRO version differs from the standard version in the added functionality of settings. The complete list of differences can be found in the documentation for the EA. The HeLL_Cat mode uses the adaptive trading strategy based on a neural network consisting of 4 interconnected logical cores. A dis

This multicurrency strategy simultaneously determines the strength of the trends, entry points and the take profit levels for each trade. The indicator can determine entry points on any trading period from M1 to D1. For the convenience of users, the indicator renders the entry point (in the form of an arrow), recommended take profit levels (TP1, TP2, TP3) and the recommended stop loss level (SL1, SL2). The options for using the strategy are described below. Full description of the indicator Cosm

The Expert Advisor trades two strategies, each designed for a particular market behavior. Using both strategies allows you to cover a significant range of trading time and get high and stable results. The Channel strategy is based on the principle of scalping within the channel bounds, during periods of low volatility. Trend strategy builds on the principle of following the trend in during the high volatility hours. The trading periods are selected based on the statistical and fundamental analys

GOAL TIME is an expert advisor based on the notion of time, it studies the change of price according to time, and it finally detects the best time to execute a good order. The EA is based on an indicator that draws a price curve in relation to time, this curve is deduced by an algorithm that analyzes old data. Then, the EA exploits the generated curve and executes the correct order. In case of incorrect choice, the EA has the mission to limit the losses. After a thorough study of this strategy o
The main purpose of the QQ-Deep Binary indicator is to determine the direction of the sail marked for Binary Options. It works for any currency pair, presenting better result in volatile instruments. The indicator is designed to simplify market analysis, and is based on price pattern detection strategies combined with multi-currency econometric velocity. The development team is constantly improving the functionality of the indicator.
Indicator Advantages No repaint. Works on all currencies. Mu

This indicator shows the crossing between two moving averages, a slower and faster moving average. Signal show alert pop-up, when MA1 crosses above the MA2. Signal show alert pop-up, when MA1 crosses below the MA2.
Inputs Value Fast MA Setup Period = 5 - period of Faster Moving Average (value 5). Mode = SMA - type of Moving Average (SMA, EMA, SMMA, LWMA). Price = Close - type of price (Close, Open, Low, High, Median, Typical, Weighted). Slow MA Setup Period = 10 - period of Slower MA (value 10

eaVeryActive is an Expert Advisor (Robot) for any financial instrument on the MT4 platform. All input parameters were optimized and used on EURUSD, M15 . Of course you are able to optimized those parameters for any currency pairs and time frames. The main input parameters are a, b, c, d, e, f, g and h , which can be any numbers in the range from 1 to 9 - input parameters (weight coefficients) of the one layer neural network. This robot will open as many position as you want by input parameter ma
WARNING: due to the calculations used by this indicator, it may take time to load and running it may slow down the user's terminal
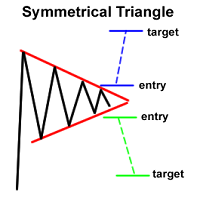
Description & Summary Dashboard to detect Higher-Low/Lower-High breakouts and Triangle Patterns on 28 currency pairs and up to 8 timeframes at once. Numbers on the left are the normalized values of distance between price and last Lower-High and Higher-Low if one has formed (displays "--" if none). Text will turn Red upon a Higher-Low Breakout and Green upon a Lower

Chaos Trader Lite attempts to use aspects of chaos theory to place trades in the marketplace. This Expert Advisor, in particular, draws upon theories made by Bill Williams. Every version of MetaTrader contains the Bill Williams indicators. I wondered why was he deemed so important as to have his own set of indicators added to MetaTrader with name attribution. Conducting research I found that Bill Williams wrote a book using chaos theory to trade the markets. The Bill Williams indicators are usef
FREE
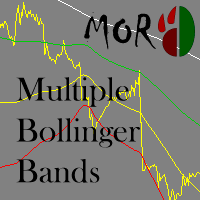
This indicator is based of the well-known Bollinger Bands indicator and provides for an easier operation with BB. It allows drawing up to 3 Bollinger channels and thus simplifies navigation in the list of indicators. Also it allows plotting Bollinger Bands of different timeframes, for example: draw BB on M5 timeframe with parameters: Period = 100, Timeframe = H1.
Inputs Value Mode - choosing different modes of working with the indicator StaticTimeFrame - the indicator draws Bollinger Bands fro
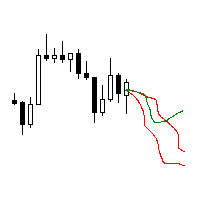
The utility searches the price history looking for the pattern similar to the one within a specified interval. The length of a pattern and a specified interval is the same and set in bars. Similarity is estimated by comparing the bars' body colors, size and shadows. The subsequent price movement is displayed as lines for all detected patterns. The color of the lines defines the degree of similarity. The movement length is set as a number of bars. Search for patterns and visualization are perform
FREE

TickStorm is the result of a 6 months team research and integrates a new approach in the art of ticks analysis. The EA operation algorithm uses retracements velocity to decide if there is a trading opportunity or not. These retracements are spotted by analyzing several ticks matrices on different periods of time and confronting them together in order to gain an edge over the market. We developed new tools to efficiently detect any unusual activity and we created an original and adaptive closing

ZeryEA is a fully automated Expert Advisor based on scalping when indicated the market makes a fast movement. EA can work with any pairs, but It is recommended for GBP/USD, EUR/USD, EUR/JPY with M1.
Expert Advantages NO: Grid, martingale, hedge & arbitrage. YES: Stop loss is always for every orders. LOW: Average position holding time. MIN: Drawdown, initial deposit.
Parameters Auto lot enable (true/false): Auto lots calculate on margin account. Risk percent: when enable auto lot. Fix Lot Min

The Project Genesis Expert Advisor opens positions when the American session closes and the Asian session opens, and the price rolls back from the price channel boundaries. The buy orders are opened when the price is below the lower boundary of the Bollindger Bands channel, sell orders are opened when the price is below the lower boundary. The positions are closed based on multiple algorithms (when the price approaches the opposite boundary of the Bollinger Bands channel, when the maximum positi
This program does not open orders on its own, but instead monitors the active orders of the currency pair it is attached to. The EA sets the Take Profit (TP) or Trailing Stop (TS) levels for active market trades. If pending orders are triggered, the program recalculates the levels and modifies the previously placed trades. The program monitors SELL and BUY orders separately. For example, the program can close SELL trades using TS, and set TP for BUY trades.
Settings profit_Ord___BUY = 15 - pro
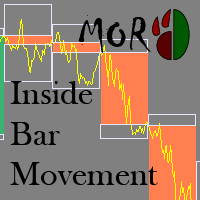
This indicator allows analyzing the movement of prices inside a bar. The indicator draws the contours of the bars of higher timeframes on the current chart.
Inputs Value TimeFrame - the timeframe to display bars NumberOfDays - the number of days the indicator calculates Bull_Body - the body color of the bullish bar Bear_Body - the body color of the bearish bar ShadowUp - the color of the upper shadow of the bar ShadowLow - the color of the lower shadow of the bar Selectable - enable/disable th
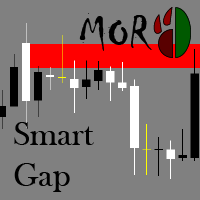
The indicator finds and visualizes price gaps, which often can be used as support and resistance levels. It can display levels from different timeframes on one chart.
Inputs Value Label - show/hide the timeframe of constructed levels TimeFrame - select timeframe to draw levels from DrawRangeDay - the length of the level in days DrawRangeHour - the length of the level in hours GapSizeForDrawing - a level will be drawn if gap is equal to or larger than this level in points CountDays - the number

IlanisNeuro is a modification of Ilanis . The EA uses averaging. Neural network is used for opening positions. The network has been trained on seven major currency pairs (EURUSD, GBPUSD, AUDUSD, NZDUSD, USDJPY, USDCHF, USDCAD) for the period 2004-2017. Real account monitoring: https://www.mql5.com/en/signals/author/fastinvestments The free version of the Expert Advisor: https://www.mql5.com/ru/market/product/25165
Ilanis Expert Advisor Does not require setting the parameters. Ready to work on

The RiseTrading is a unique High quality and easy to use and affordable trading tool because we have incorporated a number of proprietary features and PowerSignal and MACD and Stochastic indicators. The main advantages of the trend trading strategy used by the Expert Advisor are opening positions only in the direction of a trend, ability for the long-term retention of profitable positions allowing users to achieve good combinations of profit/loss distributions. That can work on a real account at

This Expert Advisor implements elements of the Martingale system. Orders are opened at a specified distance from the moving average. The Parabolic SAR indicator and certain technical details are used to ensure the most accurate entries. The EA is highly customizable. It is recommended for simultaneous use on 4 currency pairs: EURUSD M15; GBPUSD M15; USDJPY M15; USDCAD M15. Despite good stability, it is advisable to disable the EA operation during the days rich in news releases.
Configurations

The Magneto Volume Trigger indicator is designed for determining the volume confirmed by the candlestick pattern and predicting the trend tendency.
Indicator setup and use The calculation of values is affected by two parameters - Period and Gate . The lower the value of Gate , the higher the sensitivity of the indicator. Period allows making a sample of data for the specified number of candles. The lower the value of Period , the more the indicator is adapted to the current market conditions.
MetaTraderマーケットは、他に類のない自動売買ロボットやテクニカル指標の販売場所です。
MQL5.community ユーザーメモを読んで、取引シグナルのコピー、フリーランサーによるカスタムアプリの開発、支払いシステムを経由した自動支払い、MQL5Cloud Networkなど、当社がトレーダーに対して提供するユニークなサービスについて詳しくご覧ください。
取引の機会を逃しています。
- 無料取引アプリ
- 8千を超えるシグナルをコピー
- 金融ニュースで金融マーケットを探索
新規登録
ログイン