 MetaTrader 5
 エキスパート
 インディケータ
 ライブラリ
ライブラリ
 ユーティリティ
 ウィジェット
 ルール
ルール
YouTubeにあるマーケットチュートリアルビデオをご覧ください
ロボットや指標を購入する
仮想ホスティングで
EAを実行
EAを実行
ロボットや指標を購入前にテストする
マーケットで収入を得る
販売のためにプロダクトをプレゼンテーションする方法
MetaTrader 4のための新しいエキスパートアドバイザーとインディケータ - 165
 自動売買ロボットは市場取引を自動的に実行しますが、インジケータを使用すると、相場をより適切に分析し、価格行動を予測できます。
これらのアプリケーションを使用すると、より多くの機会を獲得しながら、より多くの情報に基づいた方法でMetaTrader4で取引を実行できるようになります。
自動売買ロボットは市場取引を自動的に実行しますが、インジケータを使用すると、相場をより適切に分析し、価格行動を予測できます。
これらのアプリケーションを使用すると、より多くの機会を獲得しながら、より多くの情報に基づいた方法でMetaTrader4で取引を実行できるようになります。 
R Ease Of Movement Metatrader 4 外国為替インジケーターは、青色の EMZ 取引オシレーターです。 これは、強気と弱気の取引領域を生成するオシレータ型の外国為替指標です。 ゼロ レベルを超える値は強気と呼ばれ、ゼロ レベルを下回る値は弱気と呼ばれます。
R Ease Of Movement オシレーターは、それ自体では良い結果を生み出しません。トレンド フォロー テクニカル インジケーターと組み合わせて取引する必要があります。 優れた外国為替トレンド指標には、SMA、EMA、PSAR、ボリンジャー バンド、エンベロープなどがあります。
基本的な取引シグナル R Ease Of Movement MT4外国為替インジケーターからのシグナルは解釈が簡単で、次のようになります。
買いシグナル: インディケータが下から 0.00 ラインを越えてクローズし、かつ全体的なトレンドが上昇している場合、買いトレードを開始します。 売りシグナル: インディケータが下から 0.00 ラインを下回ってクローズし、かつ全体的なトレンドが下降している場合は、売りトレードを開
UR パルススカルプ ペースの速い市場で究極の優位性を求めるスキャルパー向けの調整済み取引指標
UR PulseScalp は、ペースの速い市場で究極の優位性を求めるスキャルパー向けの最先端の取引ソリューションです。 この革新的なインジケーターは、ボラティリティ、マネーフロー、相対強度の力を組み合わせて、非常に正確で信頼性の高いシグナルを作成する、科学的に調整された式に基づいて構築されています。
UR PulseScalp を使用する利点:
快適なインタラクティブパネル M5 と H1 で高精度 初心者におすすめの EURUSD ペア 設定なし あらゆる種類のアセットに調整 すべての波をキャッチするわけではありません - それがその美しさです。 それを待たなければならない場合でも、最良のエントリを分析します。 ツールの最新情報を入手できる特別な電報チャットがあり、何か不足していると感じた場合はリクエストを送信することもできます!
UR PulseScalp を選ぶ理由
あなたがベテランのスキャルパーであろうと初心者であろうと、「UR PulseScalp」は、金融市場の
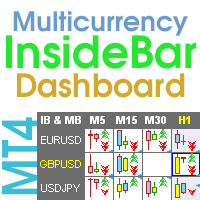
Multicurrency and multi-timeframe indicator Inside Bar (IB). In the parameters, you can specify any desired currencies and timeframes. The panel displays the last found Inside Bar (and Mother Bar) pattern, the current price position and the breakout of the levels of the Mother and Inside Bars. You can set the size and color for bars and text in the cells. The indicator can also send notifications when levels are broken. The dashboard highlights Double Inside Bar in a special color. By clicking

任意の通貨ペアで、M5 期間 (M5 時間枠) でスキャルピングするための既製の取引戦略。 取引戦略はテストされており、良好なパフォーマンスを示しています. すべてのトレーダーは、初心者であっても、この戦略を使用してスキャルピングできます。 取引を開始するには、PC で Metatrader4 を開き、このページから「スキャルピング シグナル インジケーター」をダウンロードして、取引する通貨ペアのチャートに追加する必要があります。 M5 時間枠を選択する必要があります (インジケーターは、特別な最適化なしでは他の時間枠では機能しません)。 これらの手順を完了した後, チャートに 77 の期間を持つ標準の「移動平均」インジケーターを追加する必要があります. このインジケーターは無料で、端末のトレンドインジケーターフォルダーにあります. これで取引を開始できます。 以下に取引戦略について説明します。
「スキャルピング シグナル インジケーター」を使用した取引戦略: 買い取引を開くには: インジケータが緑色の矢印を描くのを待ちます. その後、「移動平均」インジケーターを見て、Open[0

The Puzzle is a fully automated, multicurrency Expert Advisor working simultaneously on 3 symbols: EURGBP, EURJPY & EURCHF. Artificial Intelligence implemented alongside custom made indicators identifies trading opportunities and places the orders. Human traders are often not capable of catching the right trading opportunities in time as much as a software so my intention was to develop expert advisor that will do it for you. It follows several different strategies but before placing an order Th

MerkaStudent is a basic version of an expert advisor that allows us to understand part of the behavior of a chart in historical time.
It uses some basic parameters in trading, which allows us to understand mathematically how a chart moves and thus know what is our mathematical expectation in the historical period analyzed. Starting from a mathematical logic, we can create a strategy to evaluate its results.
FREE

Trading strategy: Scalping. The "EA Ultra Speed" Expert Advisor is based on non-indicator work strictly according to the specified rules for opening and closing deals. The EA was created and tested on the main pairs, but this does not mean that you cannot try it on other currency pairs. The idea is that pending orders up or down are placed at a given distance from the current price. Let's say the price increased by 10 points within an hour and reached 1.3025. The EA follows the price and now
Contact me after payment to send you the User-Manual PDF File. Harmonic Trading The secret is the Fibonacci. It has been proven in the markets that price always reacts to Fibonacci levels. Fibonacci levels are one of the most important indicators of price changes. Sometimes the sequence of reactions to these levels in the chart make geometric shapes, which are called harmonic patterns. The price creates harmonic patterns with its fluctuation and reaction to Fibonacci levels. Harmonic patterns c

I will support only my client. สำหรับลูกค้า Fullerton Fund Ai Robot is a safe system for Forex and Crypto currencies trading. Developed exclusively for the XAUUSD pair(GOLD), any currency pairs and any broker. Try now!
The Ai Robot is designed to operate in the XAUUSD (GOLD) and any currencies market, entering only when there are high probabilities of success and certain unique conditions. The Ai Robot is based on a robust, profitable strategy and NO MARTINGALE. No more indicator. You can se

High End algorithm, Super Intelligent Strategy for you. WinWiFi Fund Ai Robot is a safe system for Forex and Crypto currencies trading. Developed exclusively for the XAUUSD pair(GOLD), any currency pairs and any broker. Try now!
The Ai Robot is designed to operate in the XAUUSD (GOLD) and any currencies market, entering only when there are high probabilities of success and certain unique conditions. The Ai Robot is based on a robust, profitable strategy and NO MARTINGALE. No more indicator.

Are you looking for a cool expert where you can manage your orders easily and fast? I have good news because by using Rapid Trade Manager you can: calculate the risk per trade (percentage or fixed amount) manage your open orders individually choose from a variety of features such as: Take Profit, Partial Close, Stop Loss, Trailing Stop, Break Even, Close All and Close Order. Note! Doesn't work in the Strategy Tester If you are interested check out my videos for more. More info about the Rapid
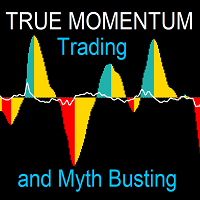
This indicator represents a genuine momentum oscillator according to the true definition of "Momentum", and as realised by the techniques of digital filtering. ( Note : download a complete set of true momentum oscillators here ). A scholarly paper on the subject by the current developer can be found here , but in this description we shall borrow only the minimum of conceptual and mathematical framework needed. In the process, we expose some long-held myths about indicators supposedly measurin
FREE

This is my own developed EA "Pearl"
It trades the whole market and tries to catch reversals. But it tries to trade within the overall D1-trend. It trades currency pairs only
It uses martingale-strategies. It does use flexible grids though. It is free to you when to increase the lotsize of grid levels A grid level can be skipped. If the price overruns a grid level and volatility is still high, a trade will not open. The EA waits till volatility has decreased. Grid distances can be extended by

is highly helpful in both performing and assisting a successful trade. This program allows you to work in a real account and take advantage of its most important feature, the Back-Test feature. is made up of two panels that work together to provide you with the best and fastest performance possible. The command panel is on the left, and the confirmation panel is on the right. The command panel is divided into four main categories: Buy/Sell, Lot, Distance, and Set Close. You make all the decisi

Universe trading advisor is a trading robot for MT4, which has in its arsenal the ability to trade on the following indicators: MACD CCI WPR AO STOCHASTIC MOMENTUM DEMARKER The choice of a traded indicator can be made in the internal settings of the adviser. The working time frame of the H1 adviser, but it can also be used on a younger TF, this will increase the number of transactions, respectively profitability and risk. Recommended trading pairs EURUSD, GBPCAD, EURCAD and other flat pa
If you need an advisor on any arrow indicator signals - this utility will definitely help you. You will be able, with the help of this utility to form an unlimited number of EAs on YOUR signals , with your set of settings, with your copyright and complete source code . You will be able to use the resulting EAs unlimitedly , including adding them to the Market and other resources. Free simple version of the generation script to help you understand how it works - here
What does the utility do?

Signal trend indicator for scalping. Has three different sensitivity options
It detects a trend change and gives signals to open positions.
Has built-in audio and visual trend change alerts. Can send notifications to your phone or email. Allows you to open positions in a timely manner in accordance with the direction of the market. Works on all timeframes, on all currency pairs, metals, indices and cryptocurrencies. Can be used when working with binary options. Distinctive features Does not
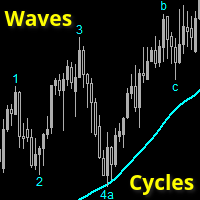
Wave and Cycle counter to give an immediate indication how far the ongoing trend has progressed.
Low numbers: trend has just started, ride the trend. Higher numbers: trend is 'older', watch for reversals
This indicator is 100% compatible with the fantastic TopDog trading strategy.
(I will NOT give any details about this Top Dog strategy)
The trend direction is determined by a SMA value (or any other MA) you can set.
Waves and cycles numbers and letters are derived from a SlowStoch setting.
Wave

Candle Timer displays the time remaining until closing the current Bar, and a new bar forms.
Feature simple to use . no lag or delay . customize position, color & font Size . server time not local time.
Inputs
- position * Beside Active Candle ( Default ) * Right Upper * Lift Upper * Right Bottom * Lift Bottom - font size * 14 (Default) - color * SpringGreen (Default)
FREE
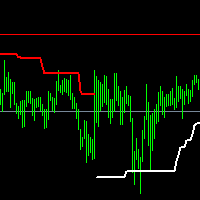
SPT is a trend indicator It is written on the basis of ATR, with clear trend lines indicating the direction in progress, Different traders' understanding of this indicator may form two different purposes Trend-based traders will conduct trend trading when the trend line changes, Respectful shock traders will carry out range trading according to the final support or resistance level marked by this indicator
The index parameters are as follows: Multiplier: multiple of ATR Period: ATR cycle. The s

SuperTrend EA is an expert advisor or trading robot based on the Supertrend Buy-Sell Magic Indicator. It is capable of detecting and following both minor and major trends. SuperTrend EA MT4 is obtained from artificial intelligence algorithms developed by MXRobots company. This EA, in addition to the SuperTrend indicator, includes other instruments that contribute to the activities of this intelligent trading robot, which you can experience Algo Trend EA (supertrend algo trading).
SuperTrend EA

Fibonacci EA MT4 is an Expert Advisor based on a powerful MT4 indicator known as Fibonacci. This EA may trade using the retracement and extension signals provided by this instrument. This Fibonacci EA's trading strategy is to detect strong and invisible support and resistance levels. It can also trade less riskily with the help of the MXRobots exclusive indicators and earn profit without losing money easily. To obtain all of these signals, you do not need to use or purchase several Fibonacci Ex

MACD Color for GOLD Use for looking moving-way of graph and checking will be buy or sell Easy for looking by see the color of trand. Red is down / Blue is up. Can to use it with every time-frame by 1. Long Trade : Use it with time-frame H1 / H4 / Daily 2.Short Trade : Use it with time-frame M5 / M15 / M 30 / H1 and you can see when you will open or close the orders by see this indicator by well by see signal line cut with color line again in opposite. and you can use this indicator for

The True Hero Oscillator indicator is designed for signal trading. This indicator generates trend signals.
It uses many algorithms and indicators to generate this signal. It tries to generate signals from the points with the highest trend potential.
This indicator is a complete trading product. This indicator does not need any additional indicators. This product uses 3 main indicators and many algorithms.
The indicator is never repainted. The point at which the signal is given does not c

MACD EA is a professional and advanced trading robot made from the Best Momentum MT4 Indicator called MACD . This powerful MACD expert advisor trades based on four separate MACD signals. You do not need to purchase multiple MACD EAs to use all of these signals. All of these trading methods are included in an expert MACD that you can obtain by purchasing. MACD EA signals
MACD EA identifies well the divergences that occur in the price and indicates the trend's weakness and trades based on them.
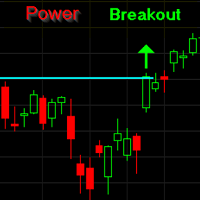
XAUUSD Trading EA (MT5) Get access to our fully automated Expert Advisor designed for consistent performance. Free Trial Available
Try the EA before you commit. Live Performance
Check real results via MyFXBook (link available in our Telegram channel https://t.me/xgoldscalper – pinned message). How to Get the EA
The original MT5 EA file is shared via Telegram.
Contact directly: https://t.me/SaravananL Available Models
Choose what suits you best: Subscription (Buy EA acces
FREE
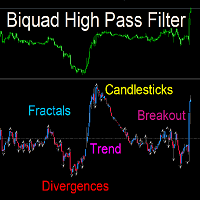
This indicator applies the biquad high pass filter to the price-chart data, and displays the filter output for the OHLC as candlesticks. The candlesticks corresponds to the actual calculations of the filter value during the formation of each price bar (not from all historical highs lows or closes). The shape of the bars therefore corresponds directly to the shape of each price bar. High pass filters are an underappreciated type of oscillator that are seldom used in technical analysis in the st
FREE
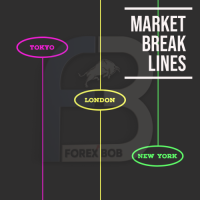
Market Break Lines is an utility tool to create a partition line at market openings/closings of Tokyo/London/NewYork sessions. This will help you to compare the market movements, volatility variations between the different markets.
Inputs: Inputs are simple to feed the time of Tokyo/London/NewYork sessions as per your broker server time Change Color and width of partition lines You can enable or disable any line (Hide/Show).
Please don't forget to support by giving handsome reviews/rating MT5
FREE

AC Pivot Panel – Your Ultimate Pivot Trading Tool The AC Pivot Panel is a powerful yet user-friendly pivot point indicator designed to help traders identify key support and resistance levels with ease. Whether you’re a beginner or an experienced trader, this indicator simplifies pivot trading and enhances your decision-making process. Key Features : Interactive Selection Panel : Easily adjust pivot settings directly on the chart with a compact and intuitive panel. Multiple Pivot Methods : C
FREE

Latest Changes in 1.6 : Added Signal Modes input. Mode 1 : HPF positive go long blue, HPF negative go short red. Mode 2 : slow envelope only, HPF above upper envelope go long blue, HPF below lower envelope go short red. Mode 3 : HPF above both upper envelopes - go long blue, HPF below both lower envelopes go short red. Mode 4 : Go long blue if HPF crosses above upper slow, but fast upper should be below slow upper at the time, exit when HPF crosses below upper fast, reverse logic for short red
FREE
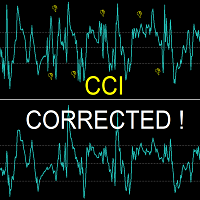
This indicator resolves an unrecognised defect in the Commodity Channel Index Oscillator (CCI). The CCI is based on a high pass filter calculated by subtracting the p-period simple moving average of a price signal (usually typical value) from the price signal itself. Then, the result is divided by the absolute mean deviation of the same period. The frequency response of a signal minus its simple moving average is shown in the first screen shot (in Blue). (see my free indicator : Q n D Frequency
FREE
This is a breakout Indicator for MT4 where you can open trades after a breakout has occurred. This indicator will draw blue boxes on the chart. You simply have to follow price until it breaks out of the box and make sure that the candle had closed above the breakout if its a buy trade and the candle must close below if its a sell trade. An alert will now pop up with suggested price entry and TP of 15 pips default. You can change TP Pis depending on your choice The indicator can trade almost any
UR Vortex
The Probabilistic UR Vortex Formula: An Accurate System for Predictive Market Analysis using Volatility and Standard Deviation Calculations. The UR Vortex indicator is a technical analysis tool that uses volatility and standard deviation calculations to predict potential tops and bottoms in a market. It measures the strength of a trend by calculating the distance between the current price and a moving average, and then standardizing this distance by dividing it by the average true

EA Monkey Scalper is a trading robot uses Scalping Strategy to find opportunities in the market and execute trades with a high probability of winning. Monkey Scalper uses advanced algorithms to look for trade entries when price volatility is high and retracements are present, combined with good trading positions. This results in quick and profitable trades, taking the guesswork out of manual trading. Settings: + Spread Limit: 30 ~ 50 points + Money Management (MM): True or False + Auto Lot S
Introducing the Revolutionary Trade Closing Assistant ! Are you tired of manually closing hundreds trades? Are you a scalper , day trader , swing trader and you want to maximize your profits and minimize your losses by closing multiple positions at thesame time under different conditions? Are you a Prop Firm Trader who wishes to avoid hitting maximum daily drawdown? Search no further. This kit is the ultimate solution for all you.
GUIDE TO USE THE KIT 1. Shows the total profit/lo
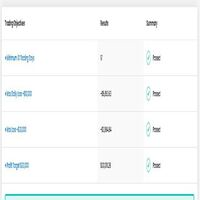
Range Bot V2 es un sistema de trading automático diseñado especialmente para Indices Bursátiles americanos ( Us30, Us100 y Us500).
Sistema capacitado para susperar challenges en cualquier compañia de fondeo que permita el uso de EAs ya que no es MG ni Grid. Tampoco es Tickscalp.
Viene optimizado para US30 en horario NY. Modifique unicamente su riesgo porcentual por operacion

MACD (short for M oving A verage C onvergence/ D ivergence) is a popular trading indicator used in technical analysis of securities prices. It is designed to identify changes in the strength, direction, momentum, and duration of a trend in a security's price.
History Gerald Appel created the MACD line in the late 1970s. Thomas Aspray added the histogram feature to Appel's MACD in 1986.
The three major components and their formula 1. The MACD line: First, "PM Colored MACD" employs two Moving

EA InfinityByEnvelope grid - averaging - hedge backtest 17 years (2005-2023) in MT4 using FBS - Timeframe M5
basic indicator with Envelope
filter infinty true setting filter infinty = medium ---> this properties for filter from SIGNAL Envelope , when EA Open Order
averaging by signal = on ---> grid open order with distance and signal averaging by signal = off ---> grid open order, only with distance
Risk Warning: Before you Rent InfinityByEnvelope, please baktest again Forex is High Risk

EA InfinityBySar grid - averaging - hedge backtest 17 years (2005-2023) in MT4 using FBS - Timeframe M5
basic indicator with Parabolic Sar
filter infinty true setting filter infinty = medium ---> this properties for filter from SIGNAL Parabolic Sar, when EA Open Order
averaging by signal = on ---> grid open order with distance and signal averaging by signal = off ---> grid open order, only with distance
Risk Warning: Before you Rent InfinityBySar, please baktest again Forex is High Risk H

EA InfinityByAlligator grid - averaging - hedge backtest 17 years (2005-2023) in MT4 using FBS - Timeframe M5
basic indicator with Alligator
filter infinty true setting filter infinty = medium ---> this properties for filter from SIGNAL Alligator , when EA Open Order
averaging by signal = on ---> grid open order with distance and signal averaging by signal = off ---> grid open order, only with distance
Risk Warning: Before you Rent InfinityByAlligator, please baktest again Forex is High

Live signal https://www.mql5.com/en/users/datbh/seller Only 7 copies of the EA left at $499 ! Next price --> $579 and final: 1779$
[MT5 version: https://www.mql5.com/en/market/product/93979 ] This is a smart grid-based automated trading system, meticulously developed from over a decade of trading experience. The system leverages quantitative analysis, trend evaluation, and key resistance levels to execute precise entries. Our EA specializes in trading three major currency pairs: AUDCAD NZ
OB Breakout is alert indicator that identifies when a trend or price move is approaching exhaustion(Supply and Demand) and ready to reverse. It alerts you to changes in market movement which typically occur when a reversal or major pullbacks are about to or have happened. The indicator identifies breakouts and price momentum initially, every time a new high or low is formed near a possible Supply or Demand level point. The indicator draws in a rectangle on Supply or Demand Zones. Once price we

Key Level Key Level is a MetaTrader 4 Indicator that uses a proprietary algorithm based on Price Retracement/Breakout Method to show the Entry-Line on your trading.
Instead, it analyzes data of market and identify entry points and opportunities. (Price Retracement / Price Breakout)
It's also a trading tool that be used to practice and enhance your manual trading skills.
Key Level is an amazing tool for Scalping Trader. It also a trading tool that be used to practice and enhance your manual trad

The Saz_Timer indicator belongs to the Saz_Forex suite of professional indicators designed by Traders, for Traders. This indicator will show minutes and seconds of real time on the chart window. The indicator uses the OnTimer() event so it can update even while no ticks received on the chart. The text is shown toward the bottom right of the chart, encircled red in the screenshot. Inputs: Text Colour, allows selection of the colour for the text.
FREE

Previous Period High Low . This indicator shows the previous Day, Week, Month and Years High and Low. It's great for price action strategies. : Provides clear and visible breaks in structure. : Easy to see breakout levels. : Easy to see gaps between previous high, low levels after breakouts have occurred. The indicator works on every time frame. Multiple periods can be selected and be seen on the same chart. Every line can be customized to Your liking. Color, style and thickness. Enjoy!
RumahForexID Momentum Scalping Indicator is the best momentum indicator ever created, and why is that? The indicator works on all timeframes and assets, the indicator is made after 6 years of experience in forex. You know many momentum indicators on the internet are unhelpful, and difficult to trade, but RumahForexID Momentum Scalping Indicator is different , The indicator shows wave momentum, when the market is about to trend or consolidate, all that in one simple and clear indicator!
RumahFo
この指標は、複数の指標を使用して、勝率の高いシグナル取引を生成します R シグナル インジケーターは、チャート上に正確な売買矢印を印刷する完全な FX 取引システムです。
インジケーターは、メインの MT4 チャート ウィンドウに緑色と赤色の矢印として表示されます。
単一のインジケーターによって生成されたシグナルを使用すると、取引中に危険が生じる可能性があります。 これは、取引に 1 つのインジケーターのみを使用すると、より多くの誤ったシグナルが発生する可能性があるためです。 したがって、多くの外国為替トレーダーは、3 つ以上の指標を使用して、適切な取引設定を除外していました。
トレードシグナル 緑の矢印は買いシグナルです。 赤い矢印は売りシグナルです。 R シグナル インジケーターは、トレードのエントリーとエグジットの両方に使用することも、他の戦略やシステムのトレンド確認シグナル インジケーターとして使用することもできます。
この指標は、すべての通貨ペア (メジャー、マイナー、エキゾチック) で同様に機能し、正しく使用すれば有望な結果を示します。
インジケーターの仕様と入
このインディケータは、当社の2つの製品 Advanced Currency IMPULSE with ALERT + Currency Strength Exotics . のスーパーコンビネーションです。
このインジケーターは全ての時間枠で作動し、8つの主要通貨と1つのシンボルの強弱のインパルスをグラフで表示します。
このインジケータは、金、エキゾチックペア、商品、インデックス、先物など、あらゆるシンボルの通貨強度の加速度を表示することに特化されています。金、銀、原油、DAX、US30、MXN、TRY、CNHなどの通貨強度の加速度(インパルスまたは速度)を表示するために、任意のシンボルを9行目に追加できる、この種の最初のものです。
新しいアルゴリズムに基づいて構築され、潜在的な取引の特定と確認がさらに容易になりました。これは、通貨の強さや弱さが加速しているかどうかをグラフィカルに表示し、その加速の速度を測定するためです。加速すると物事は明らかに速く進みますが、これはFX市場でも同じです。つまり、反対方向に加速している通貨をペアリングすれば、潜在的に利益を生む取引を特定

ほとんどのトレーダーは ZigZag を誤って使用しています。
それは市場理解を助けるどころか、誤ったシグナルを生み、トレンドの認識を歪めます。
Valable ZigZag はこの問題を解決します 。価格の動きの本質的な構造と市場の方向を示します。
従来の ZigZag の限界 従来の ZigZag は過剰に多くの動きに反応します。 その結果: 小さな押し目でも大きな変化のように見える レベルのブレイクがシグナルとして認識されるが、継続しない 調整と本当のトレンド転換の区別が難しくなる これにより不要な行動が増え、現在の市場の動きを正しく理解できなくなります。
VALABLE ZIGZAG がトレンドを定義する仕組み 以下はインジケーターの仕組みの簡単な説明です。チャート上で方向がどのように形成されるかを理解する助けになります。 Valable ZigZag はすべての分析を自動で行います 。そのため、トレード中に高値・安値を手動で分析する必要はありません。 Valable ZigZag のロジックは 高値と安値の連続性 に基づいています。 市場が上昇している場合、新しい安値は
FREE
ALL MOVING AVERAGES:多様な戦略に対応する究極のカスタムインジケーター ALL MOVING AVERAGES カスタムインジケーターは、 31種類以上の人気のある移動平均線 を網羅した、奥深いテクニカル分析のための不可欠なツールです。経験豊富なトレーダーから初心者まで、このインジケーターは比類のない柔軟性を提供し、幅広い取引戦略に合わせて移動平均線を完璧に調整できます。 期間やさまざまな価格計算タイプを含む包括的な入力パラメーター群により、取引スタイルや分析ニーズに合わせてインジケーターを簡単にカスタマイズできます。 主な機能と利点: 広範な移動平均ライブラリ: 従来の単純移動平均(SMA)から、ハル移動平均やゼロラグ指数移動平均などの高度なオプションまで、31種類以上の移動平均線の中から膨大な選択肢にアクセスでき、必要なすべてのツールが手に入ります。 高度なカスタマイズ性: 期間を調整し、標準的な終値、始値、高値、安値、および高度な平均足オプションを含む 20種類の異なる価格計算タイプ から選択することで、分析を微調整できます。 包括的なアラートシステム: タイム
FREE
Higher High and Lower Low Scanner MT4は、価格アクショントレーディング戦略を強化したいMetaTrader 4ユーザーのために設計された高度なトレーディングインジケーターです。このツールはフラクタル分析を利用して、重要なスイングポイントやトレンドを定義するパターンを効果的に特定し、forex、株式、暗号通貨などさまざまな市場のトレーダーにとって貴重な資産となります。 このインジケーターは、視覚的なシグナルを通じて上昇トレンドと下降トレンドを正確に確認することで、トレーダーがリアルタイムで情報に基づいた意思決定を行うのに大きな利点を提供します。特に市場のノイズをフィルタリングし、価格の引き戻し時にエントリーのタイミングを計り、誤ったシグナルを避けるのに効果的で、全体的なトレーディングの収益性を向上させます。 MQL製品のインストールガイド | MT4/MT5で購入したMQL製品の更新 | 一般的なトラブルシューティングガイド | インジケーター設定 / ガイド 主な特徴 バッファ統合: インジケーターの値をExpert Advisorによって自動シグナ
FREE

RSI Divergence MT4を紹介します。これは、価格の動きとRSI(相対力指数)の関係を分析することでトレンドの反転を特定するために設計された強力なインジケーターです。意思決定プロセスを強化したいトレーダーに最適で、このツールはダイバージェンスパターンに基づいて潜在的な売買シグナルの洞察を提供します。 強気および弱気のダイバージェンスの両方を検出する能力を持つRSI Divergence MT4は、トレーダーがトレンドの弱まりを見つけ、エグジット戦略を最適化するのを助けます。経験豊富なトレーダーでも初心者でも、このインジケーターはトレーディングの成果を大幅に改善することができます。 MQL製品のインストールガイド | MT4で購入したMQL製品の更新 | 一般的なトラブルシューティングガイド | インジケーター設定 / ガイド 主な特徴 バッファ統合: インジケーターの値をアクセス可能なバッファとして公開し、Expert Advisorが自動取引のためにリアルタイムシグナルを利用できるようにします。 高速かつバックテスト可能: MetaTraderのネイティブOnCalcul
FREE

MT4 の R 2EMA Color インジケーターは、2 つの EMA のクロスオーバーに基づく堅実な取引シグナルを提供します。
キーポイント 価格が 2 つの緑色の EMA を超えて閉じると、買いトレード シグナルが作成されます。 価格が 2 つの赤い EMA を超えて閉じると、売りトレード シグナルが作成されます。 R 2EMA Color Forex インジケーターにより、売買のタイミングをより簡単に判断できます
2 つの EMA ラインが緑色に変わると、買いシグナルが発生します。 2 つの EMA ラインが赤くなると、売りシグナルが発生します。 それと取引する方法は? 2 つの EMA シグナル ラインが赤色から緑色に変わるとすぐに買い取引を開始します。トレンドは現在ポジティブです。 2 つの EMA シグナル ラインが緑色から赤色に変わるとすぐに売りトレードを開始します。トレンドは現在ネガティブです。 チャート上で反対の取引シグナルが発生したら、取引を終了します。
R 2EMA Color インジケーターで取引を開始および終了するために、お好みの取引方法を自由に使用
FREE

R Var 移動平均インジケーターは、根っからのトレンド フォロワー向けに設計されたトレンド フォロー インジケーターです。
これは、株式トレーダーや商品トレーダーの間で非常に人気のある外国為替取引指標であり、その人気は、本物のお金を稼ぐシグナルをユーザーに配信する能力に由来しています.
インジケーターは、シエナ ライン上に配置された緑と赤のドットで構成されます。 緑色の点は強気のシグナルを示し、赤色の点は弱気のシグナルを示しています。
基本的な取引シグナル 買いシグナル: インディケータのシエナラインの点が緑色に変わったらロング。 売りシグナル: インジケーターのシエナ ライン上のドットが赤に変わったらショートします。 買い取引を終了する: 強気トレンドが進行している間にインジケーターのシエナ ラインに赤い点が表示された場合は、すべての買い注文を閉じます。 売りトレードを終了する: 弱気トレンドが進行中に、R Var 移動平均インジケーターのシエナ ラインに緑色の点が表示された場合は、すべての売り注文を閉じます。
チップ R Var 移動平均インジケーターを使用する場合は、
FREE

R ストップロス シグナル インジケーターは、指数移動平均に続くトレンドに基づいています。
この外国為替指標は、アクティビティ チャートに描かれた青と赤の線の形で売買シグナルを生成します。
青色の線はトレンドが上向きであることを示しており、これは通貨ペアを購入するシグナルです。 赤色の線はトレンドが下降していることを示しており、これは通貨ペアを売るシグナルです。 この外国為替インジケーターには、提案されたストップロス ラインも含まれています。
買いシグナルの場合は、ストップロスを青いストップロス ラインより 1 ピップ下に置き、それを引きずります。 売りシグナルの場合は、赤のストップロス ラインより 1 ピップ上にストップ ロスを設定し、それを下に引きます。 トレンド EMA 期間を含むデフォルトのインジケーター入力設定は、インジケーターの入力タブから直接変更できます。
基本的な取引シグナル R ストップロス シグナル インジケーターからのシグナルは解釈が簡単で、次のようになります。
買いシグナル: R ストップロス シグナル インジケーターが青い線を描き始めたら、買い取引
URガンマ (機械学習システムで見られる同様の計算を利用)
UR Gamma は、従来の WaveTrend インジケーターを新しく改善したものを提供する最先端の財務分析ツールです。 高度なデジタル信号処理技術を組み込むことにより、UR Gamma は、従来の WaveTrend アルゴリズムの制限の一部に対処し、価格行動の傾向を特定および測定するためのより正確で堅牢で動的なアプローチを提供します。
UR ガンマを使用する利点:
ミニマルなセットアップ すべてのデータはバックグラウンドで計算されており、ユーザー向けの出力は 1 つだけで、明確かつ適切です。 疲労を示唆する背景レベル あらゆる種類のアセットに調整されます。 ツールの最新情報を入手できる特別な電報チャットがあり、何か不足していると感じた場合はリクエストを送信することもできます!
なぜURガンマ?
目標は、0 を中間点として、-1 と 1 の間で確率分布を振動させることです。 これを実現するために、アクティベーション関数と呼ばれる機械学習の手法を使用してデータを変換します。 そのような関数の 1 つは双曲線正接

R Wavy Dash インディケータは、価格データを、トレードのエントリーとエグジットで機能する優れたトレンド フォロー シグナル インディケータに変換します。 メイン チャートに色付きのシグナル ラインとして表示され、スタンドアロンの取引ツールとして使用できます。
R Wavy Dash インジケーターは非常に信頼性が高く、軽量であり、取引プラットフォームの速度を低下させることはありません。
キーポイント トレンドシグナルインジケーター 初心者に優しい ノンリペイント 指標コレクションに追加する価値があります この指標は、可能なトレンド反転確認ツールとして、既存の取引戦略またはシステムと連携できます。
基本的な取引シグナル R Wavy Dash インジケーターからのシグナルは解釈が簡単で、次のようになります。
買う
緑色のシグナル線がチャート上でペイントを開始すると、新しい買いシグナルが与えられます。 サポートの下にストップロスを置きます。 所定の利益目標のために買い取引を終了するか、売りシグナルを待ちます。 売る
赤色のシグナル線がチャート上でペイントを開始すると
FREE

Metatrader 4 の R インサイド バー インジケーターは、インサイド バーに基づいた使いやすい価格ブレークアウト レベルを提供します。
これは純粋な価格アクションで機能し、再描画は一切行わず、メインの MT4 チャート ウィンドウに、実際のインサイド バーの上下に 2 本の色付きの水平線の形でポップアップ表示されます。
緑色の水平線はレジスタンスとして機能し、赤色の線はサポートとして機能します.
ロング&ショートトレードの考え方 ローソク足が緑色の内側バー ラインの上で閉じ、全体的なトレンドが上向きの場合は、買い注文を出します。 ローソク足が赤の内側のバー ラインより下で閉じ、全体的なトレンドが下向きの場合は、売り注文を出します。 R インサイド バー インジケーターは、すべての通貨ペア (メジャー、マイナー、エキゾチック) で同様に機能し、正しく使用すれば有望な結果を示します。
ヒント
お気に入りのトレード エントリ、ストップ ロス、テイク プロフィット メソッドを自由に使用して、R インサイド バー インジケーターと取引してください。
いつものように、この

R デルタ RSI インジケーターは、信号レベルと共に、高速 RSI (期間 14) と低速 RSI (期間 50) のクロスオーバーに基づいて、色付きの売買ヒストグラムを描画します。
赤色のヒストグラムは、トレンドが強気 (買いシグナル) であることを示します。 緑色のヒストグラムは、トレンドが弱気であることを示します (売りシグナル)。 灰色のヒストグラムは、トレンドがフラットまたは範囲内 (シグナルなし) であることを示します。
この外国為替指標は、スタンドアロンとして、または他のトレンドフォロー指標と一緒に取引できます. スキャルパー、デイ トレーダー、スイング トレーダーは、この優れた RSI クロスオーバー シグナル インジケーターの恩恵を受けることができます。
高速 RSI、低速 RSI、信号レベルのデフォルトの R デルタ RSI インジケーター設定は、インジケーターの入力タブから変更できます。 ニーズに合わせて設定を自由に試してみてください。
基本的な取引シグナル R Delta RSI forex インジケーターからのシグナルは解釈が簡単で、次のようになり

URバンド (機械学習システムで使用される式を使用)
UR Bands は、機械学習システムで使用されるものと原理的に類似した、市場のボラティリティを組み込んだ数式によって導出される指標です。 この市場状況の数学的表現は、金融市場固有のボラティリティを考慮して、価格動向とダイナミクスの正確な分析を提供します。 ボラティリティを変数として組み込むことにより、インジケーターは市場の状況をより正確かつ信頼できる形で表現し、トレーダーや投資家が情報に基づいた意思決定を行い、リスクを効果的に管理できるようにします。 さらに、ボラティリティベースの式を使用することで、インジケーターは市場の変化に非常に反応しやすくなり、潜在的な取引や投資の早期シグナルを提供します。
UR バンドを使用する利点:
視覚的に楽しくわかりやすいオンチャートバンド あらゆる種類のアセットと時間枠に適応 常にトレンドの上下を示すバンド トレンドまたは反転取引システムのための優れた追加およびスタンドアロンのインジケーター ツールの最新情報を入手できる特別な電報チャットがあり、何か不足していると感じた場合はリクエストを送
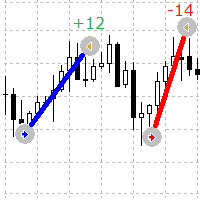
チャート上の注文のエントリーポイントとエグジットポイントを視覚的に確認するためのシンプルで便利なインジケーター
このインジケーターは、現在のオープン注文と完了した注文をシンボルで表示します
指標パラメータ
Lines Buy color - 買い注文のラインの色を指定します Lines Sell color - 売り注文のラインの色を指定します Lines Width - 線の幅を設定します。ソリッド スタイル タイプで機能します。 Lines style - 線のスタイルを設定します Lines positive profit color - 正の利益テキストの色を設定します Lines negative profit color - 負の利益テキストの色を設定します Lines Profit Value Font Type - 利益テキストのフォント タイプを設定します。コンピュータにインストールされているいずれかを設定できます。 Lines profit font size - 利益テキストのフォント サイズを設定します Lines profit value angle
FREE

Metatrader 4 の R Show Ticks インジケーターは、メインの取引ウィンドウにリアルタイムでアップ/ダウン ティックを表示します。
重要ポイント 白い矢印は上昇です。 赤い矢印はダウンティックです。 この指標は、好みの通貨ペアと時間枠で機能します。
インジケーターの仕様 取引プラットフォーム: Metatrader 4 (MT4) 向けに開発
通貨ペア: どのペアにも対応
時間枠: 任意の時間枠で機能します
入力パラメータ: 入力記号、スタイル、色。
インジケーターの種類: データ
インジケーターの入力とパラメーターを編集するには? インジケーターが取り付けられたチャートでマウスボタンを右クリックします。 ドロップダウン メニューから、指標リストをクリックします。 リストからインジケーターを選択し、編集を押します。 これでインジケーターを編集できます。 最後に、[OK] ボタンを押して、更新された構成を保存します。
下の写真は、トレーディング チャートで動作中の外国為替チャート mt4 インジケーターの R 表示ティックを示しています。
FREE

Alchemic のアルゴリズムは、マーチンゲール、グリッド、またはその他の危険な資金管理システムを使用せず、ローソク足分析に基づいています。 Alchemic はいくつかの時間枠を分析し、市場に出入りするための支配的な価格方向を決定します。 EA の各取引には、ストップ ロスとテイク プロフィットの注文が伴います。ストップロスとテイクプロフィットのサイズは、市場のボラティリティによって決まります。 EA は、指定されたボリュームを取引するか、利用可能な資金の量、ストップ ロスのサイズ、および取引用に選択されたリスク プリセットに基づいて、取引ごとに動的に選択することができます。 MT4 バージョン: https://www.mql5.com/en/market/product/92874 錬金術の入力: ポジションのコメント: ここに注文のコメントを入力してください... マジックナンバー:注文用マジックナンバー... ロット方式:ロット管理方式... 手動ロット: すべての注文に静的ロットサイズを使用します... 自動ロットサイズ: 残高パーセントに基づいてロットサイズを自動的

Pivot Classic, Woodie, Camarilla, Fibonacci and Demark
Floor/Classic Pivot points, or simply pivots, are useful for identifying potential support/resistance levels, trading ranges, trend reversals, and market sentiment by examining an asset's high, low, and closing values. The Floor/Classic Pivot Points can be calculated as follows. Pivot Point (P) = (High + Low + Close)/3 S1 = P * 2 - High S2 = P - (High - Low) S3 = Low – 2*(High - P) R1 = P * 2 - Low R2 = P + (High - Low) R3 = High + 2*(P - L
FREE

"Nasdaq Pips Catcher" is a fully automated trading strategy that utilizes a proprietary short-term trend indicator. Upon receiving a signal, a trade is opened along with a "stop loss" and "take profit" (default 50/100 pips). The EA also uses "Break Even" orders. It is designed for trading on the Nasdaq 100 index and is a "Day Trading" strategy. It works best on an M30 chart. No optimization is required and one can find their own settings and use on other instruments. All trades are protected by
Trading strategy: Scalping. The EA "Project Golden Luna" is based on trading on zigzag signals using standard indicators, and market entries are made on the breakdown of local extremum levels. As soon as the bot receives a signal, it immediately starts placing several pending orders. And most importantly, this trading expert uses SL protective orders in open trades, which save the trader's deposit from significant losses. However, this robot in most cases does not wait for the price to reach

I will support only my client. สำหรับลูกค้า DooPrime Fund Ai Robot is a safe system for Forex and Crypto currencies trading. Developed exclusively for the XAUUSD pair(GOLD), any currency pairs and any broker. Try now!
The Ai Robot is designed to operate in the XAUUSD (GOLD) and any currencies market, entering only when there are high probabilities of success and certain unique conditions. The Ai Robot is based on a robust, profitable strategy and NO MARTINGALE. No more indicator. You can sel

I will support only my client. สำหรับลูกค้า Tixee Fund Ai Robot is a safe system for Forex and Crypto currencies trading. Developed exclusively for the XAUUSD pair(GOLD), any currency pairs and any broker. Try now!
The Ai Robot is designed to operate in the XAUUSD (GOLD) and any currencies market, entering only when there are high probabilities of success and certain unique conditions. The Ai Robot is based on a robust, profitable strategy and NO MARTINGALE. No more indicator. You can select

I will support only my client. สำหรับลูกค้า Think Fund Ai Robot is a safe system for Forex and Crypto currencies trading. Developed exclusively for the XAUUSD pair(GOLD), any currency pairs and any broker. Try now!
The Ai Robot is designed to operate in the XAUUSD (GOLD) and any currencies market, entering only when there are high probabilities of success and certain unique conditions. The Ai Robot is based on a robust, profitable strategy and NO MARTINGALE. No more indicator. You can select
High Impact Level EA DE40, US30, FTMO Recomment Broker.
EA can Trade with every Broker that have Volume 0.01 by Indizes. Dont let the Robot Work alone. Important must be Change in Settings for DE40 or US30 inp1_VolumeSize: 0.1 inp1_VolumePercent: 0.00001 inp1_GridStartOffset: 1000.0 inp1_GridStartRoundNumbers: 1000.0 inp1_GridSize: 1000.0 inp2_VolumeSize: 0.1 inp2_VolumePercent: 0.00001 inp2_GridStartOffset: 1000.0 inp2_GridStartRoundNumbers: 1000.0 inp2_GridSize: 1000.0 inp1_GridSizeTP:
FREE
MetaTraderマーケットは自動売買ロボットとテクニカル指標を販売するための最もいい場所です。
魅力的なデザインと説明を備えたMetaTraderプラットフォーム用アプリを開発するだけでいいのです。マーケットでプロダクトをパブリッシュして何百万ものMetaTraderユーザーに提供する方法をご覧ください。

取引の機会を逃しています。
- 無料取引アプリ
- 8千を超えるシグナルをコピー
- 金融ニュースで金融マーケットを探索