YouTubeにあるマーケットチュートリアルビデオをご覧ください
ロボットや指標を購入する
仮想ホスティングで
EAを実行
EAを実行
ロボットや指標を購入前にテストする
マーケットで収入を得る
販売のためにプロダクトをプレゼンテーションする方法
MetaTrader 4のための新しいエキスパートアドバイザーとインディケータ - 272

Volume Volatility is an indicator which analyzes currency pairs, indices, commodities etc. in terms of extremely high and extremely low accumulation to distribution ratio in comparison to values from past. The most important parameter is "Volume Volatility Factor" - this parameter, in big simplification, determines how far distance in the past is analyzed. The lower value of the parameter, the indicator analyzes less data from the past. I recommend you to set and test e.g. 3, 5, 15, 35, and 48 w

The FxSProMT indicator shows the current market trend and trend change.
Indicator Parameters Ind_Period - the number of previous bars used to calculate actual values. Number_Bars - the number of bars to display the indicator.. Too many bars may significantly slow down the operation of the trading terminal. Signal_Sound - sound alert to notify of trend change. The sound can be played multiple times until the signal is confirmed (the bar closes). Default is disabled. Signal_Alert - an alert to n
FREE

This indicator displays the signals based on the values of the classic Money Flow Index (MFI) indicator on the price chart. The volume is considered during the calculation of the MFI values. The MFI can be used for determining the overbought or oversold areas on the chart. Reaching these levels means that the market can soon turn around, but it does not give signal, as in a strong trend the market can stay in the overbought or oversold state for quite a long time. As with most oscillators, the s
FREE

This indicator colors candles in accordance with the projected price movement. The analysis is based on the values of the classic ADX. If the DMI+ line is above the DMI- line - the candlestick is painted in color that signals a price growth; If the DMI+ line is below the DMI- line - the candlestick is painted in color that signals a price fall. The indicator does not redraw on completed candlesticks. The forming candlestick can change its color depending on the current data. Thus, it is recommen
FREE

The FxSProWPR oscillator generates signals for trend confirmation, which can also nbe used to confirm the emergence of new trends.
Indicator Parameters NumberBars - the number of bars to display the indicator. Too many bars may significantly slow down the operation of the trading terminal. SignalAlert - an Alert notifying of a trend. SignalSound - sound alert to notify of a trend. The sound will be played once the histogram exceeds the level of 15.
Rules to confirm position entry Green histo
FREE
The indicator calculation is based on the analysis of the price characteristics of bars and is adjusted by the ATR value. The degree of the ATR influence is determined by the ratio. The color scheme of the indicator depends on the direction of the current trend. A change in the trend is displayed by an arrow and a corresponding message. Depending on the strategy chosen by the trader, this indicator can be used to generate market entry signals, to place stop loss or close trades, and can also be

Arrows appear after Reversal-Pattern and when the confirmation-candle reaches its value, it won't disappear (no repaint). but with fix settings no additional settings necessary Entry : immediately after arrow Stop loss : a few pips above the high of the arrow - candle / below the low of the arrow - candle Take Profit : at least the next candle / move to break even after candle closed / trail the SL works on : Major Forex-pairs / M15 and higher time-frames The Value of the confirmation-candle =>
New version of the semi-scalper multicurrency Expert Advisor that uses an advanced adaptive trading strategy based on a position averaging. It uses a completely different strategy for market entries. The new version features a new function – total trailing stop of the opened positions by equity in the deposit currency or as a percentage of profit. A virtual trailing stop can be applied to the first opened trade. A stop loss can be used to protect the capital. The product is designed for 4 and 5-

Volumes are one of the most important factors of trading, as it is the high volumes that move the market in either direction. But there are very few standard indicators for volumes in MetaTrader 4. The Volume Candles analyses the volumes of the trades and displays candles depending on these volumes. The candle appears once the required number of volumes has passed during trading (the VolumeCandle parameter). If the candles close frequently and are thin, then the volumes on the market are current
Universal adaptable indicator. It determines the estimated trading range for the current day based on the available history a real data, and displays the area of the probable price rollback on the chart. All this thanks to the built-in algorithm that automatically adapts to any behavior models of the market quotes. With the parameters adjusted, the indicator shows its effectiveness on most of the currency pairs, that have a rollback from the reached extremums during the current or the next tradi
This is a free plug-in for Control-adora Expert adviser. It's main function is to create a Buy Stop arrow on the chart or a Sell Stop arrow when the price crosses above or below a trend line, which will allow Control-adora expert open a new trade when the desired lines will be crossed by the price.
Settings Prefix: Write here the prefix used to identify which trend lines are subject to be watched, value "Trendline" is set by default. Always use On Close Only: When set to true (by default) the
FREE

Gegatrade Pro EA is a Cost Averaging System with a Sophisticated Algorithm. It is secured by a built-in “ News WatchDog ” system that suspends trading during news events.
Trading Strategy Gegatrade Pro EA is based on the fact that most of the time the price usually moves between the upper and lower boundaries of the trading channel. Basing on this fact, Gegatrade Pro places its first trade, assuming that the price is going to return to its average value and take the profit which is defined. If

ADX Channel is an indicator that plots the channel depending on the values of the ADX (Average Directional Movement Index) indicator. The resulting channel is a little similar to the Envelopes, but its lines depend on the market volatility. The sell trade is usually executed fast when the price touches and bounces from the upper line of the channel, buy - from the lower. It is recommended to trade when there is no significant news. The recommended timeframes: M5 - H1. The indicator is not design
FREE

Description:
This indicator is a collection of three indicators , it is 3 in 1: PipsFactoryDaily Click Here PipsFactoryWeekly Click Here PipsFactoryMonthly Click Here If you are interesting in all of them, you can save money - this collection indicator is cheaper.
This indicator depends on High and Low price of currency in the (Last day / Last week / Last Month) depends on user input, and then I made some secret equations to draw 10 lines.
Features:
You will know what exactly price you sho

WARNING: Product is out of support! Don't buy it unless you know how it works! Please download free version and test it heavily - it is enough for most uses. MT5 version is highly recommended due to superior back-tester.
This is PRO version of famous (or infamous) grid strategy used by social traders.
It contains YourAI module that lets you construct your own logic with almost every indicator from the market or code base! Use it in classic Grid Trading style or build your logic from scratch

FoxTrotTWO EA is a scalper Expert Advisor intended for EURUSD. It is also available for other major pairs and cross currency pairs. Recommended timeframe is M15. FT2 trades a narrow range at night. At the top and bottom of the range, FT2 will try to generate trades in the opposite direction. To open suitable trades, the Expert Advisor uses several indicators and analyzes several timeframes. But the trades are generated by price actions and are not opened by the indicator. FT2 requires a modera
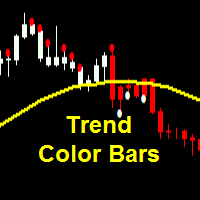
Parameters SoundAlerts = true – play sound alerts, true or false (yes or not) UseAlerts = true – use alerts, true or false (yes or not) eMailAlerts = false – use alerts via email, true or false (yes or not) PushNotifications = false – use push notifications, true or false (yes or not) SoundAlertFile = "alert.wav" – name of alerts sound file ColorBarsDown = clrRed – color body of bearish candlesticks (default – red) ColorBarsUps = clrBlue – color body of bullish candlesticks (default – blue) Colo
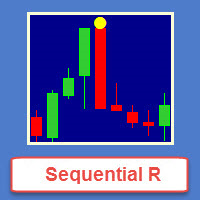
Sequential R is a powerful indicator from the set of professional trader. In today’s market, an objective counter trend technique might be a trader’s most valuable asset.
Most of the traders in the stock market must be familiar with the name "TD Sequential" and "Range Exhaustion". The Sequential R is a Counter-Trend Trading with Simple Range Exhaustion System. TD Sequential is designed to identify trend exhaustion points and keep you one step ahead of the trend-following crowd. The "Sequentia
This is a medium-term conservative system. It tracks quote movements and defines entry points. The Expert Advisor is completely automated and features the unique algorithm. It has been designed for trading CHFJPY and is based on a range trading strategy. Extreme levels are defined based on history, and the EA starts trading expecting a roll-back. Two limit orders are set in case the price moves further. This product continues the EA Permanent series. Dynamic incoming data filtration method is us

Another Relation displays the relative movement of the other symbols (up to 5) in a separate chart window. The indicator works currency pairs, indices and other quotes. Another Relation allows to visually estimate the symbol correlation and their relative amplitude. Thus, the trader is able to compare the movement of the current instrument to others, identify correlations, delays and make decisions based on their general movement.
Indicator usage
The window displays the data on all the symb

The indicator takes screenshots of the active terminal chart. Available image saving options: At the opening of a new bar (candlestick) depending on the currently selected timeframe; After a certain time interval, e.g. every 10 minutes after indicator launch on a chart; When trade orders are opened/closed both by an Expert Advisor and manually; Each time when a user clicks the "Screeshot" button.
Indicator Parameters Settings Screenshot time Start Time (hh:mm) - sets the start time of indicato
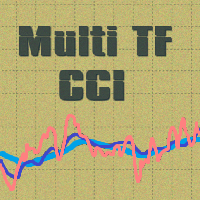
The indicator displays the charts of the Commodity Channel Index indicators from the higher timeframes. A total of three indicators can be displayed. Set the value of the required timeframe in the 'Timeframe' variable. At the value of Timeframe=0 the indicator from the timeframe is not displayed.
The indicator parameters Period - period Timeframe1 - timeframe Timeframe2 - timeframe Timeframe3 - timeframe Other indicators of the series: Multi TF Stochastic - https://www.mql5.com/en/market/produ
The indicator displays the charts of the Relative Strength Index indicators from the higher timeframes. A total of three indicators can be displayed. Set the value of the required timeframe in the 'Timeframe' variable. At the value of Timeframe=0 the indicator from the timeframe is not displayed.
The indicator parameters Period - period Timeframe1 - timeframe Timeframe2 - timeframe Timeframe3 - timeframe Other indicators of the series: Multi TF Stochastic - https://www.mql5.com/en/market/produ
The indicator displays the charts of the Stochastic Oscillator indicators from the higher timeframes (only the main line is displayed). A total of three timeframes can be displayed. Set the value of the required timeframe in the 'Timeframe' variable. At the value of Timeframe=0 the indicator from the timeframe is not displayed.
The indicator parameters PeriodK - K line period PeriodD - D line period Slowing - slowing Timeframe1 - timeframe Timeframe2 - timeframe Timeframe3 - timeframe Other in
The indicator displays the charts of the Williams' Percent Range indicators from the higher timeframes. A total of three indicators can be displayed. Set the value of the required timeframe in the 'Timeframe' variable. At the value of Timeframe=0 the indicator from the timeframe is not displayed.
The indicator parameters Period - period Timeframe1 - timeframe Timeframe2 - timeframe Timeframe3 - timeframe Other indicators of the series: Multi TF Stochastic - https://www.mql5.com/en/market/produ

The Supply and Demand Zones indicator is one of the best tools we have ever made. This great tool automatically draws supply and demand zones, the best places for opening and closing positions. It has many advanced features such as multi timeframe zones support, displaying the width of zones, alert notifications for retouched zones, and much more. Because of market fractality, this indicator can be used for any kind of trading. Whether you are a positional, swing, or intraday trader does not ma
The BOSprint is an automated EA for trading the binary options on the financial instrument of the chart it is attached to. For multi-currency trading the EA should be attached to a chart of the corresponding financial instrument. The EA requires two account types, i.e. two MetaTrader 4 terminals on one computer. provider. receiver. The EA trades on the receiver account based on the advance market information of the provider.
Input Parameters Symbol Name - name of financial instrument of the ch

MFI Pointer is an indicator based on Money Flow Index indicator that uses both price and volume to measure buying and selling pressure. Money Flow Index is also known as volume-weighted RSI . MFI Pointer simply draws arrows on chart window when value of Money Flow Index (from parameter MFI_Period) is below MFI_Level (green upward pointing arrow) or above 100-MFI_Level (red downward pointing arrow). Indicator works on all timeframes and all currency pairs, commodities, indices, stocks etc. MFI Po

Spread Display is a simple but very helpful indicator allowing live monitoring of spread in chart window. Using this indicator, there's no need to distract attention never again, seeking current spread value somewhere else. From now on, everything is clear and at the height of your eyes, in chart window of selected currency pair. Indicator has many settings. We can choose any font we want and we can set 3 spread levels ( Spread_Level_1 , Spread_Level_2 and Spread_Level_3 ) between which will cha

This indicator detects inside bars of several ranges, making it very easy for price action traders to spot and act on inside bar breakouts. [ Installation Guide | Update Guide | Troubleshooting | FAQ | All Products ] Easy to use and understand Customizable color selections The indicator implements visual/mail/push/sound alerts The indicator does not repaint or backpaint An inside bar is a bar or series of bars which is/are completely contained within the range of the preceding bar. A blue box is
FREE
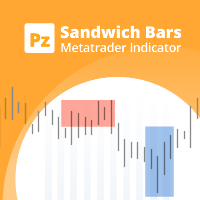
This indicator detects Sandwich Bars of several ranges, an extremely reliable breakout pattern. A sandwich setup consists on a single bar that engulfs several past bars, breaking and rejecting the complete price range. [ Installation Guide | Update Guide | Troubleshooting | FAQ | All Products ] Easy and effective usage Customizable bar ranges Customizable color selections The indicator implements visual/mail/push/sound alerts The indicator does not repaint or backpaint The indicator could not b
FREE

In the stock market technical analysis, support and resistance is a concept that the movement of the price of a security will tend to stop and reverse at certain predetermined price levels. Support and resistance levels can be identified on any timeframe. However, the most significant ones are found on the higher time frames, such as daily, weekly, and monthly. This indicator using the weekly OHLC data to identify the relevant levels. This is a support and resistance indicator and providing majo

The Sprint is an automated scalper EA for high-frequency trading on the financial instrument of the chart it is attached to. For multi-currency trading the EA should be attached to a chart of the corresponding financial instrument. The EA requires two account types, i.e. (MT5/MT4 or MT4/MT4) terminals on one computer. provider. receiver. The EA trades on the receiver account based on the advance market information of the provider.
Input Parameters Symbol Name - name of financial instrument of
Neon System N1 PRO is along-term system containing 10 different strategies. Each strategy includes multiple indicators, the system is designed for real trading. The system uses 50 standard indicators, the robot contains 10 strategies. This system is not for those "who want everything at once." This system assumes a professional long-term trading on the Forex market. The robot has been tested in a special tester on real ticks. It uses an adaptive trailing stop algorithm. The EA uses a system of c

この指標は、市場の強気と弱気の圧力を分析する価格反転を予想しています。購入圧力は、特定の日数にわたるすべての累積バーの合計にボリュームを掛けたものです。販売圧力は、同じ数のバーにわたるすべての分布の合計に、ボリュームを掛けたものです。 [ インストールガイド | 更新ガイド | トラブルシューティング | よくある質問 | すべての製品 ] インディケーター比率は、合計アクティビティに対する購買圧力の割合を示します。この値は、0から100まで変動します。2つの移動平均、高速および低速を実装して、圧力トレンドの変化を識別し、それに応じて取引を探します。 50の比率は、市場が均衡していることを意味します 70を超える比率は、市場が買われ過ぎであることを意味します 30未満の比率は、市場が売られ過ぎていることを意味します 赤い点線は現在の比率です 青い線は信号線です オレンジ色の線がメインラインです それは簡単な取引の含意を持っています。
市場が売られ過ぎているときに購入の機会を探す 市場が買われすぎている場合に販売機会を探す 信号線が本線の上にある場合、圧力は強気です 信号線が本線よ
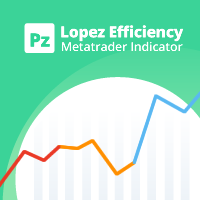
この指標は、特定のバー数の真の高低比率に基づいて、現在の市場の動きがどれほど効率的かを分析します。 [ インストールガイド | 更新ガイド | トラブルシューティング | よくある質問 | すべての製品 ] 比率は市場の動きの有効性です 1未満の比率は、市場がどこにも行かないことを意味します 1を超える比率は、市場が方向性を示し始めていることを意味します 2を超える比率は、市場が効果的な動きを示していることを意味します 3を超える比率は、市場が動きすぎたことを意味します。停止またはリトレースします それは簡単な取引の含意を持っています。 線が赤のときに位置的な機会を探す 比率がオレンジの場合、範囲取引の機会を探します 比率が青の場合、トレンド取引の機会を探します
インジケーターはどのように計算されますか? この指標は、希望するバー数の間に市場が移動した典型的な真の範囲の数を表示します。典型的な真の範囲は、バーの最後の数からの平均の真の高低範囲であり、同じ期間中の絶対的な市場の動きと後で比較されます。インディケーター比率は、範囲と市場の動きの比率として、市場効率の尺度を提供します。
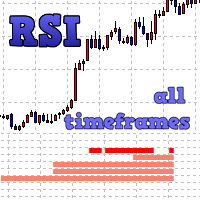
The indicator displays entry signals based on RSI location in overbought/oversold zones on all the timeframes beginning from the current one up to the highest (MN). If RSI is less than Zone but more than (100-Zone), the appropriate indicator value is filled for the timeframe: M1 - from 0 to 10 (sell) or from 0 to -10 (buy); M5 - from 10 to 20 (sell) or from -10 to -20 (buy); M15 - from 20 to 30 (sell) or from -20 to -30 (buy); M30 - from 30 to 40 (sell) or from -30 to -40 (buy); H1 - from 40 to

これはあなたの取引口座の分析を提供する統計パネルです。 分析結果はリアルタイムでチャートに表示されます。 多通貨取引は今日非常に人気があります。しかし、取引の量が多いほど、それぞれの収益性を分析することは難しくなります。月ごとに取引を分析し、 MT5のバージョン
完全な説明 +PDF 購入する方法
インストールする方法
ログファイルの取得方法 テストと最適化の方法 Expforex のすべての製品 各取引ごとの統計を計算することはさらに困難な作業です。 パネルは、あなたのアカウントを分析し、リアルタイムで詳細な統計を準備する効率的な解決策を提供します。 注意! HTMLへのエクスポート ボタン が利用可能です - 私たちのインディケータは別のHTMLファイルにすべての受信データを保存します! タブとコントロール このパネルは現在6つのタブで構成されています。 トレード - 現在のオープントレード 歴史 - 歴史の中で閉じられた取引 すべての取引 - 始値と終値の取引 レポート - あなたの取引口座のクローズド取引に関する詳細なレ
FREE

Partial Close Expert は 、多くの機能を 1 つの自動システムに統合したツールです。この EA は、リスクを管理し、潜在的な利益を最大化するための複数のオプションを提供することにより、トレーダーがポジションをより効果的に管理するのに役立ちます。 Partial Close Expert を使用すると、トレーダーは 一部閉鎖 利益を固定するレベル、 トレーリングストップ 利益を保護し、損失を制限するレベル、 とんとん 価格が反対に動いた場合でも取引が中断されることを保証するレベル、およびその他のいくつかの機能。 このオールインワン Expert Advisor を使用することで、トレーダーは常に取引を監視する必要がないため、時間と労力を節約できます。代わりに、EA は市場の状況に基づいて事前に設定された命令を実行し、トレーダーにより多くの柔軟性と取引の制御を提供します。 部分クローズエキスパートを取り付け、 キーボードの「p」を押して 設定を変更すると、準備完了です。 部分クローズエキスパート インストール & 入力ガイド

この指標の独自性は、ボリュームアカウンティングアルゴリズムにあります。累積は、1日の始まりを参照せずに、選択した期間に直接発生します。最後のバーは計算から除外できます。そうすると、現在のデータが以前に形成された重要なレベル(ボリューム)に与える影響が少なくなります。 より正確な計算のために、M1グラフのデータがデフォルトで使用されます。価格ボリュームの分配のステップは規制されています。デフォルトでは、ディスプレイの右の境界線は、分析に使用されるデータの先頭に対応するバーに設定されていますが、必要に応じて、必要なバーに設定できます。表示されているボリュームバンドの長さ(右の境界線)は係数によって調整され、0(現在の)バーに左または右にシフトしたり、現在のバーを参照してミラーリングしたりすることもできます。 パラメーター: Accumulation period - ボリューム累積の計算期間 Number of excluded last bars - 計算から除外された最後のバーの数 Accumulation price step - 価格パラメータによるボリューム合計のステップ Gra
Seconds Chart — timeframes in seconds for MetaTrader 4. The utility allows you to create charts in the MetaTrader 4 terminal with a timeframe in seconds. The timeframe on such a chart is set in seconds, not in minutes or hours. Thus, you can create charts with a timeframe less than M1. For example, S15 is a timeframe with a period of 15 seconds. You can apply indicators, Expert Advisors and scripts to the resulting chart. You get a fully functional chart on which you can work just as well as on
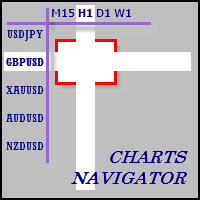
The whole market in one click! Do you value your time? Is ease of use important for you? Are you still looking for the symbol you want or do you have 100 charts open in one terminal? Forget that! Do everything in a single click, on one chart!
Advantages: Quick navigation on all the symbols and timeframes you want in a single chart window; Instant transfer to the required chart in one click; All the necessary symbols and timeframes are clearly and compactly grouped on one chart; Two navigation
Introduction to Support Resistance Indicator Support and Resistance are the important price levels to watch out during intraday market. These price levels are often tested before development of new trend or often stop the existing trend causing trend reversal at this point. Highly precise support and resistance are indispensable for experienced traders. Many typical trading strategies like breakout or trend reversal can be played well around these support and resistance levels. The Precision Sup

AutoOrderModifyFree は「購入したEA」など、ソースコードが公開されていないEAの制御を可能にしたツールです。(裁量トレードの制御も可能です) 「購入したEAを稼動させているがストップの設定が無い」とか、「トレーリング・ストップの設定が無い」場合などで、そのEAに損切り設定やトレーリングストップ機能を適用して使う場合に特に有効です。 また、裁量トレードで「ストップやリミット」を入れるのが面倒な場合や、トレーリング・ブレイクイーブンを自動的にやって欲しい場合にも使えます。 AutoOrderModifyFreeは 口座内にあるすべてのポジションを制御します が、制御するポジションを指定したい場合や、EA毎に設定を変えたい場合、複数ポジションを合算して制御したい場合には AutoOrderModifyEA Pro というFree版には無い機能を多数盛り込んだ製品がありますので、そちらをご覧ください。 AutoOrderModifyProの機能・特徴 自動で損切り(StopLoss)や利食い(TakeProfit)を入れます。 自動でトレイリング・ストップを実行します。
FREE
This multi-timeframe indicator identifies the market's tendency to trade within a narrow price band. [ Installation Guide | Update Guide | Troubleshooting | FAQ | All Products ]
It is easy to understand Finds overbought and oversold situations Draws at bar closing and does not backpaint The calculation timeframe is customizable The red line is the overbought price The green line is the oversold price It has straightforward trading implications. Look for buying opportunities when the market is
FREE

Movement Index was first proposed by Steve Breeze and described in his book "The Commitments of Traders Bible: How To Profit from Insider Market Intelligence". It quickly gained popularity among the traders who analyze the CFTC reports, and became a classic and a unique tool in many aspects, which can be used for finding rapid changes, leading to an imbalance of positions between the market participants. The indicator displays the change in the relative position of the participants as a histogra

Copy Trader is a convenient and fast order copier for MetaTrader4. The EA performs the copying of orders from the server terminal to one or several client terminals. It monitors opening/closing, StopLoss and TakeProfit, and also pending orders. It uses a magic number for its orders, which allows to open other orders in the client terminal both manually and using other experts; It has a minimum of settings. Install the Expert Advisor in two terminals: Choose MODE - SERVER on the terminal to copy

Draw Agent は、すべてのチャート分析、落書き、メモなどを作成および管理するための美しく革新的な方法として設計されています。 このツールは、チャート スペースを黒板として扱い、手で描くためのフリーハンド描画方法を提供します。 このフリーハンド描画ツールを使用すると、MT4/MT5 チャートに描画して、チャート上のイベントをマークまたは強調表示できます。 エリオット波動を手で下書きしたり、チャートに線を引いたり、チャートにアイデアを示したりしたい場合に 役立つツールです。クライアント向けのライブウェビナーを実行している場合、またはスクリーンショットやチャートファイルを人々に配布している場合に特に役立ちます同じように。 Draw Agent のインストールと入力ガイド EA追加URL( http://autofxhub.com )MT4/MT5端末(スクリーンショット参照) に関する通知を受け取りたい場合 。 MT4 バージョン https://www.mql5.com/en/market/product/14929 MT5 バージョン https://www.mql5.
このインディケータは、トレンドまたはフラット市場を見つけるために相対的な観点でシンボルがどれだけ移動したかを計算します。最新の価格帯の何パーセントが指向性であるかを表示します。 [ インストールガイド | 更新ガイド | トラブルシューティング | よくある質問 | すべての製品 ] ゼロの値は、市場が絶対にフラットであることを意味します 値が100の場合、市場は完全にトレンドになっています 青い線は、価格帯が健全であることを意味します 赤い線は、価格帯が狭いことを意味します 移動平均はフラットマーケットインデックス(FMI)です それは簡単な取引の含意を持っています。 線が青でFMIの上にある場合、トレンドトレーディング戦略を使用する 線が赤でFMI未満の場合は、範囲トレーディング戦略を使用します FMIに基づいて機器の選択を実行する このインジケーターは、Expert Advisorsでフラットマーケットを回避するのに特に役立ちます。
入力パラメータ 最大履歴バー:ロード時に過去を調べるバーの量。 ルックバック:フラットマーケットインデックスを調査するためのバーの量。 期間:

This indicator finds Three Drives patterns. The Three Drives pattern is a 6-point reversal pattern characterised by a series of higher highs or lower lows that complete at a 127% or 161.8% Fibonacci extension. It signals that the market is exhausted and a reversal can happen. [ Installation Guide | Update Guide | Troubleshooting | FAQ | All Products ] Customizable pattern sizes
Customizable colors and sizes
Customizable breakout periods Customizable 1-2-3 and 0-A-B ratios
It implements visua
FREE

This is a fully automated smart adaptive algorithm. The SKYNET system calculates the history data and performs the analysis based on the probability percentage of where the upcoming breakout of the support and resistance level will take place, and places pending orders. The Expert Advisor adapts to any market conditions. It was backtested and optimized using real ticks with 99,9% quality. It has successfully completed stress testing. The EA contains the algorithm of statistics collection with ou

The market profile indicator provides with an X-Ray vision into market activity, outlining the most important price levels, value area and control value of the daily trading session. [ Installation Guide | Update Guide | Troubleshooting | FAQ | All Products ] Easy to understand and use Understand market dynamics easily Automatic timeframe selection Identify zones of trading value and discard others It is useful in all market conditions Effective for any trading strategy It implements three color
FREE

SpreadLive shows the full Spread history of a chart with different colors. It alerts you (MT4, E-Mail and Mobile) when the spread reaches the limit, which you can define in the settings. The menu contains Current Spread , Average Spread and Highest Spread of current chart. The main idea is to use it with an EA and analyze negative profits from the spread history. This helps you to see how your broker varies the spread.
Inputs Spread limit - limit to alert. Type - Show in points or pips. Alert:
FREE

This indicator is Demo version of FiboRec and works only on EURUSD This indicator depends on Fibonacci lines but there are secret lines I used. By using FiboRec indicator you will be able to know a lot of important information in the market such as:
Features You can avoid entry during market turbulence. You can enter orders in general trend only. You will know if the trend is strong or weak.
Signal Types and Frame used You can use this indicator just on H1 frame. Enter buy order in case Cand
FREE

This is a non-indicator Expert Advisor based on steady (no roll-backs) price movement. When the price moves a defined distance without changing a direction, one point goes to bulls or bears depending on the price movement direction. When a predefined amount of points is reached, a position is opened. The Expert Advisor uses average weighted stop loss, take profit, breakeven and trailing stop levels. Parameters PriceMove – amount of points to be passed by the price without changing direction; Win

Arbitrage-news trading EA. Works at a user-defined deviation from the price during the news release (optional). The trade is opened when the fast broker gets ahead of the slow one by the specified amount of points. The trades are opened by the direction of the fast broker price movement, works both during the news release and without the news filter. The news filter automatically determines the time zone and the currency the news is released on. To enable the news filter you need to do the follo
The BG Grid is a new generation grid EA. It can also be used for trading single orders without a grid and lot increase. It is most efficient on cross pairs on the М30 and Н1 timeframes. AUDCAD M30, GBPCAD M30, NZDCAD H1, GBPCHF H1. This is a counter-trend EA and it enters the market at the time of a possible correction of the trend. Entries are based on the standard MT4 indicators. As any other grid EA, during a drawdown, the BG Grid places an order grid and eventually closes it in net profit by

The Expert Advisor opens orders using Stochastic Oscillator . All parameters can be customized and optimized. The EA features three strategies for working with the oscillator: Open deals when the main indicator reaches oversold/overbought levels. Open deals when the main line forms a reversal pattern within oversold/overbought areas. Open deals when the main and signal lines intersect within oversold/overbought areas. The number of buy and sell orders opened simultaneously is set separately. Thi

結果の線の多層平滑化とパラメータの幅広い選択の機能を備えたユニークな「スキャルピング」トレンドインジケータ。これは、トレンドの変化の可能性や、動きの始まりに近い修正を判断するのに役立ちます。切り替えられた交差点の矢印は固定されており、新しいバーの開口部に表示されますが、十分な経験があれば、インジケーターラインが未完成のバーで交差するとすぐにエントリーの機会を探すことができます。信号出現限界レベルは、追加のフィルターとしてインジケーターに追加されます。 パラメーター: PeriodMA-一次移動平均計算期間 MethodMA-一次移動平均計算方法 PriceMA-一次移動平均計算適用価格 BasePeriod-基本トレンド期間 BaseMethod-ベーストレンドラインの平均化方法 BasePrice-ベーストレンドラインの適用価格 PowerPeriod-トレンド強度の計算期間 PowerPrice-トレンド強度計算価格 PeriodBaseSmooth-トレンドラインの追加の平滑化の期間 BaseLineSmoothMethod-トレンドラインの追加の平滑化のメソッド PeriodP
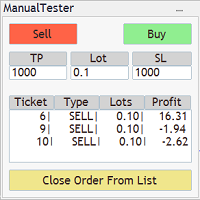
The Manual BackTester Panel utility allows to simulate the manual trading in the MetaTrader 4 strategy tester. The panel works only in the virtual mode of the MetaTrader 4 strategy tester. The demo version allows to open and close ten orders, then the program will automatically turn off. The utility has no parameters at initialization.
Panel Description: The panel has Buy and Sell buttons for placing market orders. It is possible to set the Take Profit and the Stop Loss in the TP and SL fields
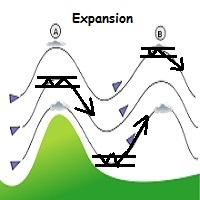
WindExpansion is a fully automated solution to get a smart edge type from the market: it will enter when the “smart money” is starting to heavy push the market (after accumulation/distribution phases that form tiny ranges) and volume is expanding due big interest to sustain the price caused by psychological buying/selling pressure; when this situation happens many traders will try to fade the move but “big dogs” will be stronger and collect profits by the crowd; when the opposite situation happe

This indicator helps you to scan all symbols which are in the Market Watch window and filter out a trend with alerts. It works on five most effective indicators which are used by most of traders for trading: Moving Average Average Directional Moment (ADX) Relative Strength Index (RSI) Parabolic SAR MACD It calculates two bars for scanning. When box colour changes to coral or royal blue colour, it indicates you for trend change for long and short entry. And also you will get alert on screen. When
FREE

The Expert Advisor uses the strategy based on the breakdown of the most important support and resistance levels. Adaptive trade trailing algorithm is used. The EA uses a very small SL so the account is always protected from equity drawdown with a very low risk-per-trade. The EA integrates a system of partial position closure during slippages (can be configured). It was backtested and optimized using real ticks with 99,9% quality. It has successfully completed stress testing. The EA contains the

A very powerful tool that analyzes the direction and the strength of the 8 major currencies: EUR, GBP, AUD, NZD, CAD, CHF, JPY, USD – both in real time, and on historical data. The indicator generates a sound signal and a message when a trend changes. Never repaints signal. The strength of the signal is calculated for all pairs which include these currencies (28 pairs total), can have value from 0 to 6 on a bullish trend, and from 0 to -6 on a bearish trend. Thus, you will never miss a good move

Let us analyze what supply and demand are, and how relevant the expression "market memory" is. The screenshots show the operation of the SupDem-Pro custom indicator, it is the improved version of my previously created Shved Supply and Demand indicator. In order to create it, I gave up trading for almost 3 years and studied a lot of literature, I have not traded during this time, but only analyzed the behavior of the price in different situations. It took me quite a long time to correctly formula

This utility allows to record the spread value to the file, which is equal to or greater than the value specified in the settings, at the specified time. The utility also displays useful information on the symbol's chart: current spread value in points, name of account holder, name of trading server, leverage, the size of the swap for buy orders, the size of the swap for sell orders, day of the week for accruing triple swap, the size of a point in the quote currency, the minimum allowed level of
FREE

This is Demo Version of PipsFactoryMonthly This indicator depends on High and Low price of Currency in last Month and then i made some secret equations to draw 10 lines.
Features You will know what exactly price you should enter the market. You will know when to be out of market. You will know you what should you do in market: Buy Sell Take profit and there are 3 levels to take your profit Support Resistance Risk to buy Risk to Sell
Signal Types and Timeframe Used You can use this indicator
FREE

This is Demo Version of PipsFactoryDaily This indicator depends on High and Low price of currency in the last day, and then I made some secret equations to draw 10 lines.
Features You will know what exactly price you should enter the market. You will know when to be out of market. You will know what you should do in market: Buy Sell Take profit, and there are three levels to take your profit Support Resistance Risk to buy Risk to sell
Signal Types and Timeframes Used You can use this indicat
FREE

This is Demo version of PipsFactoryWeekly This indicator depends on High and Low price of Currency in last Week and then i made some secret equations to draw 10 lines.
Features: You will know what exactly price you should enter the market . You will know when to be out of market. You will know you what should you do in market: Buy Sell Take profit and there are 3 levels to take your profit Support Resistance Risk to buy Risk to Sell
Signal Types and Frame used: You can use this indicator jus
FREE

The indicator accurately identifies a short-term trend both on trend and flat markets. The confirmation of the signal is the overcoming by the price of the high/low of the bar on which the signal was given. Signals are given on fully formed bars and are not redrawn. Calculations are based on the system of Moving Averages. The indicator is highly sensitive. Use it together with other technical analysis indicators.
Settings: Sensitivity - amount of bars for the indicator calculation (1 or higher
FREE
MetaTraderマーケットは、開発者がトレーディングアプリを販売するシンプルで便利なサイトです。
プロダクトを投稿するのをお手伝いし、マーケットのためにプロダクト記載を準備する方法を説明します。マーケットのすべてのアプリは暗号化によって守られ、購入者のコンピュータでしか動作しません。違法なコピーは不可能です。
取引の機会を逃しています。
- 無料取引アプリ
- 8千を超えるシグナルをコピー
- 金融ニュースで金融マーケットを探索
新規登録
ログイン