Taras Slobodyanik / Profilo
- Informazioni
|
10+ anni
esperienza
|
60
prodotti
|
243
versioni demo
|
|
630
lavori
|
0
segnali
|
0
iscritti
|
The Gann Box (or Gann Square) is a market analysis method based on the "Mathematical formula for market predictions" article by W.D. Gann. This indicator can plot three models of Squares: 90, 52(104), 144. There are six variants of grids and two variants of arcs. You can plot multiple squares on one chart simultaneously. Parameters Square — selection of a Gann square model: 90 — square of 90 (or square of nine); 52 (104) — square of 52 (or 104); 144 — universal square of 144; 144 (full) —
The indicator determines the inside bar and marks its High/Low. It is plotted based on the closed candles (does not redraw). The identified inside bar can be displayed on the smaller periods. You may set a higher period (to search for the inside bar) and analyze on a smaller one. Also you can see the levels for Mother bar. Indicator Parameters Period to find Inside Bar — the period to search for the inside bar. If a specific period is set, the search will be performed in that period Type of
The Moving Averages Convergence/Divergence indicator displays information simultaneously from different periods in one subwindow of the chart. Parameters Fast EMA — period for Fast average calculation. Slow EMA — period for Slow average calculation. MACD SMA — period for their difference averaging. Type of price — price used. Timeframes for MACD — list of periods, separated by a space or comma or semicolon. Number of bars for each period — the number of bars displayed for each period. Sort
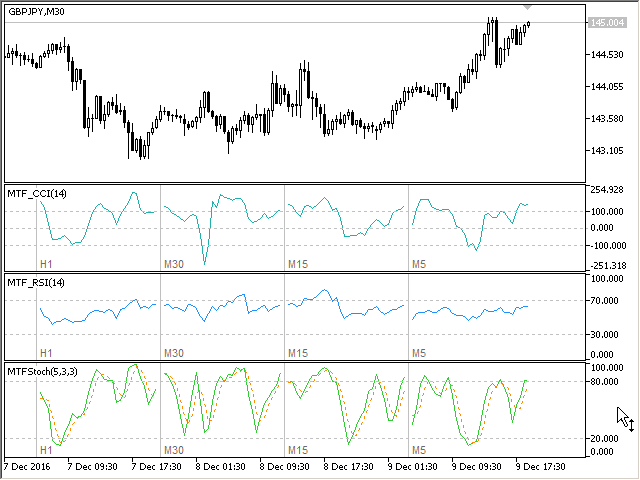
Multi-timeframe indicator Relative Strength Index displays information simultaneously from different periods in one subwindow of the chart. Parameters Period of averaging — averaging period for the RSI calculation. Type of price — price used. Timeframes for RSI — list of periods, separated by a space or comma or semicolon. Number of bars for each period — the number of bars displayed for each period. Sort periods — sort periods if they are listed in no particular order. Current period first —
Stochastic Oscillator displays information simultaneously from different periods in one subwindow of the chart. Parameters %K Period — K-period (number of bars for calculations). %D Period — D-period (period of first smoothing). Slowing — final smoothing. Method — type of smoothing. Price field — stochastic calculation method . Timeframes for Stochastic — list of periods, separated by a space or comma or semicolon. Number of bars for each period — the number of bars displayed for each period
Multi-timeframe indicator Commodity Channel Index displays information simultaneously from different periods in one subwindow of the chart. Parameters Period of averaging — averaging period for the CCI calculation. Type of price — price used. Timeframes for CCI — list of periods, separated by a space or comma or semicolon. Number of bars for each period — the number of bars displayed for each period. Sort periods — sort periods if they are listed in no particular order. Current period first —
------------------------------------------------------------------------
Отправлены на проверку три мультитаймфреймовых индикатора для МТ5 (MTF_CCI, MTF_RSI, MTF_Stochastic).
The indicator calculates the inclination angle between the Highs, Lows and Closes of adjacent bars. The angle can be measured in degrees or radians. A linear graph or a histogram is drawn in a subwindow. You can set the scale for the calculation — floating or fixed. For use in Expert Advisors or indicators, you need to specify a fixed scale. Parameters Angular measure — degrees or radians. Scale mode for calculation — scaling mode. Free scale — free transformation, the indicator will calculate
The indicator calculates the angle between the Highs, Lows and Closes of neighboring bars. The angle can be measured in degrees or radians. A linear chart or a histogram is drawn in a subwindow. You can set the scale for the calculation — floating or fixed. For use in the EA, you need to specify a fixed scale. Parameters Angular measure — degrees or radians. Scale mode for calculation — scaling mode. Free scale — free transformation, the indicator will calculate values each time the chart scale
L'indicatore mostra il profitto (perdita) sul simbolo corrente. Puoi trascinare e rilasciare liberamente la linea per visualizzare il profitto o la perdita corrente. Puoi trovare i miei prodotti qui . Parametri Calculation in money or in points — calcola il profitto/perdita in punti o denaro. Add pending orders to calculate — prendi in considerazione gli ordini in sospeso nei calcoli. Magic Number (0 - all orders on symbol) — numero magico, se è necessario valutare ordini specifici
This is the famous FX Sniper's T3 CCI indicator. It is a fixed version additionally containing search for classical and reverse (hidden) divergence. The classical divergence is displayed as a solid line, the reverse divergence is shown as a dotted line. Divergences are drawn in the indicator and on the chart (if you select the appropriate options) Parameters CCI Period — Commodity Channel Index indicator period CCI Type of price — price used for indicator calculation T3 Period — Sniper period b
The indicator determines the inside bar and marks its High/Low. It is plotted based on the closed candles (does not redraw). The identified inside bar can be displayed on the smaller periods. You may set a higher period (to search for the inside bar) and analyze on a smaller one. Also you can see the levels for Mother bar. Indicator Parameters Period to find Inside Bar — the period to search for the inside bar. If a specific period is set, the search will be performed in that period Type of
Версия 2.0 - 2016.09.23
1) Исправлена ошибка перепрыгивания уровня при смене таймфрейма.
2) Добавлена опция расчета в пунктах.
————————————————————————————————————————
Lines Profit Loss
Version 2.0 - 2016.09.23
1) Fixed the error with levels jumping when switching timeframes.
2) Added the option for calculation in points.
L'indicatore mostra il profitto (perdita) sul simbolo corrente. Puoi trascinare e rilasciare liberamente la linea per visualizzare il profitto o la perdita corrente. Puoi trovare i miei prodotti qui . Parametri Calculation in money or in points — calcola il profitto/perdita in punti o denaro. Add pending orders to calculate — prendi in considerazione gli ordini in sospeso nei calcoli. Magic Number (0 - all orders on symbol) — numero magico, se è necessario valutare ordini specifici. Offset for