|
10+ anni
esperienza
|
60
prodotti
|
241
versioni demo
|
|
629
lavori
|
0
segnali
|
0
iscritti
|

Taras Slobodyanik


trade2travel12
2020.11.04
Hi Taras I purchsed your Levels of Timeframes but I can't access it. Normally there is an exe file but you don't have one. Can you please show me where your exe file is?
Taras Slobodyanik
[Eliminato]
2020.03.25
[Eliminato]
Taras Slobodyanik
2020.05.19
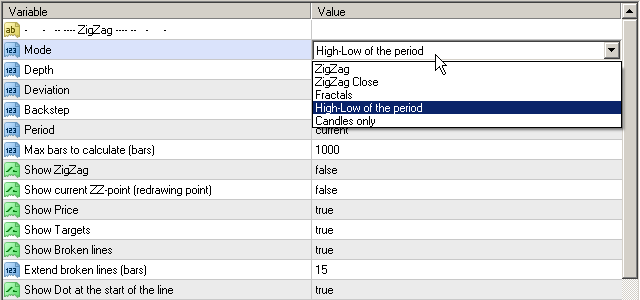
This function is equivalent to the standard function - "Visualization".
Taras Slobodyanik

· 1
Roman Agafonkin
2019.11.01
Добрый день! у меня есть несколько вопросов перед покупкой этого софта.. Скажите, как можно с вами связаться и уточнить некоторые нюансы?