|
10+ anni
esperienza
|
60
prodotti
|
241
versioni demo
|
|
629
lavori
|
0
segnali
|
0
iscritti
|

Taras Slobodyanik

leonchulo
2021.06.05
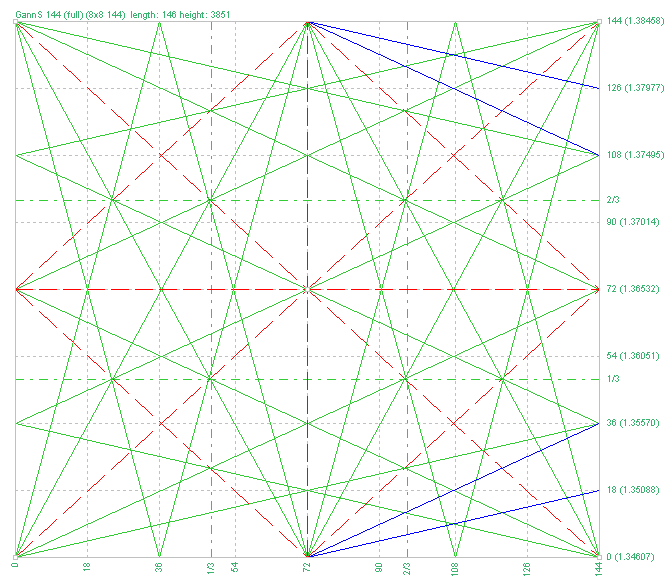
Hi Tara, Sorry to bother you with this, but about 1 year or so I bought from you the Square 144 indicator, but I try to use it now and doesn't work. can you please help me on this issue? thank you
Taras Slobodyanik
2021.06.07
Of course, write to me in private messages, I will tell you how to download the purchased product from the market.
Taras Slobodyanik
· 1
leonchulo
2021.06.05
Hi Tara, Sorry to bother you with this, but about 1 year or so I bought from you the Square 144 indicator, but I try to use it now and doesn't work. can you please help me on this issue? thank you