Taras Slobodyanik / Profilo
- Informazioni
|
10+ anni
esperienza
|
60
prodotti
|
242
versioni demo
|
|
629
lavori
|
0
segnali
|
0
iscritti
|
1) Now, the indicator can draw levels using fractals. The parameter "Draw Support & Resistance on the Fractals"
2) Added option to disable points at the beginning of the lines - "Dot at the start of line". And the option for the size of these points - "Font size dot".
3) Now you can run several indicators in one chart.
4) Code optimization.
ZigZag Lines MTF (обновление 2.20)
1) Теперь индикатор может рисовать уровни используя фракталы. Параметр "Draw Support & Resistance on the Fractals".
2) Добавлена опция для отключения точек в начале линий "Dot at the start of line". И опция размера этих точек "Font size dot".
3) Теперь можно запускать несколько индикаторов в одном окне.
4) Оптимизация кода.
1) Non-standard periods are added: Year, Half-year, Months 4, Quarter, Months 2.
2) Added option: "Do not count the weekends (on D1)".
3) Added option: "Show period separator (vertical lines)".
4) Code optimization.
Fibo Candle Previous 2.00 (Новая версия)
1) Добавлены нестандартные периоды: Год, Полугодие, 4 Месяца, Квартал, 2 Месяца.
2) Добавлена опция: не учитывать котировки выходных дней ("Don't count the weekends (on D1)") .
3) Добавлена опция: показать разделитель периодов ("Show period separator (vertical lines)").
4) Оптимизация кода.
L'indicatore mostra i livelli Alto/Basso/Apertura/Chiusura da altri intervalli di tempo (e non standard): Anno, 6 Mesi, 4 Mesi, 3 Mesi, 2 Mesi, Mese, Settimana, Giorno, H3-H6-H8-H12 Ore . Puoi anche impostare lo spostamento per l'apertura delle candele e costruire candele virtuali. I "separatori di periodo" per uno di questi intervalli di tempo sono disponibili sotto forma di linee verticali. Gli avvisi possono essere configurati per i breakout dei livelli attuali o precedenti (breakout della
Modifica multivaluta e multitimeframe dell'oscillatore stocastico. È possibile specificare qualsiasi valuta e intervallo di tempo desiderati nei parametri. Il pannello visualizza i valori correnti e le intersezioni delle linee: Segnale e Principale (crossover stocastico). Inoltre, l'indicatore può inviare notifiche quando si attraversano i livelli di ipercomprato e ipervenduto. Cliccando su una cella con un punto, questo simbolo e punto verranno aperti. Questo è lo scanner MTF. Similmente al
Modifica multivaluta e multitimeframe dell'indicatore Relative Strength Index (RSI). È possibile specificare qualsiasi valuta e intervallo di tempo desiderati nei parametri. Inoltre, il pannello può inviare notifiche quando si attraversano i livelli di ipercomprato e ipervenduto. Cliccando su una cella con un punto, questo simbolo e punto verranno aperti. Questo è lo scanner MTF. La chiave per nascondere la dashboard dal grafico è "D" per impostazione predefinita. Similmente al Valuta Strength
Modifica multivaluta e multitimeframe dell'oscillatore stocastico. È possibile specificare qualsiasi valuta e intervallo di tempo desiderati nei parametri. Il pannello visualizza i valori correnti e le intersezioni delle linee: Segnale e Principale (crossover stocastico). Inoltre, l'indicatore può inviare notifiche quando si attraversano i livelli di ipercomprato e ipervenduto. Cliccando su una cella con un punto, questo simbolo e punto verranno aperti. Questo è lo scanner MTF. Similmente al
1) Added calculation the inclination angle between the Closes of adjacent bars.
Обновление "Angle High Low"
1) Добавлено вычисление угла наклона между ценами закрытия соседних баров.
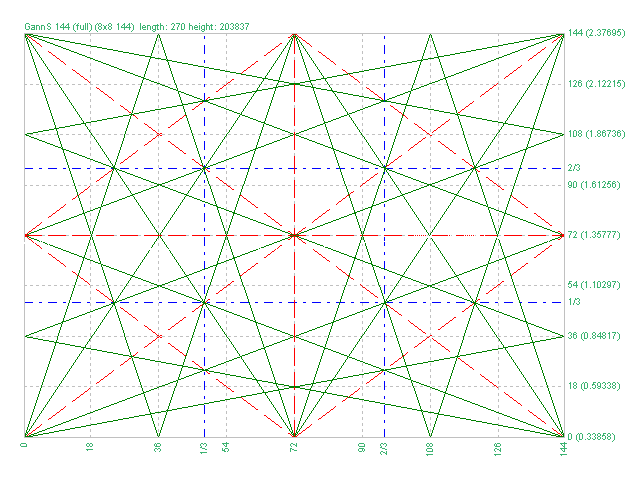
1) Added markup "Square of 144 (full)"
2) Added grid 8х8 (144)
3) Added individual parameters for Grid 1/3 (Grid of one-third)
Обновление для "Коробки Ганна"
1) Добавлена разметка "Square of 144 (full)"
2) Добавлена сетка 8х8 (144)
3) Добавлены отдельные параметры для Сетки 1/3 (Grid of one-third)
1) Minor bug fixed.
2) Code optimization.
3) Added a setting for the line style.
Новое обновление индикатора "Lines Profit Loss" MT4 & MT5
1) Исправлена незначительная ошибка.
2) Оптимизация кода.
3) Добавлен стиль для линий.
1) Added the selection of the indication type - Line or Arrow.
2) Fixed an error with the zero bar.
3) Fixed the "Friday-Monday" error.
Обновление для "Inside Bar" MT4 & MT5.
1) Добавлен выбор типа индикатора - Линия или Стрелка.
2) Исправлена ошибка нулевого бара.
3) Исправлена ошибка "пятница-понедельник".
Version 2.0 - 2017.05.19
1) Added new grids
2) Added Arcs (gunner24)
3) Added the ability to plot by prices.
4) Added lines of 1/3 and 2/3 grid
5) Increased the plotting accuracy
L'indicatore disegna automaticamente i livelli di Fibonacci in base all'indicatore ZigZag, alle sessioni di trading, ai frattali o alle candele (inclusi intervalli di tempo non standard: anno, 6 mesi, 4 mesi, 3 mesi, 2 mesi) (ritracciamento automatico di Fibonacci). Puoi scegliere qualsiasi intervallo di tempo più lungo per il calcolo di Fibonachi. I livelli vengono ridisegnati ogni volta che la barra corrente si chiude. È possibile abilitare gli avvisi quando si superano i livelli specificati
Multi timeframe ZigZag indicator. It displays the support/resistance horizontal lines and their breakouts, as well as draws the current targets of the market. It can also display lines of the Fractals indicator and candles from other periods (up to Quarterly). So, you can actually see the supply and demand levels. Indicator – connects key lows and highs to show trend lines. You can also use it as indicator for the Break of Structure(BOS) & Market Structure Shift(MSS). The
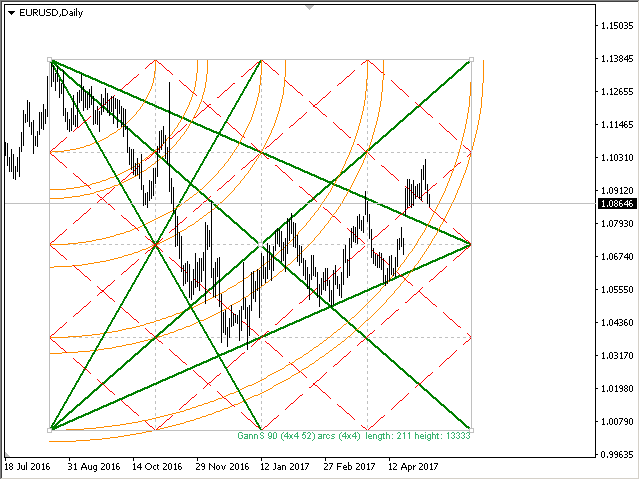
The Gann Box (or Gann Square) is a market analysis method based on the "Mathematical formula for market predictions" article by W.D. Gann. This indicator can plot three models of Squares: 90, 52(104), 144. There are six variants of grids and two variants of arcs. You can plot multiple squares on one chart simultaneously. Parameters Square — selection of a Gann square model: 90 — square of 90 (or square of nine); 52 (104) — square of 52 (or 104); 144 — universal square of 144; 144 (full) —
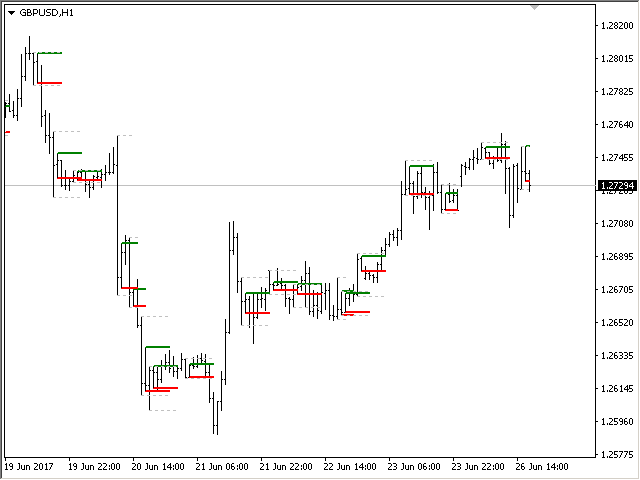
The indicator determines the inside bar and marks its High/Low. It is plotted based on the closed candles (does not redraw). The identified inside bar can be displayed on the smaller periods. You may set a higher period (to search for the inside bar) and analyze on a smaller one. Also you can see the levels for Mother bar. Indicator Parameters Period to find Inside Bar — the period to search for the inside bar. If a specific period is set, the search will be performed in that period Type of