• Informazioni
12+ anni
esperienza
62
prodotti
1212
versioni demo
4
lavori
0
segnali
0
iscritti
Harmonic Pattern Indicator - Repainting + Japanese Candlestick Pattern Scanner + Automatic Channel + Many more

https://www.mql5.com/en/market/product/4488

https://www.mql5.com/en/market/product/4475

https://algotrading-investment.com/portfolio-item/harmonic-pattern-plus/


Non Repainting and Non Lagging Harmonic Pattern Indicator – Customizable Harmonic + Japanese Candlestic Pattern Scanner + Advanced Channel + Many more

https://www.mql5.com/en/market/product/41993

https://www.mql5.com/en/market/product/41992

https://algotrading-investment.com/portfolio-item/profitable-pattern-scanner/


Supply Demand Indicator – Multiple Timeframe Scanning Added + Non Repainting + Professional Indicator

https://www.mql5.com/en/market/product/40076

https://www.mql5.com/en/market/product/40075

https://algotrading-investment.com/portfolio-item/ace-supply-demand-zone/


Momentum Indicator – Path to Volume Spread Analysis

https://www.mql5.com/en/market/product/30641

https://www.mql5.com/en/market/product/30621

https://algotrading-investment.com/portfolio-item/excessive-momentum-indicator/


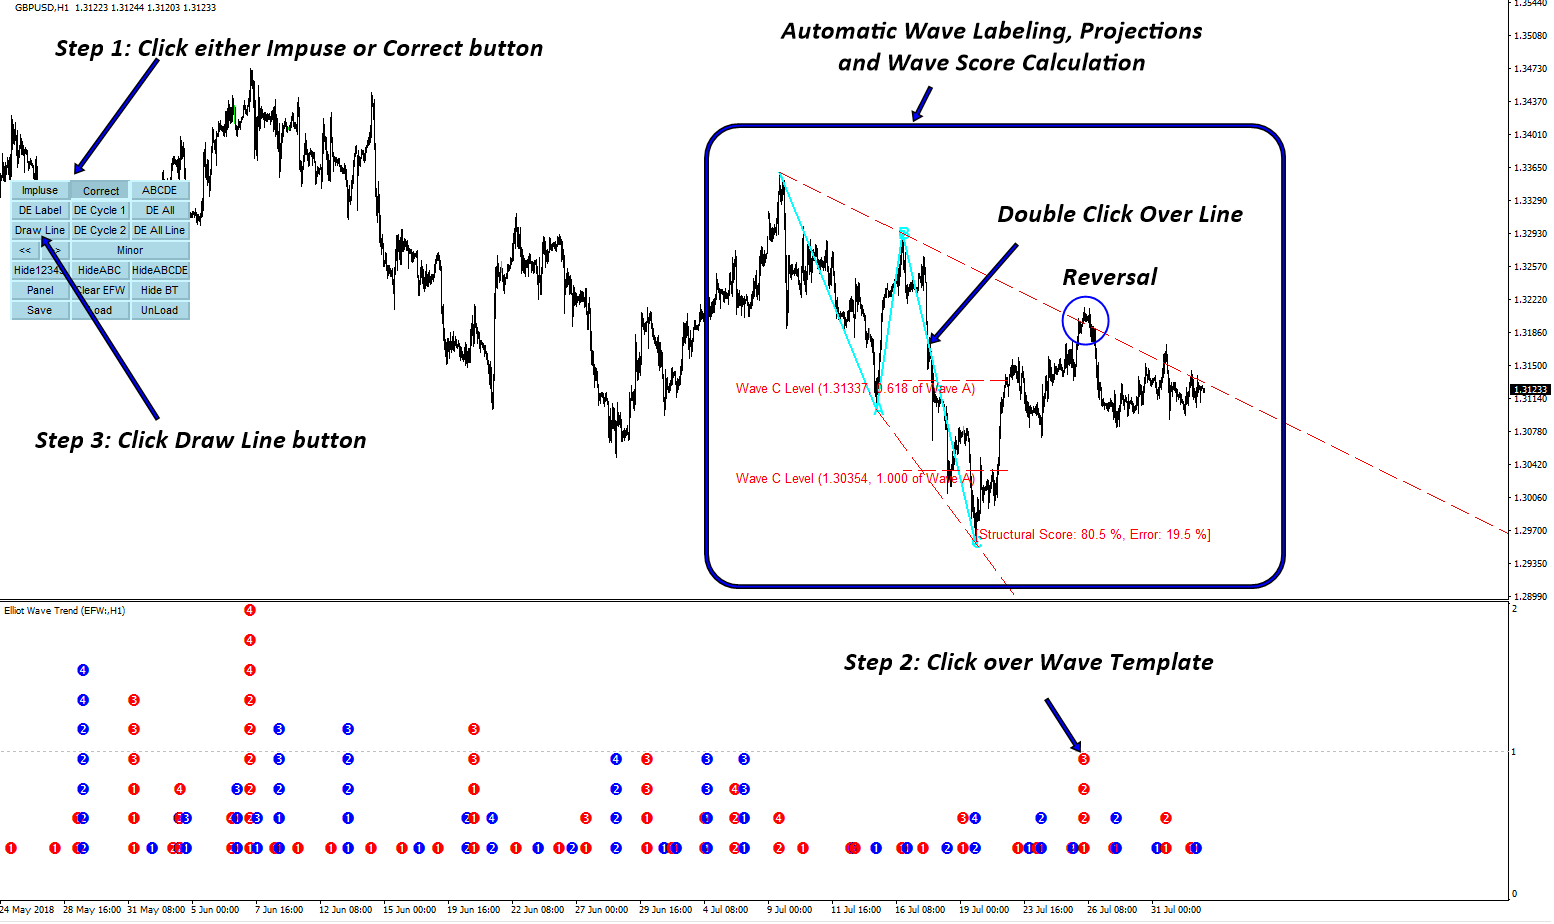
Elliott Wave Indicator for the Power User

https://www.mql5.com/en/market/product/16479

https://www.mql5.com/en/market/product/16472

https://algotrading-investment.com/portfolio-item/elliott-wave-trend/


Forex Prediction - Turn Support and Resistance to the Advanced Strategy

https://www.mql5.com/en/market/product/49170

https://www.mql5.com/en/market/product/49169

https://algotrading-investment.com/portfolio-item/fractal-pattern-scanner/


MetaTrader 4 and MetaTrader 5 Product Page: https://www.mql5.com/en/users/financeengineer/seller#products


Free Forex Prediction with Fibonacci Analysis: https://algotrading-investment.com/2020/10/23/forex-prediction-with-fibonacci-analysis/

Free Harmonic Pattern Signal: https://algotrading-investment.com/2020/12/17/harmonic-pattern-signal-for-forex-market/

============================================================================================================================

Here are the trading education books. We recommend reading these books if you are a trader or investor in Forex and Stock market. In the list below, we put the easy to read book on top. Try to read the easy to read book first and try to read the harder book later to improve your trading and investment.


First Link = amazon.com, Second Link = Google Play Books, Third Link = algotrading-investment.com, Fourth Link = Google Books


Technical Analysis in Forex and Stock Market (Supply Demand Analysis and Support Resistance)

https://www.amazon.com/dp/B09L55ZK4Z

https://play.google.com/store/books/details?id=pHlMEAAAQBAJ

https://algotrading-investment.com/portfolio-item/technical-analysis-in-forex-and-stock-market/

https://books.google.co.kr/books/about?id=pHlMEAAAQBAJ


Science Of Support, Resistance, Fibonacci Analysis, Harmonic Pattern, Elliott Wave and X3 Chart Pattern (In Forex and Stock Market Trading)

https://www.amazon.com/dp/B0993WZGZD

https://play.google.com/store/books/details?id=MME3EAAAQBAJ

https://algotrading-investment.com/portfolio-item/science-of-support-resistance-fibonacci-analysis-harmonic-pattern/

https://books.google.co.kr/books/about?id=MME3EAAAQBAJ


Profitable Chart Patterns in Forex and Stock Market (Fibonacci Analysis, Harmonic Pattern, Elliott Wave, and X3 Chart Pattern)

https://www.amazon.com/dp/B0B2KZH87K

https://play.google.com/store/books/details?id=7KrQDwAAQBAJ

https://algotrading-investment.com/portfolio-item/profitable-chart-patterns-in-forex-and-stock-market/

https://books.google.com/books/about?id=7KrQDwAAQBAJ


Guide to Precision Harmonic Pattern Trading (Mastering Turning Point Strategy for Financial Trading)

https://www.amazon.com/dp/B01MRI5LY6

https://play.google.com/store/books/details?id=8SbMDwAAQBAJ

http://algotrading-investment.com/portfolio-item/guide-precision-harmonic-pattern-trading/

https://books.google.com/books/about?id=8SbMDwAAQBAJ


Scientific Guide to Price Action and Pattern Trading (Wisdom of Trend, Cycle, and Fractal Wave)

https://www.amazon.com/dp/B073T3ZMBR

https://play.google.com/store/books/details?id=5prUDwAAQBAJ

https://algotrading-investment.com/portfolio-item/scientific-guide-to-price-action-and-pattern-trading/

https://books.google.com/books/about?id=5prUDwAAQBAJ


Predicting Forex and Stock Market with Fractal Pattern: Science of Price and Time

https://www.amazon.com/dp/B086YKM8BW

https://play.google.com/store/books/details?id=VJjiDwAAQBAJ

https://algotrading-investment.com/portfolio-item/predicting-forex-and-stock-market-with-fractal-pattern/

https://books.google.com/books/about?id=VJjiDwAAQBAJ


Trading Education Book 1 in Korean (Apple, Google Play Book, Google Book, Scribd, Kobo)


https://books.apple.com/us/book/id1565534211

https://play.google.com/store/books/details?id=HTgqEAAAQBAJ

https://books.google.co.kr/books/about?id=HTgqEAAAQBAJ

https://www.scribd.com/book/505583892

https://www.kobo.com/ww/en/ebook/8J-Eg58EDzKwlpUmADdp2g


Trading Education Book 2 in Korean (Apple, Google Play Book, Google Book, Scribd, Kobo)

https://books.apple.com/us/book/id1597112108

https://play.google.com/store/books/details?id=shRQEAAAQBAJ

https://books.google.co.kr/books/about?id=shRQEAAAQBAJ

https://www.scribd.com/book/542068528

https://www.kobo.com/ww/en/ebook/X8SmJdYCtDasOfQ1LQpCtg


About Young Ho Seo

Young Ho Seo is an Engineer, Financial Trader, and Quantitative Developer, working on Trading Science and Investment Engineering since 2011. He is the creator of many technical indicators, price patterns and trading strategies used in the financial market. He is also teaching the trading practice on how to use the Supply Demand Analysis, Support, Resistance, Trend line, Fibonacci Analysis, Harmonic Pattern, Elliott Wave Theory, Chart Patterns, and Probability for Forex and Stock Market. His works include developing scientific trading principle and mathematical algorithm in the work of Benjamin Graham, Everette S. Gardner, Benoit Mandelbrot, Ralph Nelson Elliott, Harold M. Gartley, Richard Shabacker, William Delbert Gann, Richard Wyckoff and Richard Dennis. You can find his dedicated works on www.algotrading-investment.com . His life mission is to connect financial traders and scientific community for better understanding of this world and crowd behaviour in the financial market. He wrote many books and articles, which are helpful for understanding the technology and application behind technical analysis, statistics, time series forecasting, fractal science, econometrics, and artificial intelligence in the financial market.


If you are interested in our software and training, just visit our main website: www.algotrading-investment.com
Young Ho Seo
Young Ho Seo
Fibonacci Price Patterns


A Fibonacci analysis is a popular tool among technical traders. It is based on the Fibonacci sequence numbers identified by Leonardo Fibonacci in the 13th century. The Fibonacci sequence numbers are:

0, 1, 1, 2, 3, 5, 8, 13, 21, 34, 55, 89,144, 233, 377, 610, 987, 1597, 2584, 4181, 6765, …………………

As the Fibonacci number become large, the constant relationship is established between neighbouring numbers. For example, every time, when we divide the former number by latter: Fn-1/Fn, we will get nearly 0.618 ratio. Likewise, when we divide the latter number by former: Fn/Fn-1, we will get nearly 1.618. These two Fibonacci ratio 0.618 and 1.618 are considered as the Golden Ratio. We can use these Golden ratios to start our Fibonacci analysis. However, many technical traders use additional Fibonacci ratios derived from the Golden ratio. Since the calculation of each Fibonacci ratio is well known, I have listed all the available Fibonacci ratio calculation in Table 6.1.


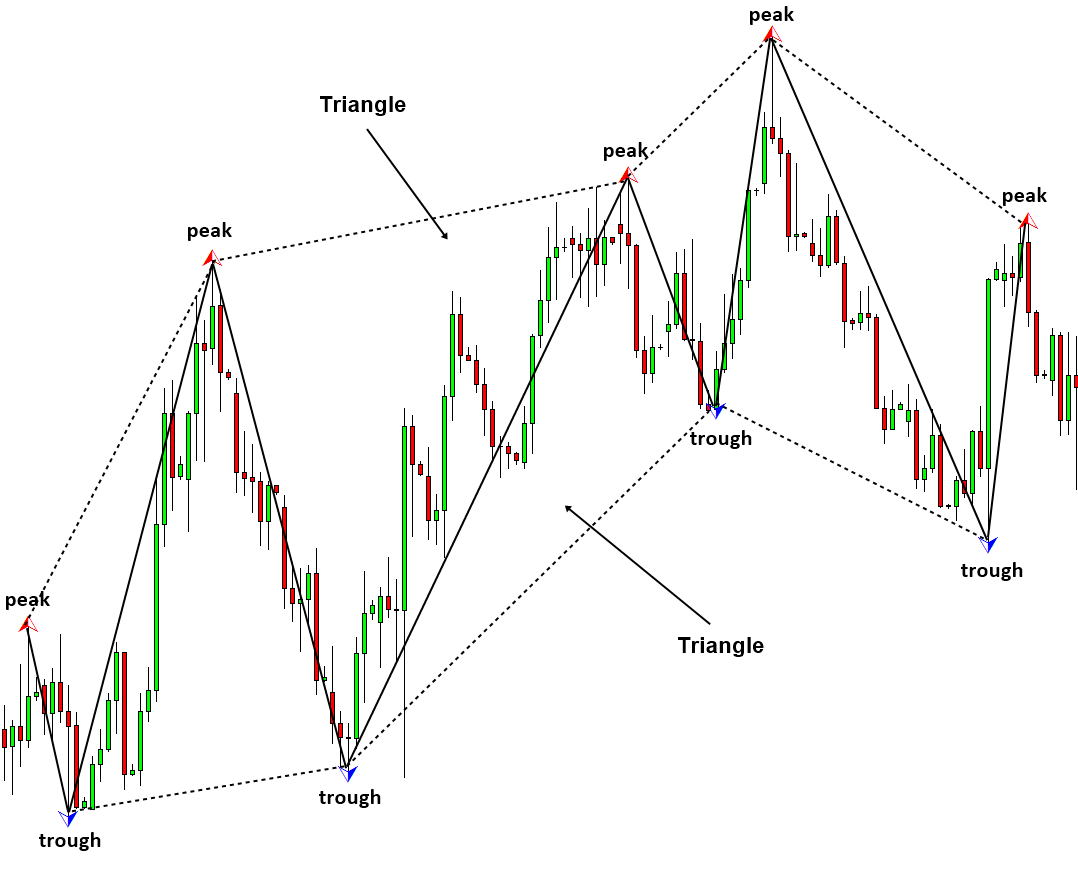
In fact, Fibonacci pattern analysis in financial trading is extremely popular. As with support and resistance analysis, Fibonacci analysis is probably the most popular technical analysis among traders. There are two important techniques in Fibonacci analysis. First technique is Fibonacci retracement. Second technique is Fibonacci expansion. In fact, former is just one triangle pattern and latter is two triangle patterns. Hence, you can consider these two as Fibonacci price patterns. These two price patterns share the identical concept to the retracement ratio and expansion ratio.

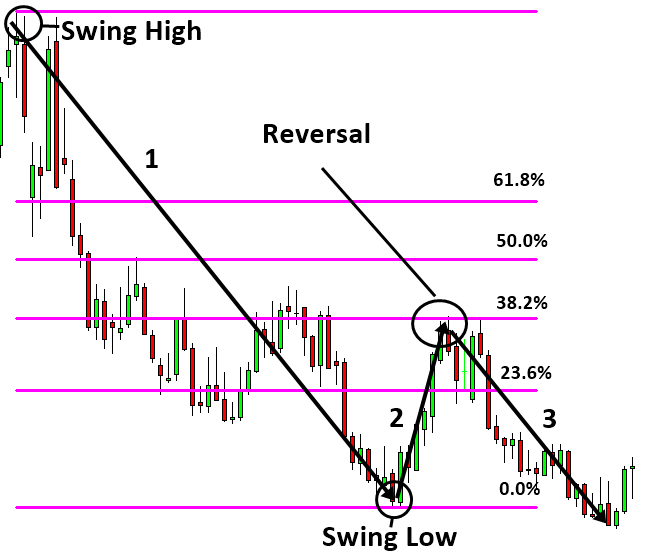
There are two important points in regards to Fibonacci patterns. Firstly, you need to spot swing high and swing low in price series to identify Fibonacci price patterns. The easiest way of doing this is just to apply Peak Trough Transformation using either ZigZag indicator or Renko chart. Therefore, you start with predefined swing points in your chart. Secondly, Fibonacci retracement technique will concern one triangle that is two price swings. Fibonacci expansion technique will concern two triangles that are three price swings. Most importantly, calculation of Fibonacci retracement and expansion is identical to the retracement ratio and expansion ratio calculation in RECF notation. Sometimes, we might use percentage format instead of decimal format. However, two quantities are the same. For example, the Golden ratio 0.618 is the same as 61.8%.

Let us start with Fibonacci retracement example. For simple example, we use 61.8% Golden ratio. For retracement, we can have two cases including bullish (Trough-Peak) retracement and bearish (Peak-Trough) retracement. In bullish retracement, 61.8% retracement level will act as a support level. Price will reverse in the correction phase to follow the previous bullish movement. In RECF pattern definition, 61.8% bullish retracement can be expressed as below:

R0 = 0.618 = Right swing of first triangle / Left swing of first triangle


Likewise, in bearish retracement, 61.8% level will act as resistance. Price will reverse in the correction phase to follow the previous bearish movement. In both case, the 61.8% retracement will be measured from end of correction phase to previous peak or trough. We have used percentage in this example. Some technical traders prefer to use the ratios in decimal places like 0.618. It is just your preferences. Using ratio or percentage does not affect the accuracy of trading. In RECF pattern definition, 61.8% bearish retracement can be expressed as below:

R0 = 0.618 = Right swing of first triangle / Left swing of first triangle


You can use other Fibonacci ratios like 0.382 or 1.618 in the exactly same way as 0.618. Some traders use secondary Fibonacci ratios in addition to the primary ratios.

Fibonacci expansion is slightly more complicated than Fibonacci retracement because it concerns two triangle (i.e. three price swings). As in retracement technique, we can have two cases including bearish (Trough-Peak) expansion and bullish (Peak-Trough) expansion. In bearish expansion, we will measure the expansion from where the correction ends to next peak. In the next peak, we will expect the bearish reversal in the same direction to the correction. In fact, the 100% Expansion level is act as the resistance in Figure 6-3. Likewise, in bullish expansion, we will expect the bullish reversal in the same direction to the correction. In Figure 6-4, 61.8% expansion level acts as the support. In RECF pattern definition, 61.8% bearish and bullish retracement can be expressed as below:

E0 = 0.618 = Right swing of first triangle / Left swing of second triangle


About this Article

This article is the part taken from the draft version of the Book: Profitable Chart Patterns in Forex and Stock Market: Fibonacci Analysis, Harmonic Pattern, Elliott Wave, and X3 Chart Pattern. Full version of the book can be found from the link below:

https://algotrading-investment.com/portfolio-item/profitable-chart-patterns-in-forex-and-stock-market/

You can also use Harmonic Pattern Plus in MetaTrader to accomplish your technical analysis. Harmonic Pattern Plus is the advanced Fibonacci Analysis Indicator for your trading. Below are the Links to Harmonic Pattern Plus

https://www.mql5.com/en/market/product/4488

https://www.mql5.com/en/market/product/4475

https://algotrading-investment.com/portfolio-item/harmonic-pattern-plus/

Below is the landing page for Optimum Chart (Standalone Charting and Analytical Platform).

https://algotrading-investment.com/2019/07/23/optimum-chart/
Amos Tsopotsa
Amos Tsopotsa 2022.02.05
do you have any fibo you recommend
Young Ho Seo
Young Ho Seo
Pairs Trading and Spread Analysis Guide

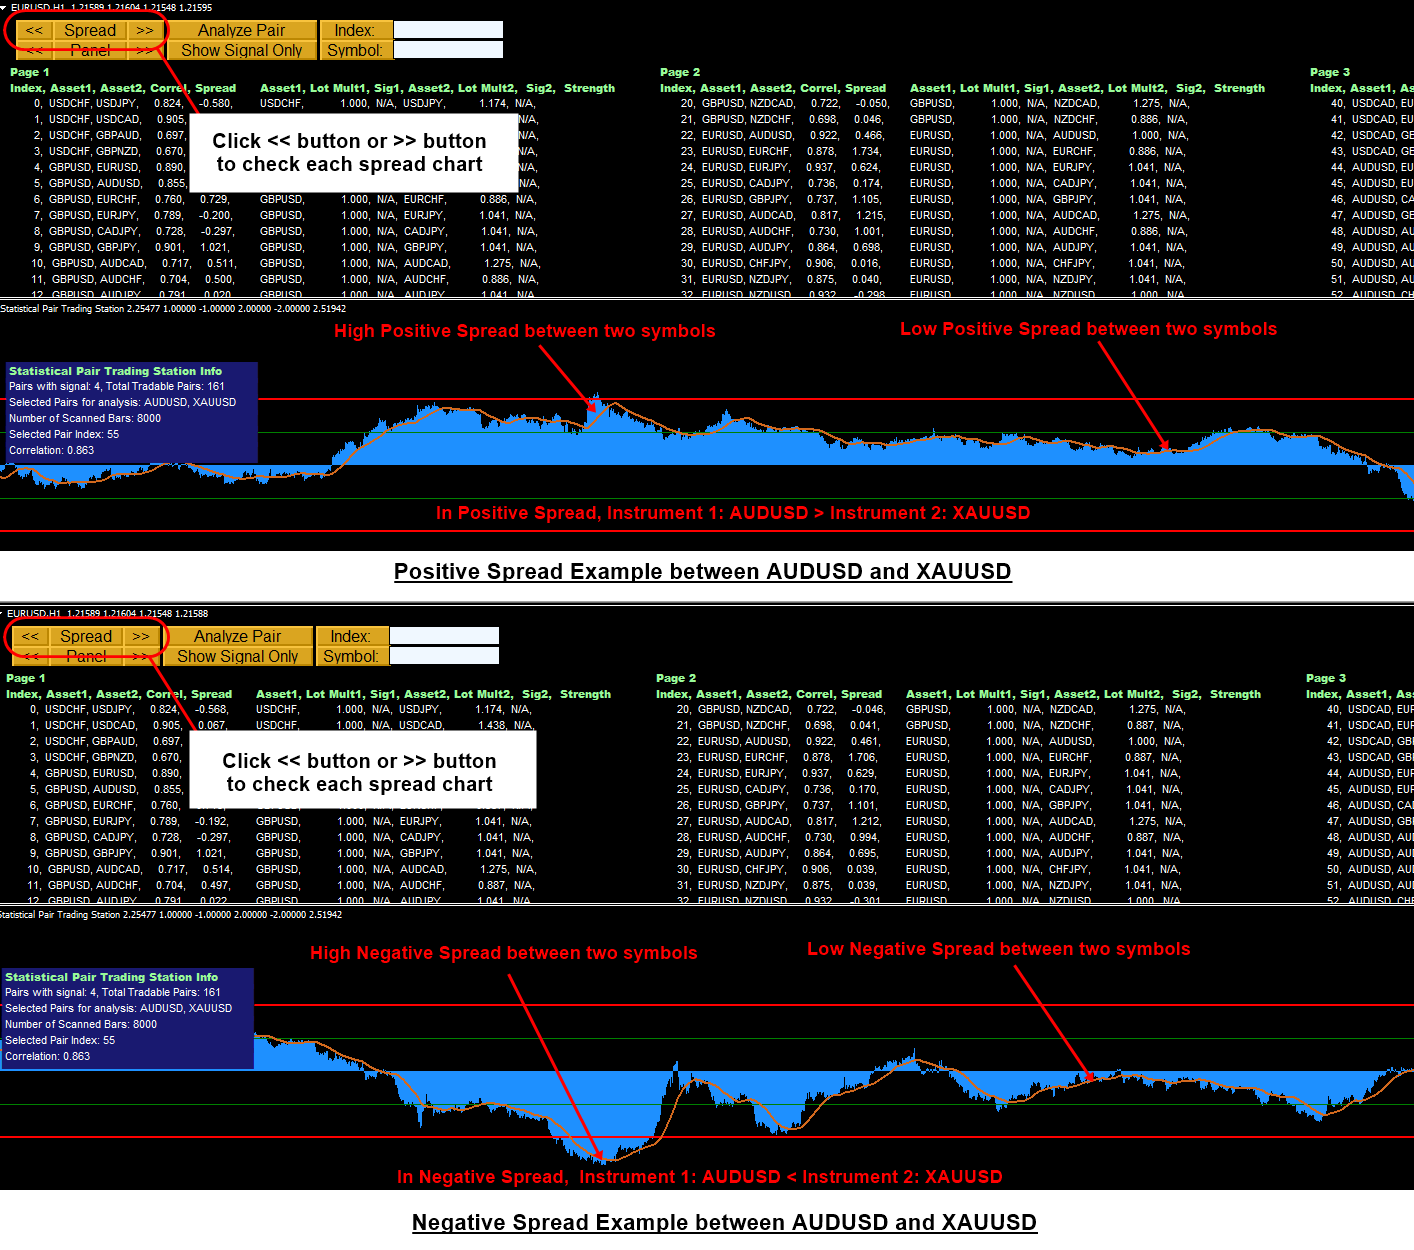
Pairs Trading and Spread Analysis is the efficient tool to monitor the unusual market event or market anomaly. The advantage of Pairs Trading and Spread Analysis comes from its sophisticated statistical analysis across different instruments. For Forex and Stock market trading, it works both. Many hedge fund manager and professional fund manager are using Pairs Trading and Spread Analysis to seek profits.

In Optimum Chart, we provide the automated solution for Pairs Trading and spread analysis. This sophisticated statistical analysis can be done in few button clicks. All you have to do is to apply the end results for your trading.

The good thing about Optimum Chart is that it provides the the complete statistical analysis across all time frame and all symbols. Then it would provide the powerful insight in one table for all available instruments.

In Optimum Chart, this powerful statistical analysis can be done in two steps.

Step 1: Tick on Scan all timeframe box

Step 2: Click on Calculate Cointegration of Pairs

That is it. It is easy as ABC while the pairs trading and spread analysis is used by the sophisticated analyst in the fund management and hedge fund industry. After the button click, Optimum Chart would perform lots of calculation at background until it go through all the possible combination of different symbols across all timeframe. After that, it would provide you the buy and sell signals according to their spread strength. Hence, you will get weak, medium and strong signals according to the current spread.

The signals are simply determined by the magnitude of spread. In default signal setting, Weak signal are produced if the spread is between 2 and 3. Medium signals are produced if the spread is between 3 and 4. Strong signals are produced if the spread is over 4. Optimum Chart will also provide the lot size multiplier after the computation is done. The lot size multiplier is determined by their tick value. Typical Forex market tick values are applied for Forex market. You can find the tick values of each Forex symbol in the link below.

https://algotrading-investment.com/2020/07/19/optimum-chart-forex-symbol-tick-values/

For the Stock market, the multiplier is simply the price ratio of two instruments. Multiplier helps you to determine how big the contract size (i.e. lot size or number of shares) for the pairs (i.e. for asset 1 and asset 2).

This video below can explain more about Pairs Trading and Spread Analysis with Optimum Chart.

YouTube Video Link: https://www.youtube.com/watch?v=gHL9MI6yysw

Landing page for our Optimum Chart can be found at below.

https://algotrading-investment.com/2019/07/23/optimum-chart/
Young Ho Seo
Young Ho Seo
YouTube Video for X3 Chart Pattern Scanner

Video can explain a lot of details about how things works. You can use this video for first guide on using X3 Chart Pattern Scanner.

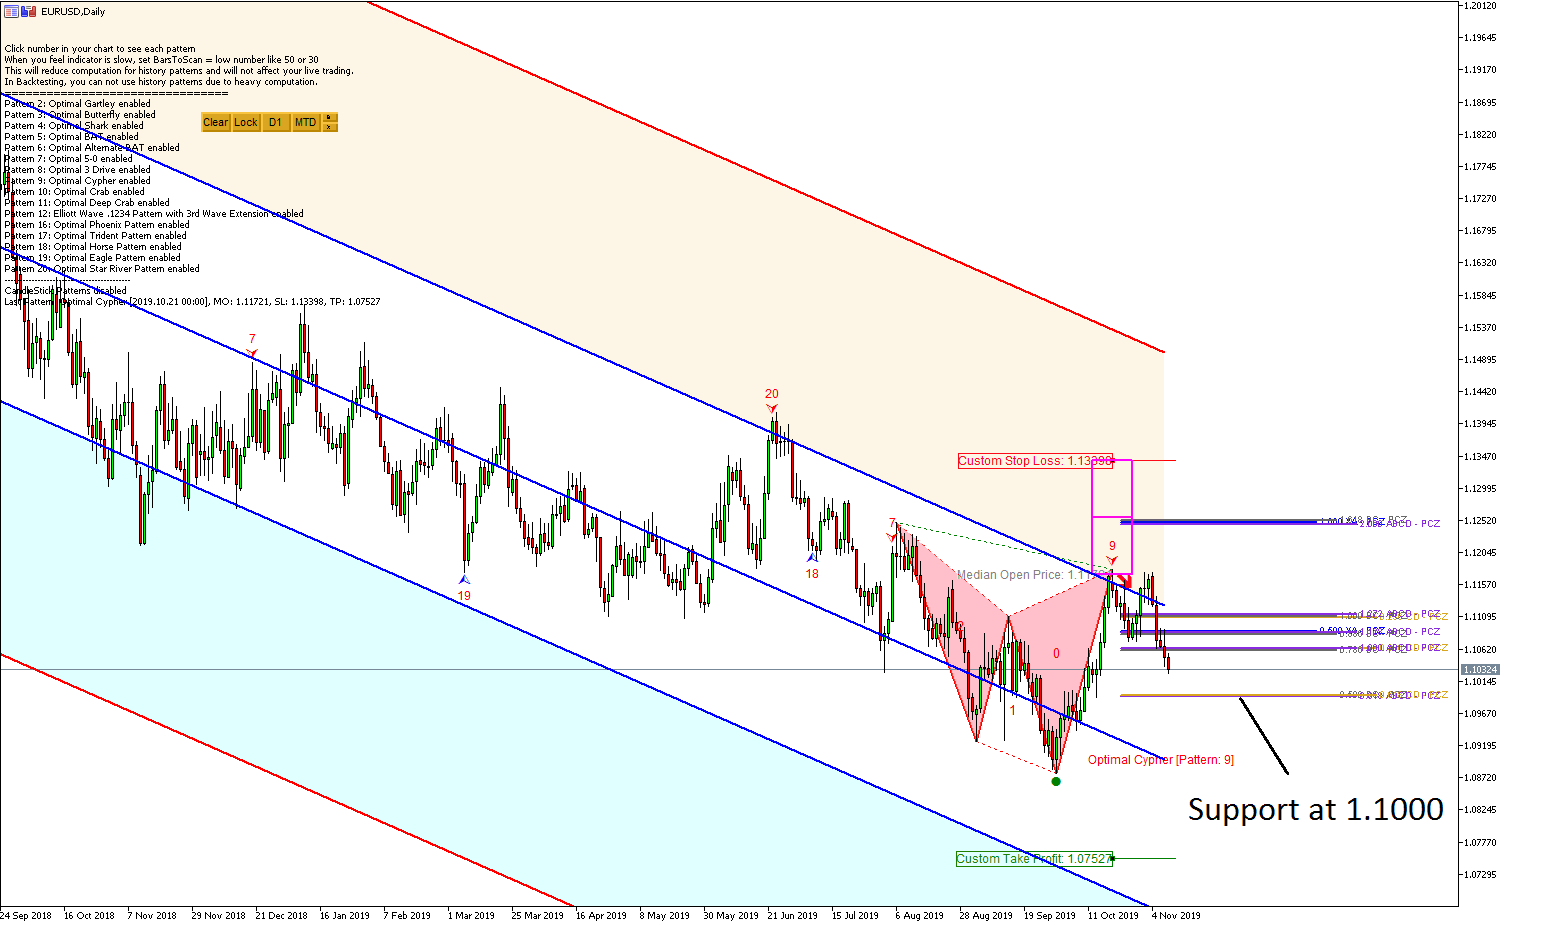
This video was originally created for the previous Optimal Turning Point Pattern Scanner. However, X3 Chart Pattern Scanner uses almost same user interface (with a lot of powerful additional features). Hence, you can use this video for X3 Chart Pattern Scanner too. For your information, since X3 Chart Pattern Scanner comes with a lot of new additional features, the video does not cover for those features. For example, X3 Chart pattern scanner can provide

Harmonic Patterns
X3 Chart Patterns
52 Japanese candlestick patterns
Automatic double standard deviation channel
and many more powerful features
Non Repainting Non Lagging Harmonic Pattern Scanner: https://www.youtube.com/watch?v=uMlmMquefGQ

Chart Pattern Scanner: https://youtu.be/2HMWZfchaEM

Also here is the product page for the X3 Chart Pattern Scanner. Enjoy the powerful non repainting and non lagging Harmonic Pattern, X3 Pattern and Elliott Wave Pattern indicator.

https://www.mql5.com/en/market/product/41993

https://www.mql5.com/en/market/product/41992

https://algotrading-investment.com/portfolio-item/profitable-pattern-scanner/
Young Ho Seo
Young Ho Seo
Peak Trough Analysis

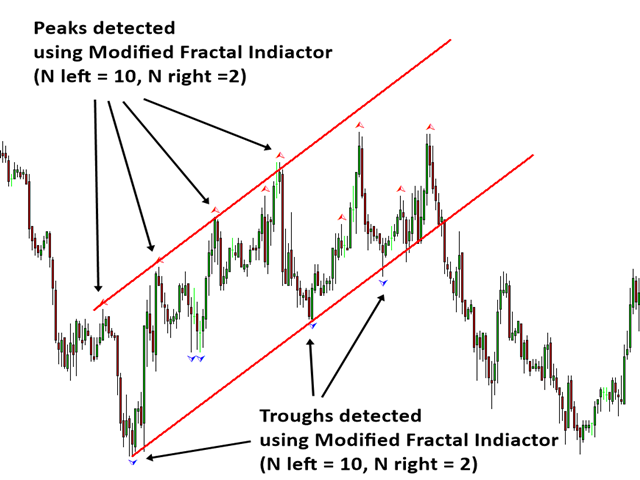
We have released Peak Trough Analysis tool on 2017 nearly at the same time we were writing on the book: Scientific Guide to Price Action and Pattern Trading (Wisdom of Trend, Cycle, and Fractal Wave). It was because peak trough analysis helps you a lot of price action and pattern trading.

If know the principle, there is not doubt that this peak trough analysis tool is very powerful for your trading. We have also created a YouTube video to explain the download steps for this peak trough analysis indicator. Please watch this YouTube Video tilted as MetaTrader Indicator for Wave Analysis.

https://www.youtube.com/watch?v=GzYChpAKUaU

Here is the download link for the free Peak Trough Analysis Tool for MetaTrader 4 and MetaTrader 5.

https://www.mql5.com/en/market/product/23797

https://www.mql5.com/en/market/product/22420

https://algotrading-investment.com/portfolio-item/peak-trough-analysis-tool/

If you can understand how peak trough analysis works for your trading. You can use peak trough analysis together with either Advanced Price Pattern Scanner or Price Breakout Pattern Scanner to yield better profits. Both tools are great to be used together with above free peak trough analysis tools. Hence, we share the link for both.

Below are the links to Advanced Price Pattern Scanner.

https://www.mql5.com/en/market/product/24679

https://www.mql5.com/en/market/product/24678

https://algotrading-investment.com/portfolio-item/advanced-price-pattern-scanner/

Below are the links to Price breakout Pattern Scanner

https://www.mql5.com/en/market/product/4859

https://www.mql5.com/en/market/product/4858

https://algotrading-investment.com/portfolio-item/price-breakout-pattern-scanner/

You can also use our other product together with Peak Trough Analysis. Here is the entire product list.

https://www.mql5.com/en/users/financeengineer/seller#products

https://algotrading-investment.com/
Young Ho Seo
Young Ho Seo
How To Use Forex Prediction With Fibonacci Analysis For Free

In this article, we will explain how to use Forex Prediction with Fibonacci Analysis For Free in two steps. In the first step, you can access the Forex Prediction Webpage from the following link. You can book mark this Forex Prediction page below so you can access Forex Prediction any time.

https://algotrading-investment.com/2020/10/23/forex-prediction-with-fibonacci-analysis/

From above page, you will get access to the turning point prediction for Forex market including EURUSD, GBPUSD, USDJPY, BTCUSD, ETHUSD and so on. In fact, most of statistical predictions are not compatible with the actual trading strategy used by the real world trader. However, the turning point probability (and also the trend probability = 1 – turning point probability) is useful because the predictions were measured from the Fractal Wave. Remember that fractal wave is the direct representation of price action. For example, Support, Resistance, Fibonacci Ratio Analysis, Harmonic Pattern, Elliott Wave Theory, X3 Chart Pattern, Symmetric Triangle Pattern, Rising Wedge Pattern, Falling Wedge pattern, Double Top, Double Bottom, Channel, Renko Chart and so on are such technical analysis derived from Fractal Wave. You can consider the turning point probability as the quantified version of the price patterns. Hence, using the turning point probability with these price pattern is really beneficial in assessing the trend strength and risk for your trading. Especially, we recommend using the turning point probability together with any horizontal support resistance. For example, you can use the hand drawn support resistance, supply demand analysis, round number (=psychological number), pivot analysis, Fibonacci analysis, and so on. I am sure you can think of many horizontal support and resistance of your own.

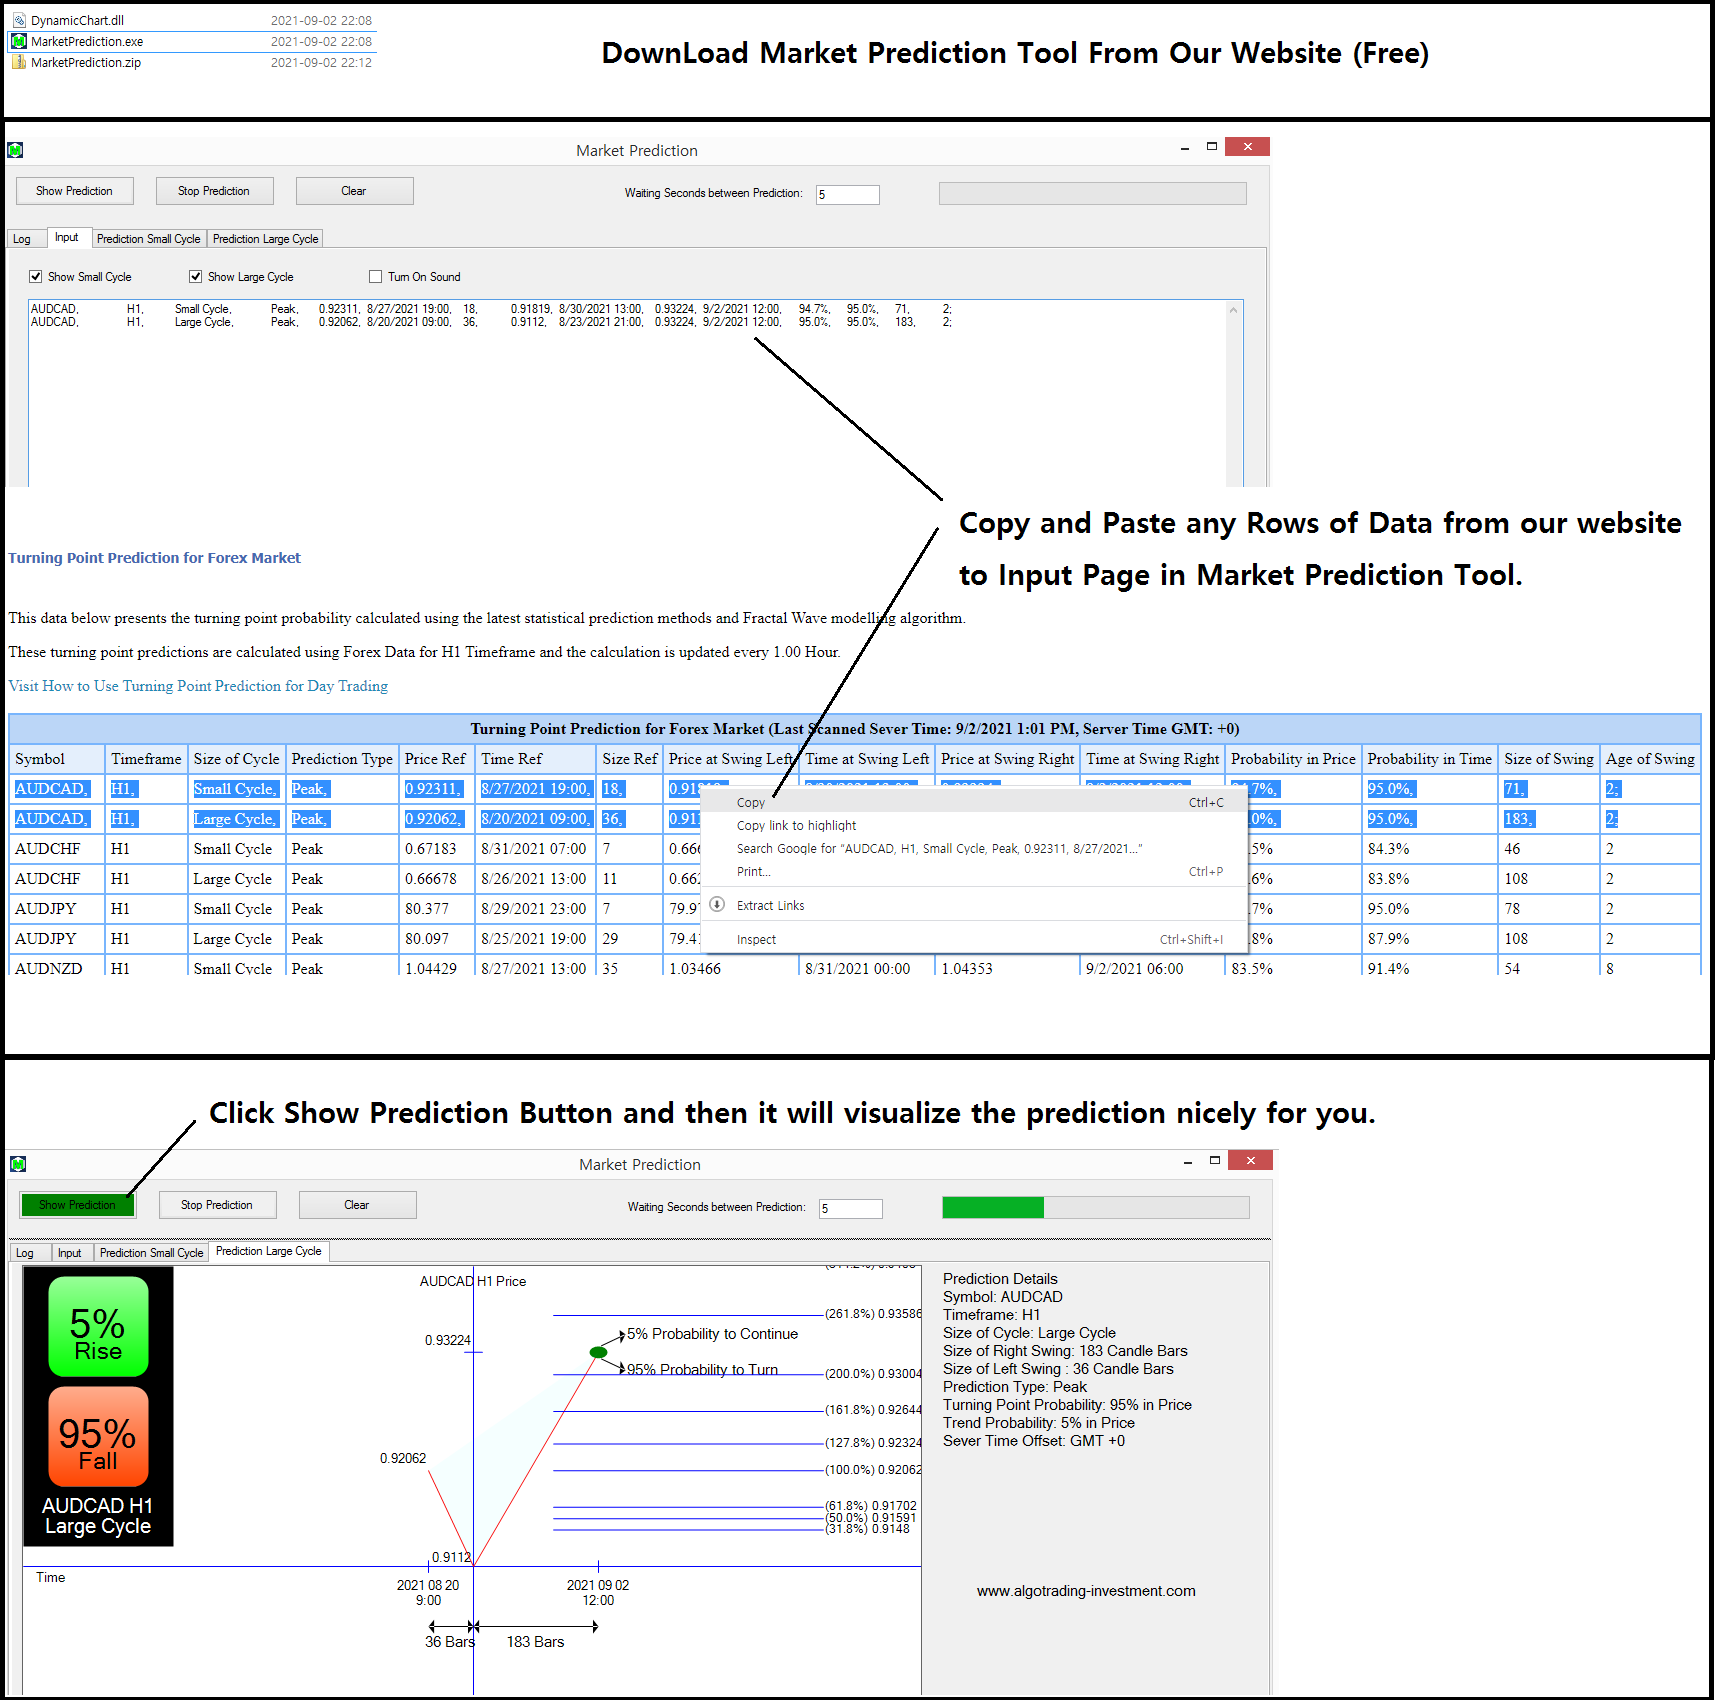
In the second step, you can visualize the turning point probability and Fibonacci Analysis with this free Market Prediction tool from our website or from google drive. Anyway, you will get the same files.

Download Market Prediction Tool (Free, No Installation, No Signup and Use Straight After Download)

https://drive.google.com/file/d/1hzM8FBCMW1ZcVeMhwLTV7TEFM65o3AKg/view?usp=sharing

How to use this Market Prediction Tool is simple. Once, you have downloaded the MarketPrediction.zip file, then extract them anywhere in your hard drive. Then run the Market Prediction.exe file. After, you will find a simple user interface. Copy and paste the rows of data from the Market Prediction Webpage from the link. You can copy multiple rows if you wish. Next, click “Show Prediction” button. The Market Prediction software will automatically visualize the turning point probability and trend probability in friendly format.

If you want to use the premium version of the Forex Prediction, then you can use Fractal Pattern Scanner in MetaTrader or Optimum Chart. Below is the landing page for Fractal Pattern Scanner in MetaTrader version, which you can get the real time prediction in MetaTrader.

https://www.mql5.com/en/market/product/49170

https://www.mql5.com/en/market/product/49169

https://algotrading-investment.com/portfolio-item/fractal-pattern-scanner/
Young Ho Seo
Young Ho Seo
Repainting and Non Repainting Harmonic Pattern Indicator

Here is some quick guide on repainting and non repainting Harmonic Pattern indicators. Pattern Scanner based on Fractal Wave detection algorithm can be either repainting or non repainting one. In our products, we provide two choices between repainting and non repainting. Their capability and their price is different.

For Harmonic Pattern Scanner,

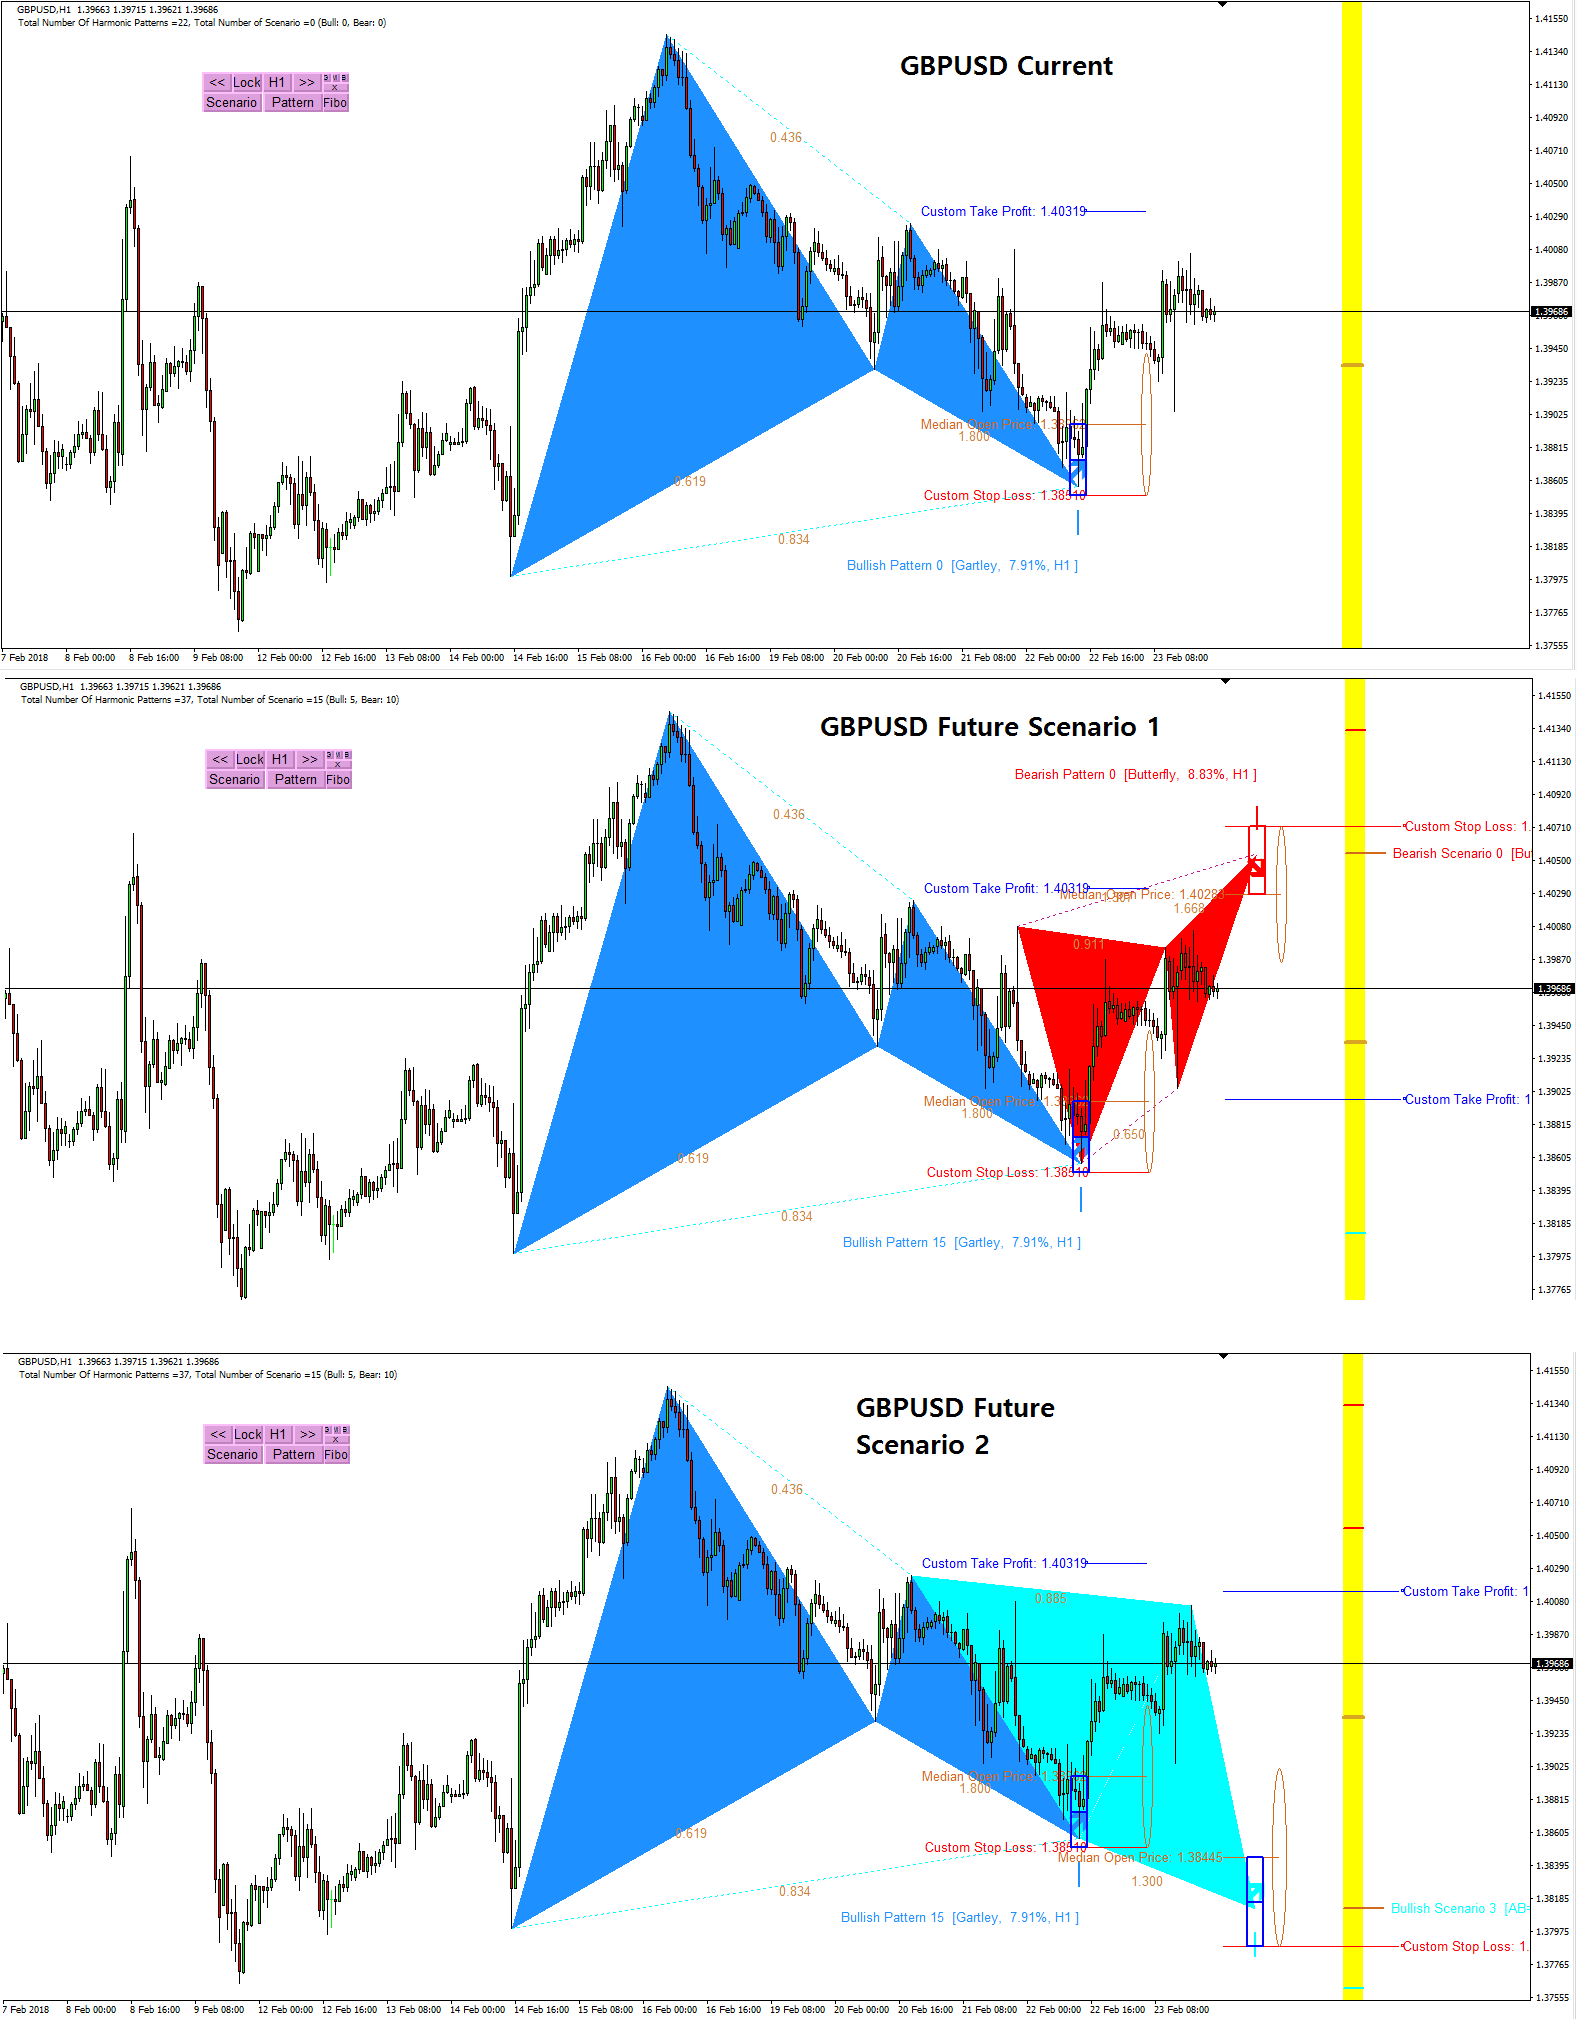
Harmonic Pattern Plus (and also Harmonic Pattern Scenario Planner) is the powerful but they are the repainting Harmonic Pattern Scanner. At the same time, they are cheaper. Below is links for them.

https://www.mql5.com/en/market/product/4488

https://www.mql5.com/en/market/product/4475

https://algotrading-investment.com/portfolio-item/harmonic-pattern-plus/

X3 Chart Pattern Scanner is non repainting and non lagging Harmonic Pattern and X3 pattern Scanner. Below is links for them.

https://www.mql5.com/en/market/product/41993

https://www.mql5.com/en/market/product/41992

https://algotrading-investment.com/portfolio-item/profitable-pattern-scanner/

Typically it is easier to trade with non repainting and non lagging Harmonic Pattern indicator. Of course, the signal will be reserved once they are detected. Hence, if you do not mind the cost, we recommend to use X3 Chart Pattern Scanner since it is non repainting Harmonic Pattern and X3 pattern indicator.

However, if you do not mind repainting Harmonic Pattern Indicator and you want to have something cheaper, then use Harmonic Pattern Plus (or Harmonic Pattern Scenario Planner). Many traders are still do not mind to use the repainting Harmonic Pattern Indicator. They are cheaper too.

If you are starter, we do recommend using non repainting Harmonic Pattern Scanner like X3 Chart Pattern Scanner. It is easier to trade with non repainting indicator. At the same time, there are a lot of bonus features inside X3 Chart Pattern Scanner too.

For your information, we are the only one who supply non repainting and non lagging Harmonic Pattern Indicator in the world. Of course, the first one in the world too.

In addition, you can watch the YouTube Video to feel what is the automated harmonic pattern indicator like. For your information, we provides two YouTube videos with title and links below.

YouTube “Harmonic Pattern Indicator (Repainting but non lagging)”: https://youtu.be/CzYUwk5qeCk

YouTube “Non Repainting Non Lagging Harmonic Pattern Indicator”: https://youtu.be/uMlmMquefGQ
Young Ho Seo
Young Ho Seo
Japanese CandleStick Pattern Control in Price Breakout Pattern Scanner

Japanese candle stick patterns are built in feature inside Price Breakout Pattern Scanner. This is kind of bonus feature for customers who are buying our Price Breakout Pattern Scanner.

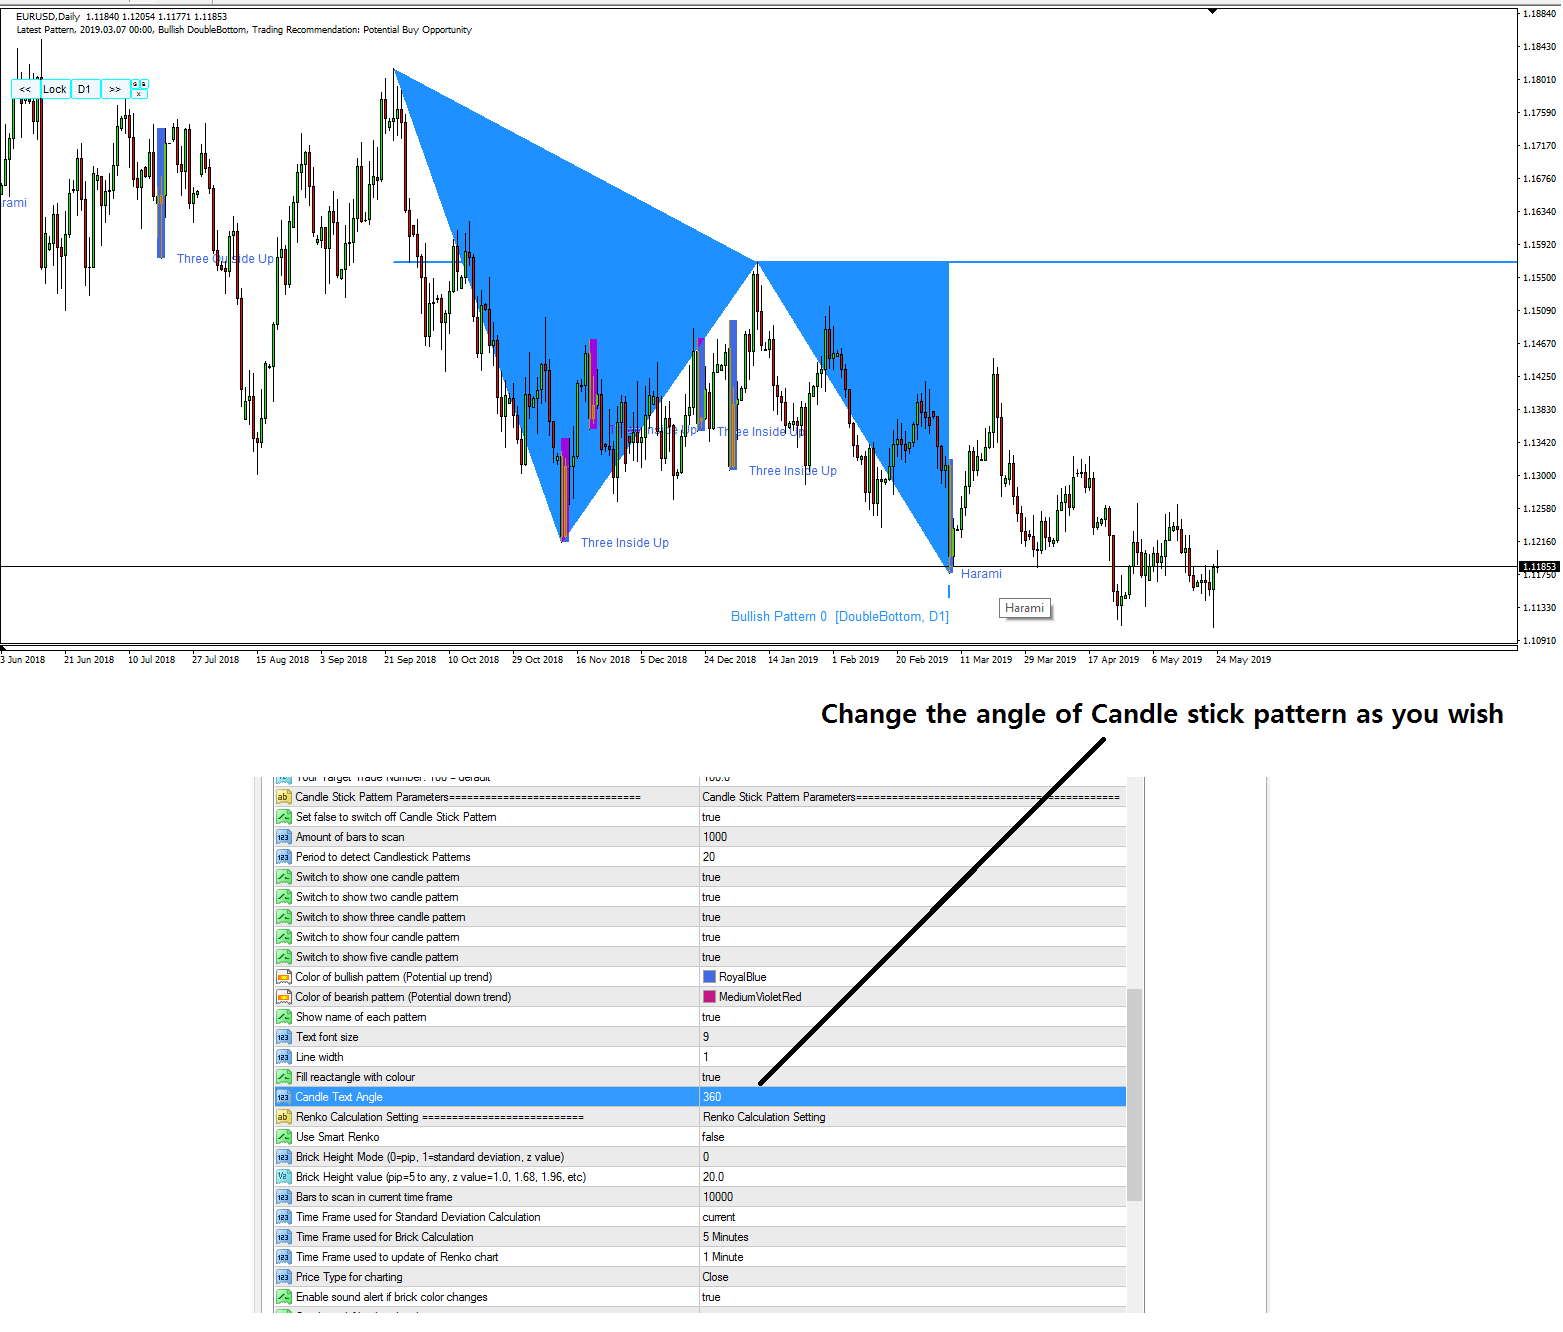
In Japanese candlestick inputs, you can switch on and off Candlestick pattern according to their type. For example, there are Japanese candlestick pattern made up from one candle bar, two candle bar, three candle bar, etc. You can switch on and off each according to your preference.

As a default setting, Pattern Name will be printed in chart. At the same time, you can bring your mouse over to each Japanese candlestick pattern to float pattern name in tool tip box (MT5 is more responsive than MT4 for this tool tip box) Alternatively, you can also change the angle of pattern name from horizontal to vertical or vice versa depending on your readability. In addition, we provide the YouTube Video for Price Breakout Pattern Scanner. With the video, you can see some basic operation of the price breakout pattern scanner. This video is applicable to both MetaTrader 4 and MetaTrader 5 platforms.

YouTube Video “How To Use Price Breakout Pattern Scanner”: https://www.youtube.com/watch?v=aKeSmi_Di2s

Download the latest version for the maximum performance and more profits.

https://www.mql5.com/en/market/product/4859

https://www.mql5.com/en/market/product/4858

https://algotrading-investment.com/portfolio-item/price-breakout-pattern-scanner/
Young Ho Seo
Young Ho Seo
New Article Released -Turning Point, Peak, Trough, Swing High, Swing Low, and ZigZag

We have released an important article for your practical financial trading. Please make sure to read this article to enhance your trading performance. This article explains the important terminology for your trading like Turning point, peak, trough, swing high, swing low and zigzag.

More articles will be followed shortly. Then enjoy this free articles for your trading education.

https://algotrading-investment.com/2020/04/06/turning-point-peak-trough-swing-high-swing-low-and-zigzag/

https://algotrading-investment.com/2019/07/23/trading-education/

The turning point probability is a powerful tool that you can use it as both reversal trading or breakout trading within your technical analysis. You can watch this YouTube video titled as “Breakout Trading vs Reversal Trading (Turn Support & Resistance to Killer Strategy)” in this link below to get some hands on practice with breakout and reversal trading opportunity with Support and Resistance Technical Analysis.

YouTube Video Link: https://youtu.be/UbORmOacKIQ

Below is the landing page for Fractal Pattern Scanner.

https://www.mql5.com/en/market/product/49170

https://www.mql5.com/en/market/product/49169

https://algotrading-investment.com/portfolio-item/fractal-pattern-scanner/

Below is the landing page for Optimum Chart

https://algotrading-investment.com/2019/07/23/optimum-chart/
Young Ho Seo
Young Ho Seo
Scan Supply Demand Zone Across All Timeframe

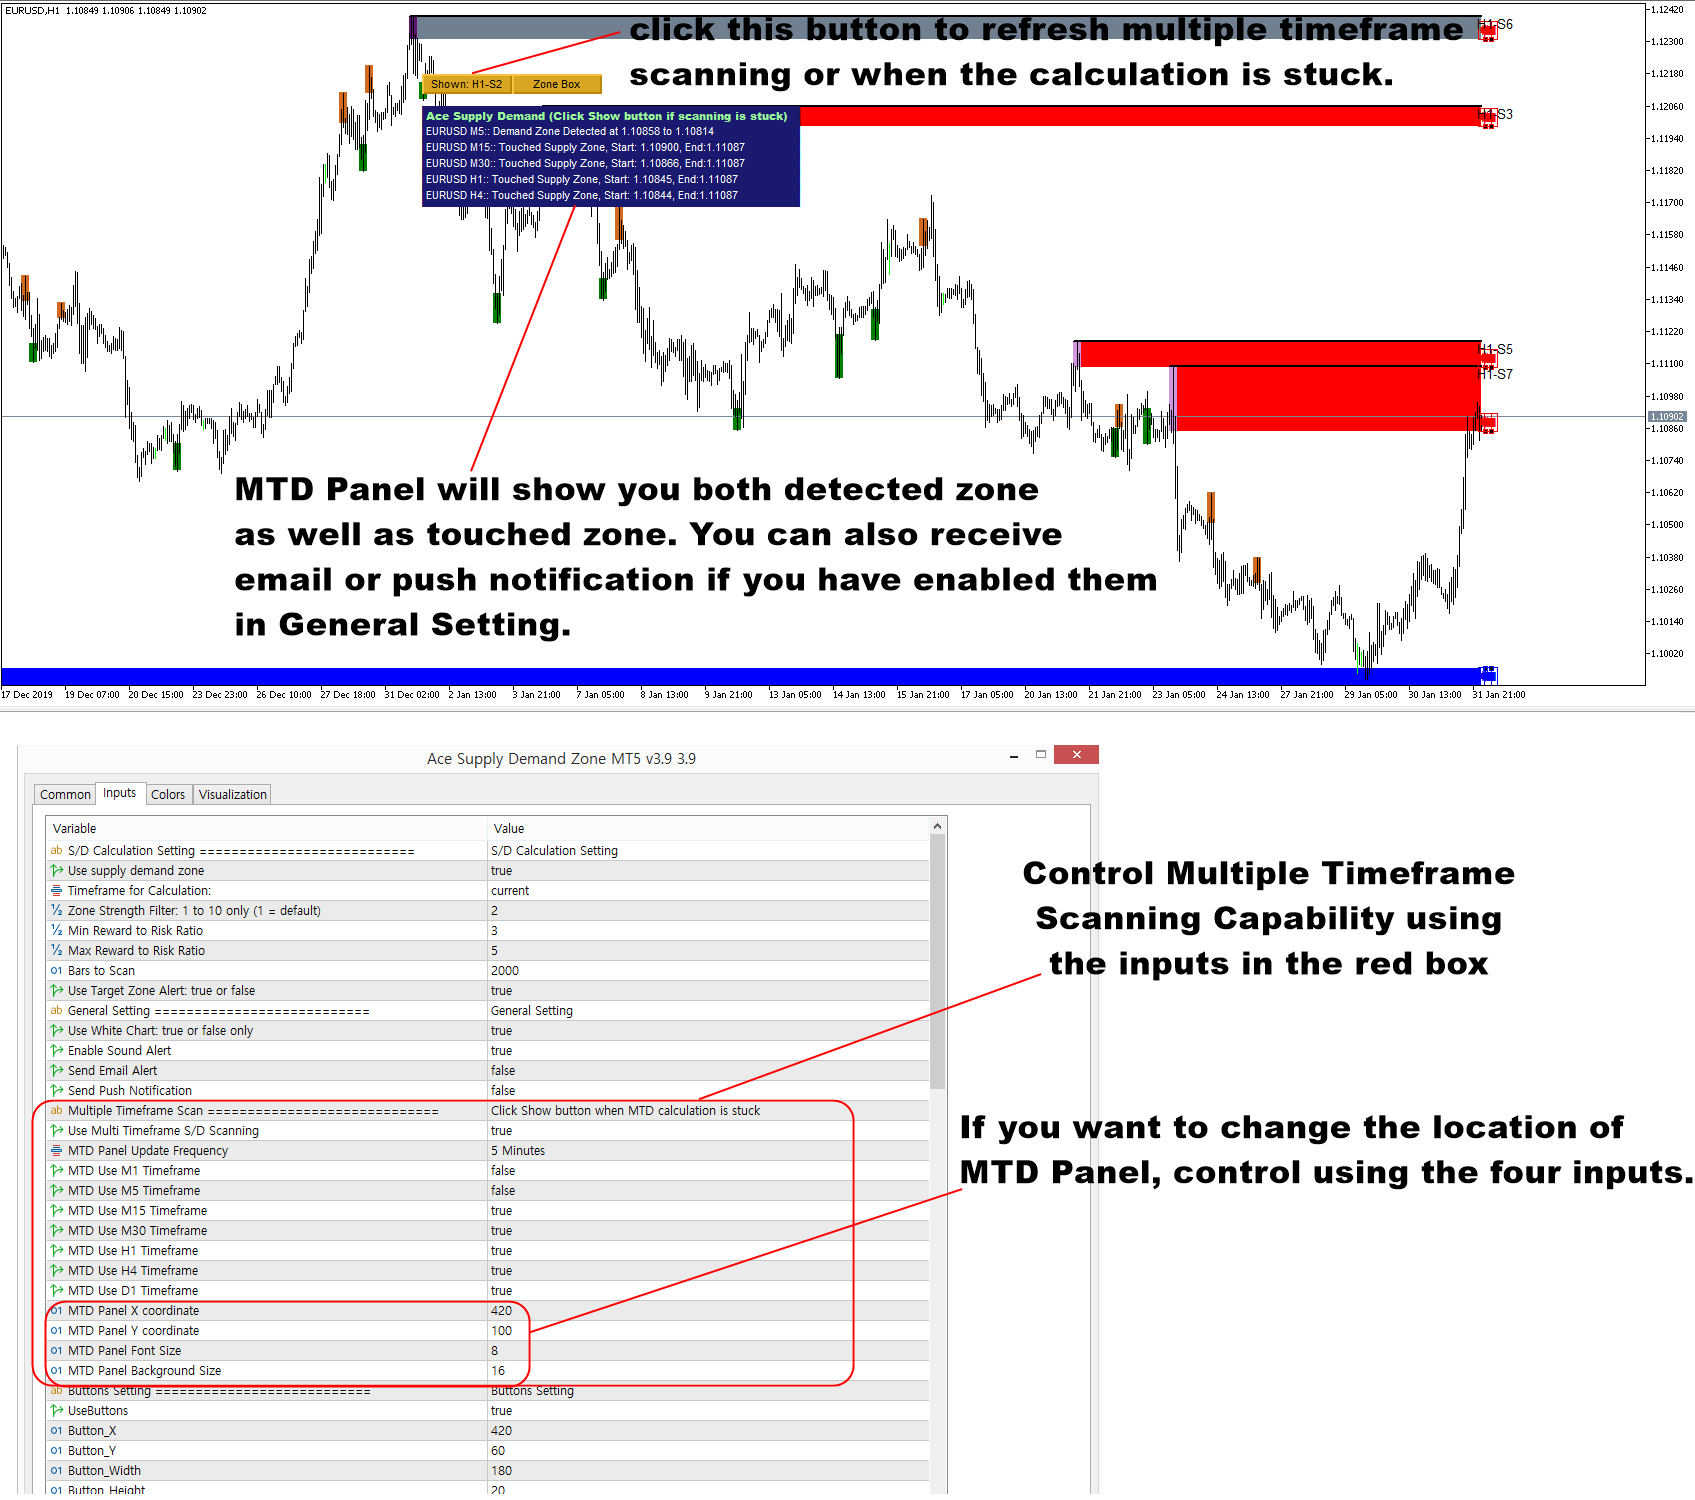
In Ace Supply Demand Zone indicator, you can scan the supply and demand zone across all timeframe for your Forex trading. This is a powerful feature included in Ace Supply Demand Zone indicator. Controlling the Multiple Timeframe scanning is similar to our other MetaTrader products like Harmonic Pattern Plus or X3 Chart Pattern Scanner. You can control them from the inputs under the Multiple Timeframe Scanning. With the inputs, you can enable or disable multiple timeframe scanning. You can also choose to switch on or off specific timeframe from your dashboard. In addition, you can also control how frequently the indicator should scan. The default value for update frequency is M5 timeframe. However, you can use M1 for update frequency if you need to scan them more frequently.

If you enabled email or push notification in the inputs under General Setting, then you can also receive the alert for the detected supply and demand zone as well as the touched supply and demand zone. The thing you need to understand about multiple timeframe scanning is that it requires multiple computation too per each timeframe. The computation can be heavier up to 7 times or more when you enabled M1 to D1 timeframes. Hence, due to data loading issues, the calculation might be stuck sometimes. In that case, just click Show button to refresh all the calculation. Of course, it is possible to switch off the multiple timeframe scanning if you only want to trade one timeframe.

Ace Supply Demand Zone in MetaTrader 4 and MetaTrader 5

In addition, we provide the YouTube video for Ace Supply Demand Zone Indicator. Hence, you can watch this YouTube Video to learn the basic operation with the supply demand zone indicator.

YouTube “Supply Demand Zone Indicator”: https://youtu.be/lr0dthrU9jo

Landing page for Ace Supply Demand Zone.

https://www.mql5.com/en/market/product/40076

https://www.mql5.com/en/market/product/40075

https://algotrading-investment.com/portfolio-item/ace-supply-demand-zone/