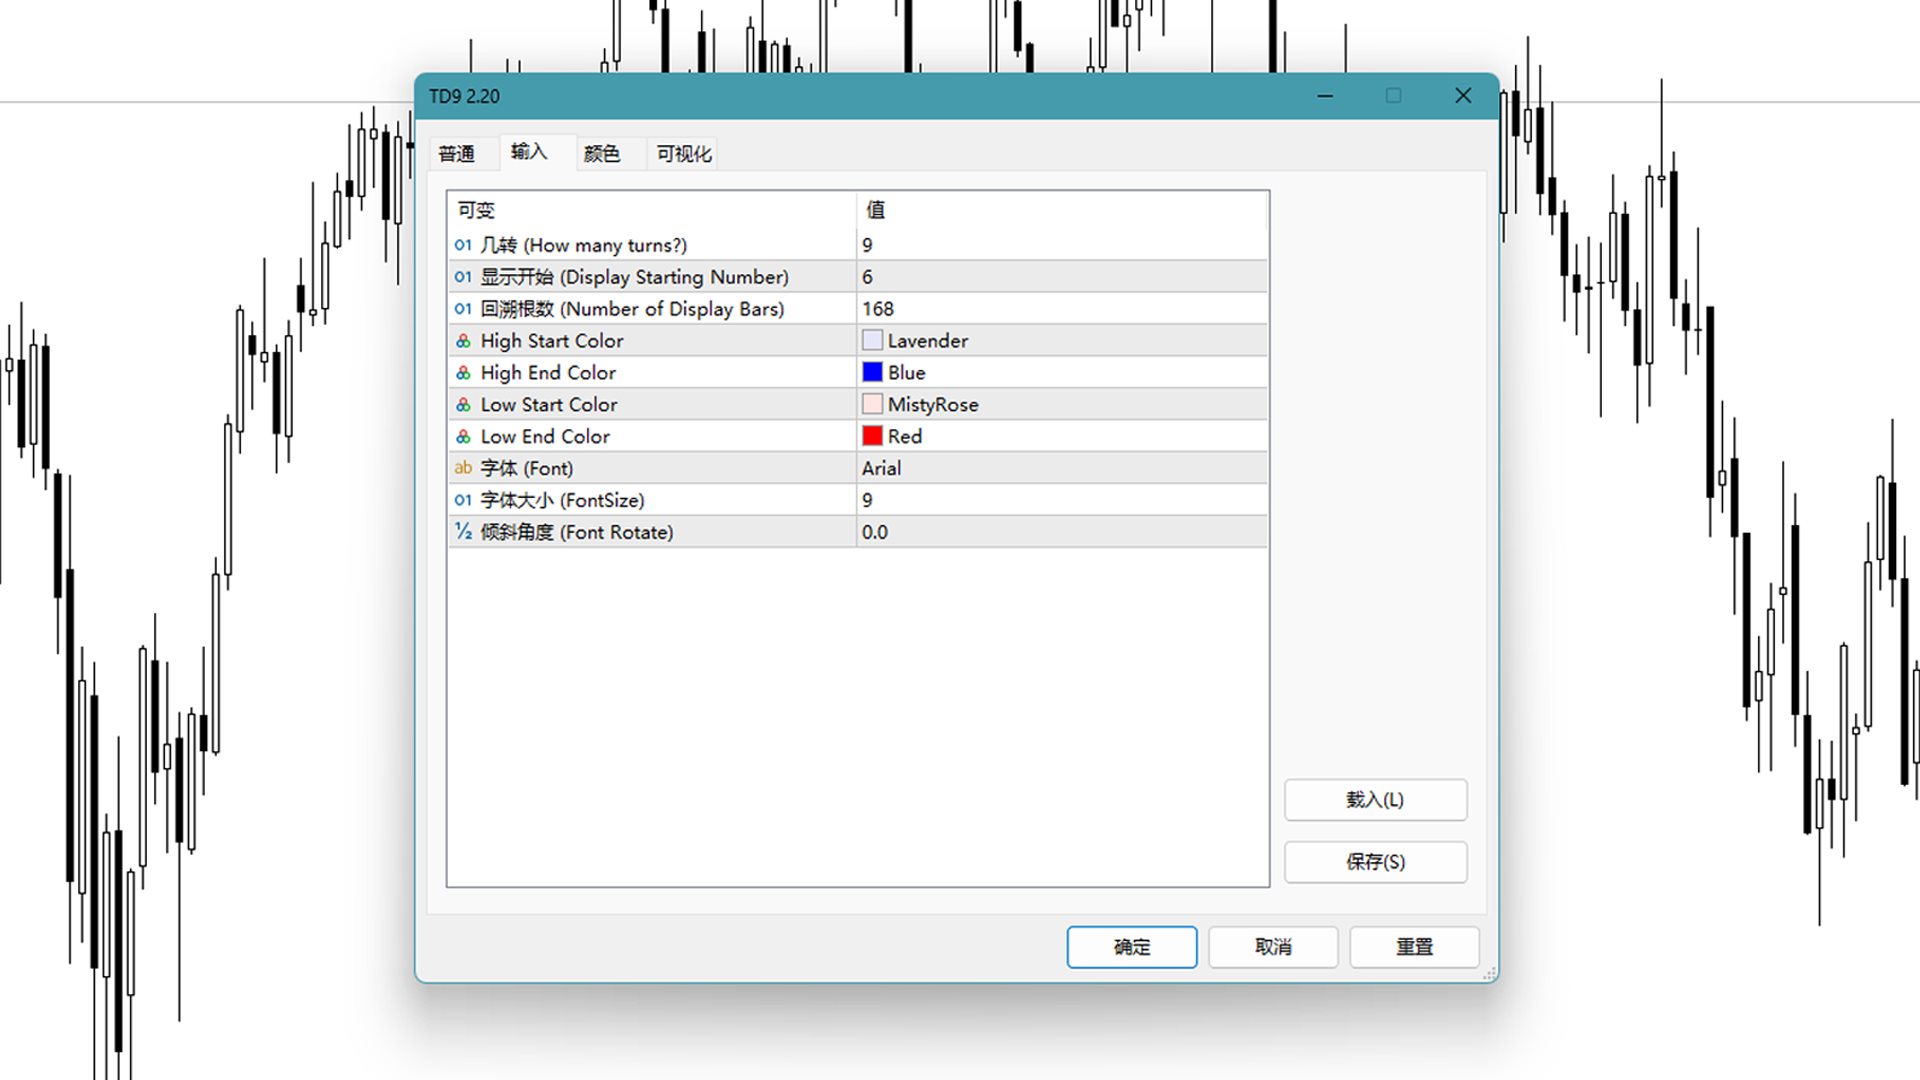
Magic TD Sequential 9
- Indicatori
- Versione: 3.1
- Aggiornato: 6 febbraio 2026
- Attivazioni: 10

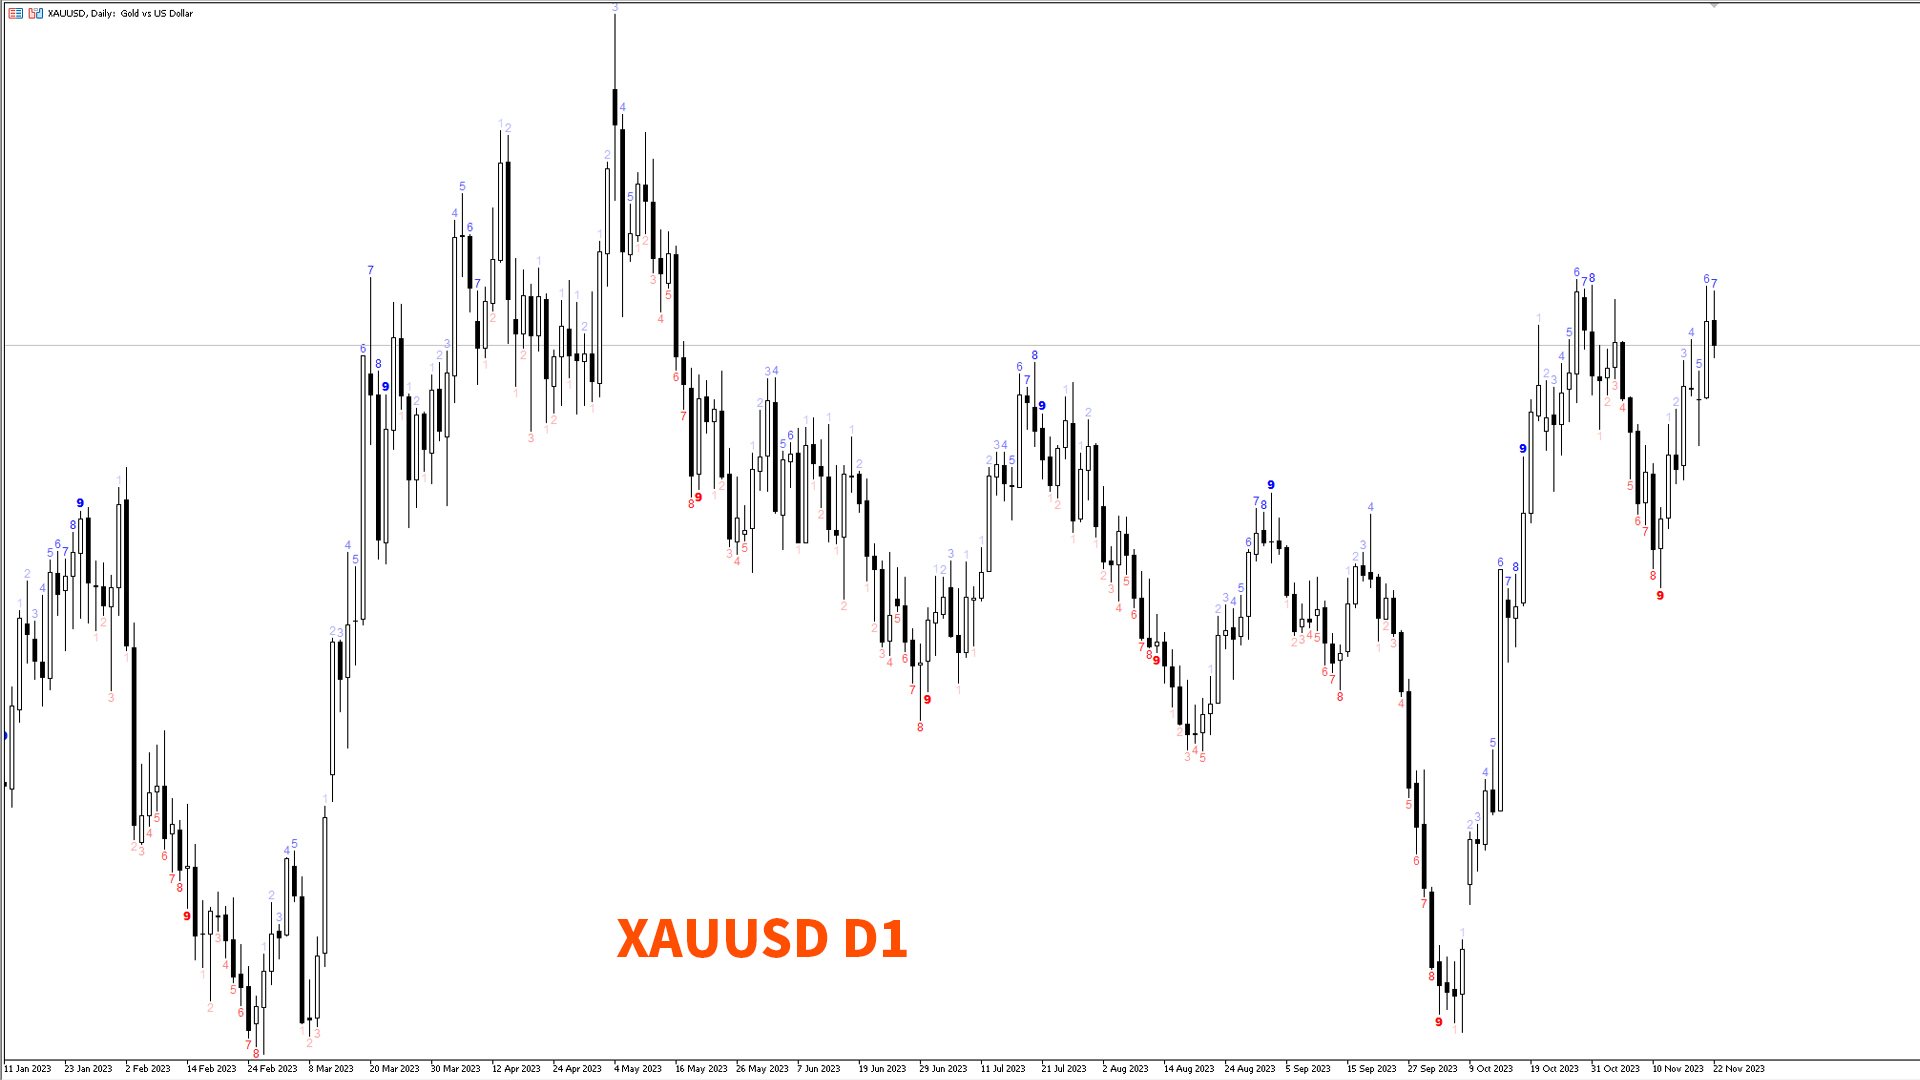
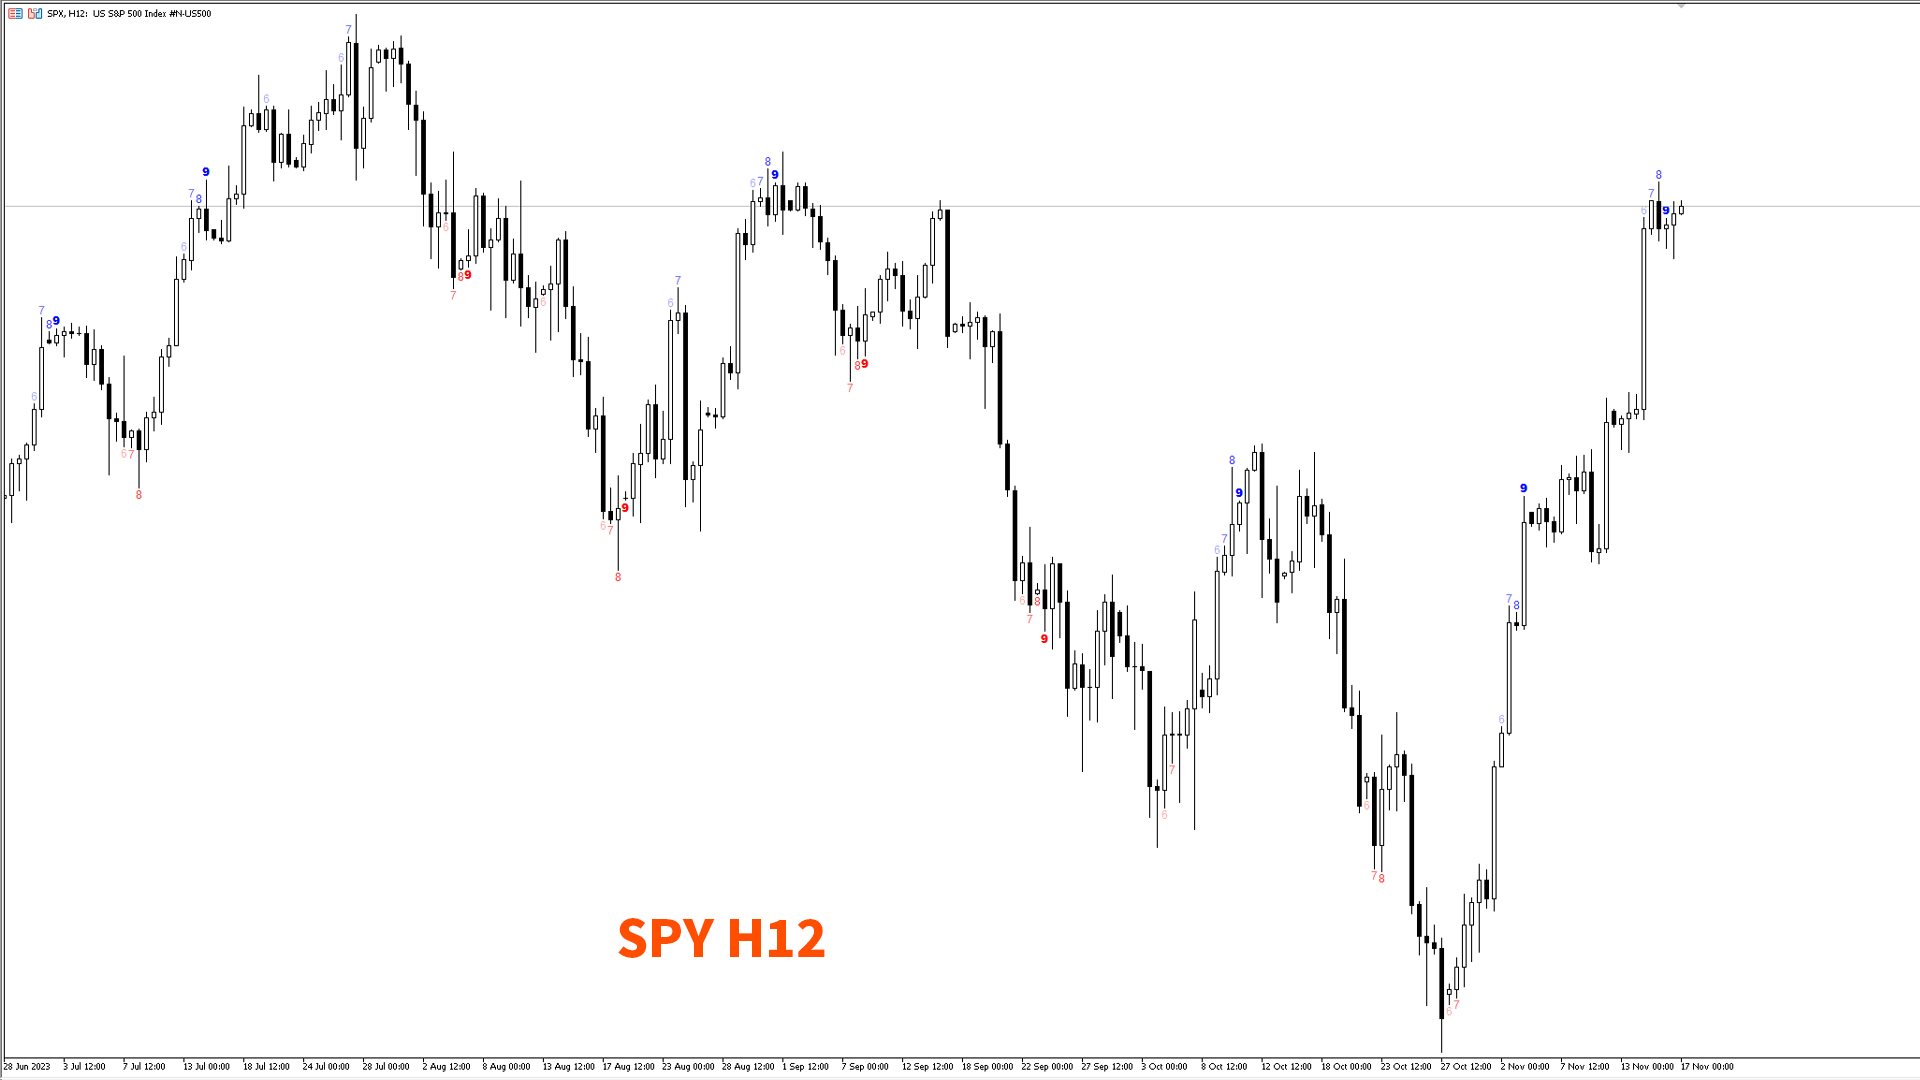
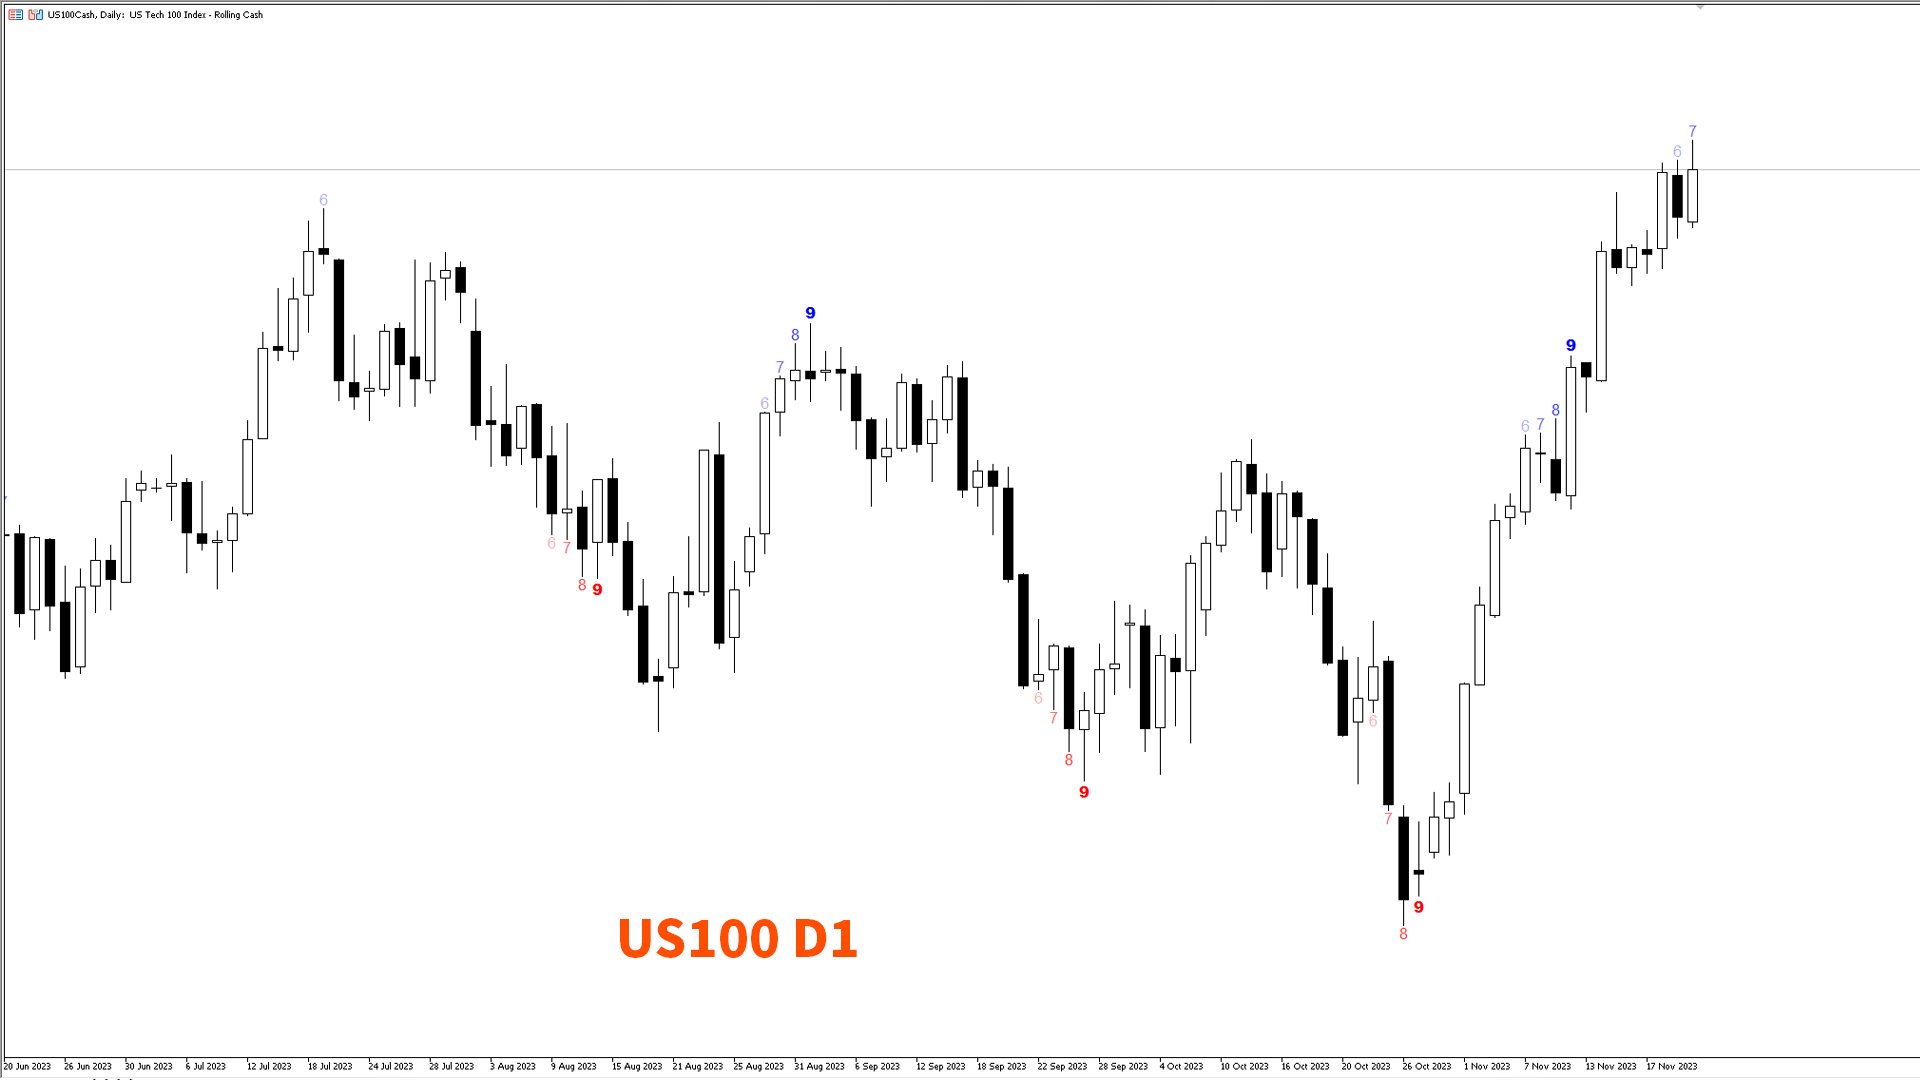
The "Magic TD 9" is a technical analysis tool for stocks. It is based on historical price data and divides prices into nine levels based on a certain magnitude. It then calculates the average price of each level and constructs a sequence of nine data points. This sequence is called the "Magic TD 9," with the first data point representing the stock's lowest price and the ninth data point representing the highest price.
10 Angle of rotation of the text
Method of Use
When using the Magic Nine Index for stock analysis, investors generally compare the current stock price to the Magic Nine sequence to determine if the price is at a significant high or low. If the current price is significantly lower than the first or second data point in the Magic Nine Index, it may be a buying opportunity. Conversely, if the price is significantly higher than the eighth or ninth data point, it may be a selling opportunity. The Magic Nine Index is a useful tool for investors but should be used as a supplemental method. It should not be relied upon as the sole method for making investment decisions.