Volatility Locator MT5
- Indicatori
-
Pavel Verveyko
 Writing scripts, indicators, EAs on MQL5 and MQL4.
Fast, Reliable, And High-Quality.
For all questions, please contact personal messages. - Versione: 1.7
- Aggiornato: 23 gennaio 2023
- Attivazioni: 5
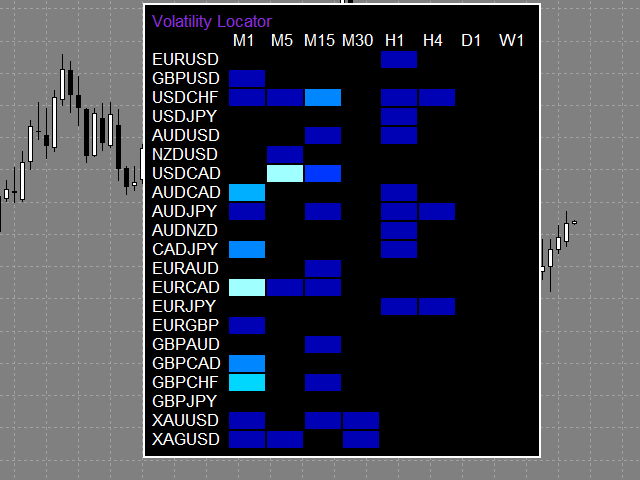
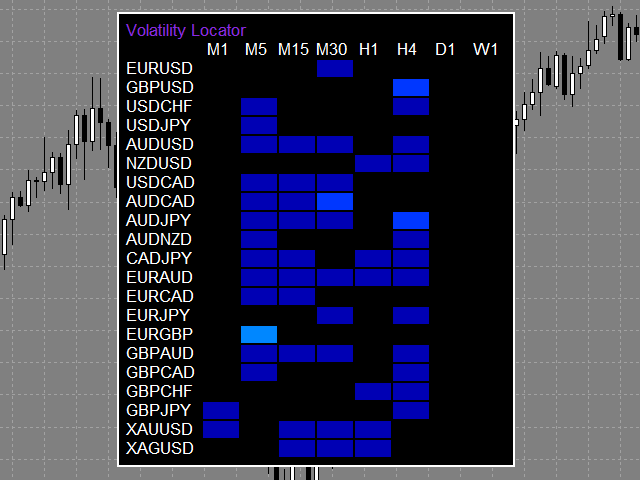
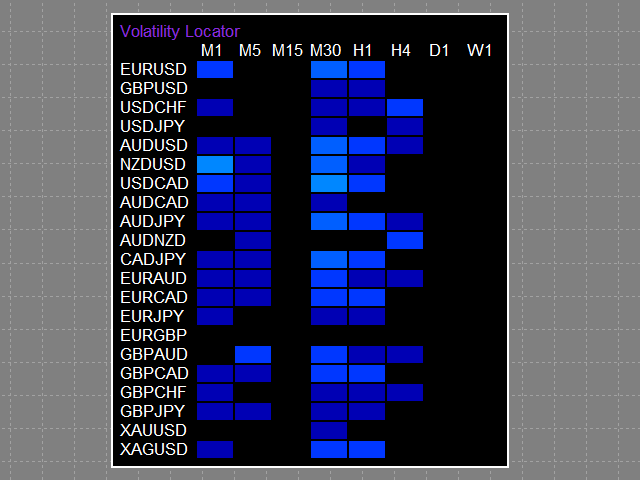
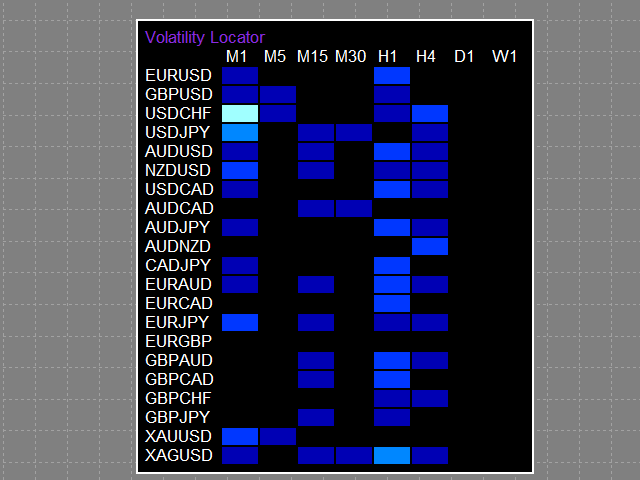
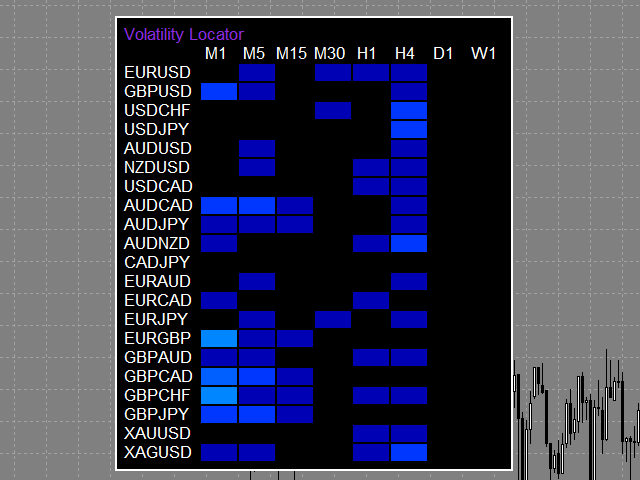
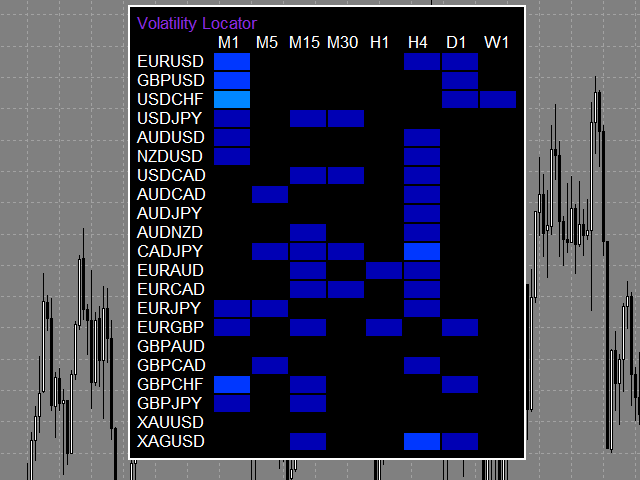
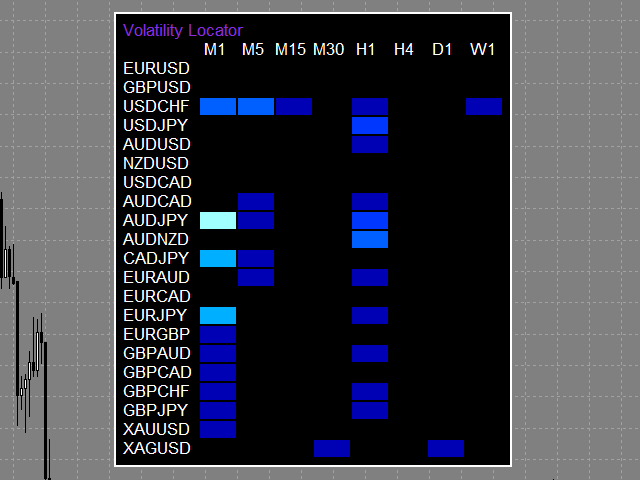
The indicator tracks sharp volatility (moments when the market has shown increased activity and movement may occur), on the selected instruments and time periods.
The information is displayed as colored rectangles. Thus, it is possible to assess at a glance which tool should be given priority attention.
The indicator will be useful for scalpers when they need a quick reaction or for traders working with a large number of instruments.
The indicator does not redraw.
The indicator displays 8 degrees of volatility.
The stronger the volatility, the brighter the signal rectangle in the table.
The table can be dragged with the mouse.
The size of the table depends on the font size selected in the settings.
When you hover the mouse cursor over a rectangle, the tooltip displays the degree of volatility, as well as the tool and the time period that this rectangle corresponds to.
When you click on the selected rectangle of the table, the tool and/or time period changes or a new chart window opens.
If Current_Chart is selected in the New_Chart_or_Current_Chart setting, then the time period and the tool will be changed to those that correspond to the selected rectangle.
If New_Chart is selected in the New_Chart_or_Current_Chart setting, a new window with a graph will be opened, the time period and tool of which correspond to the selected rectangle.
In the Template_name_for_New_Chart setting, you can specify a chart template with which a new window will be opened.
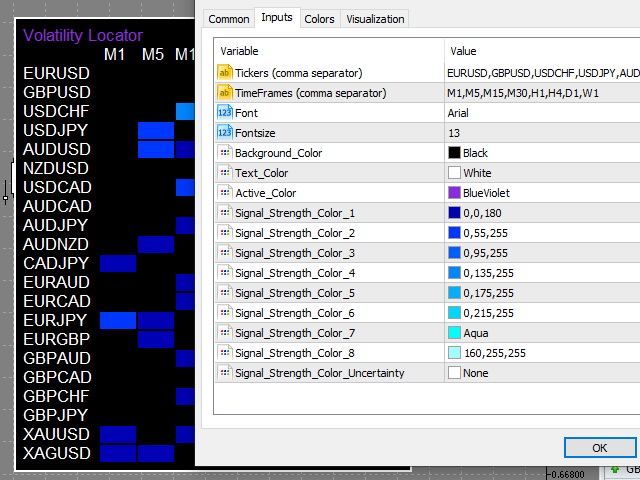
Settings
- Tickers - Tools to be displayed in the table (separated by commas).
- TimeFrames - Time periods to be displayed in the table (separated by commas).
- Table_Refresh_Rate (in seconds) - the refresh rate of the table is measured in seconds.
- In other indicator settings, you can change the color of the signal rectangles, font, font size, table background color, table font color.
- New_Chart_or_Current_Chart - the mode of opening a new chart: in a new window or changing the instrument and time period in the window in which the indicator is running.
- Template_name_for_New_Chart - the name of the template with which the new chart will be opened.