Resistances and Support
- Indicatori
-
Mohamed Amr Mohamed Osama Abdelwahab
 Sviluppatore software, istruttore e team leader tecnico con oltre 22 anni di esperienza nello sviluppo di applicazioni desktop, web e software finanziario. Freelancer Top Rated su Upwork, con oltre 200 progetti completati, oltre $200K consegnati e un tasso di successo del 100%. Specializzato in
 - Versione: 2.0
- Aggiornato: 27 giugno 2026
- Attivazioni: 5
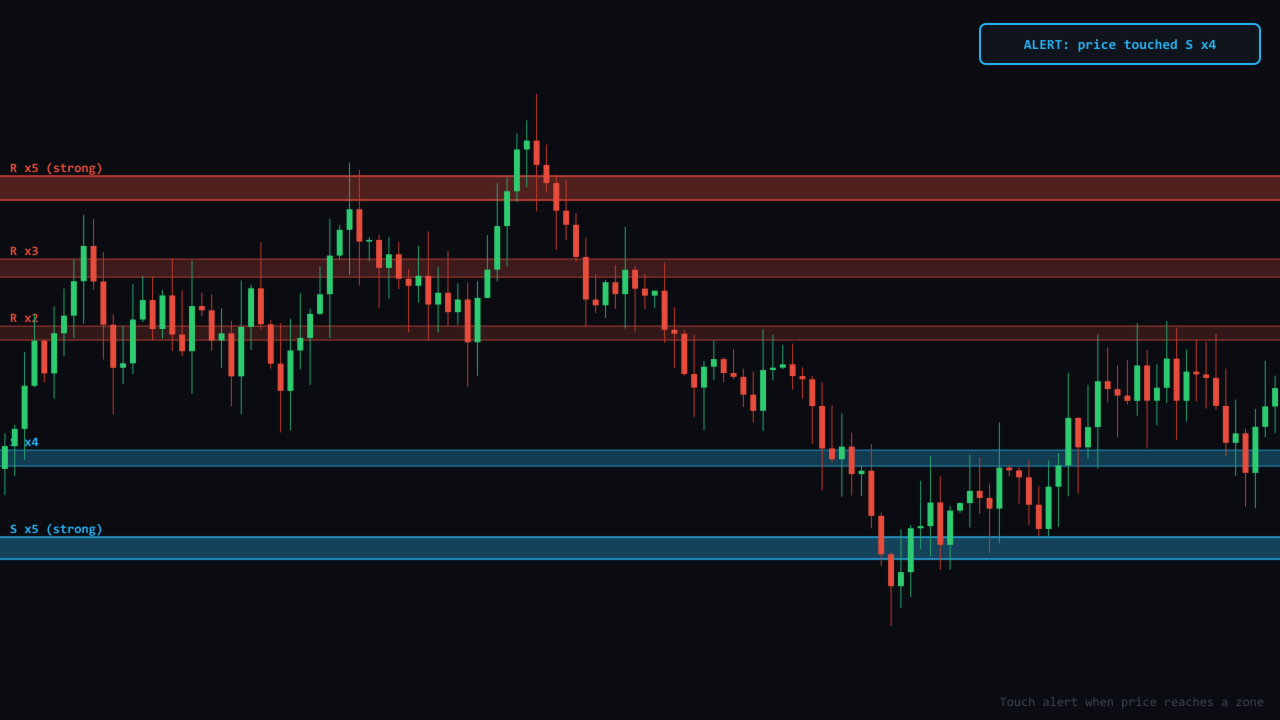
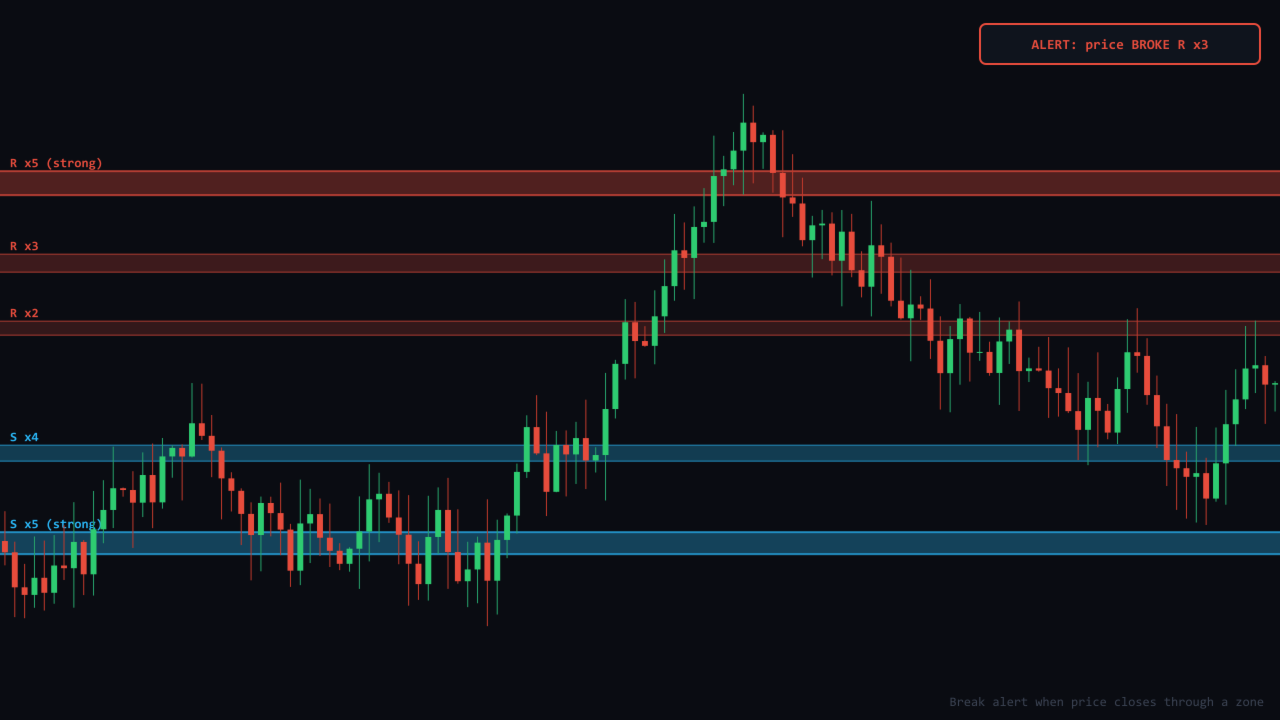
**Resistances and Support — Zone con valutazione di forza e avvisi**
Supporto e resistenza sono tra i fattori più importanti quando si entra nel mercato. Questo indicatore li trova automaticamente e mostra quanto è forte ciascuno.
Invece di semplici linee, disegna supporto e resistenza come ZONE, perché il prezzo reagisce ad aree, non a prezzi esatti. Ogni zona è valutata in base a quante volte il prezzo l'ha rispettata: più la zona è forte, più è marcata. Vedi subito quali livelli contano di più.
**Come usarlo:**
- Opera tra le zone di supporto e resistenza
- Metti lo stop loss oltre la zona (sopra per le vendite, sotto per gli acquisti)
- Imposta il take profit alla zona successiva
- Quando molte zone si raggruppano vicine senza spazio, è meglio aspettare — l'area è congestionata
**Cosa fa:**
- Rileva automaticamente più zone di supporto e resistenza dai recenti swing
- Valuta ogni zona per forza (numero di tocchi) — le più forti sono più marcate
- Disegna la resistenza sopra il prezzo e il supporto sotto, ciascuna col proprio colore
- Mostra una piccola etichetta su ogni zona con tipo e forza (ad esempio R x4, S x5)
- Ti avvisa quando il prezzo TOCCA una zona o la ROMPE (pop-up e push opzionale sul telefono)
**Parametri:**
- Barre di analisi, forza del pivot, larghezza zona (ATR), zone max, tocchi minimi
- Colori resistenza e supporto, etichette on/off, dimensione font, estendi a destra
- Avviso di tocco, avviso di rottura, pop-up, notifica push — ciascuno on/off
Funziona su qualsiasi simbolo e time frame. Niente DLL, niente internet; non apre, modifica né chiude ordini — sicuro su qualsiasi grafico.