Active Target by RichPole
- Indicatori
- Versione: 1.1

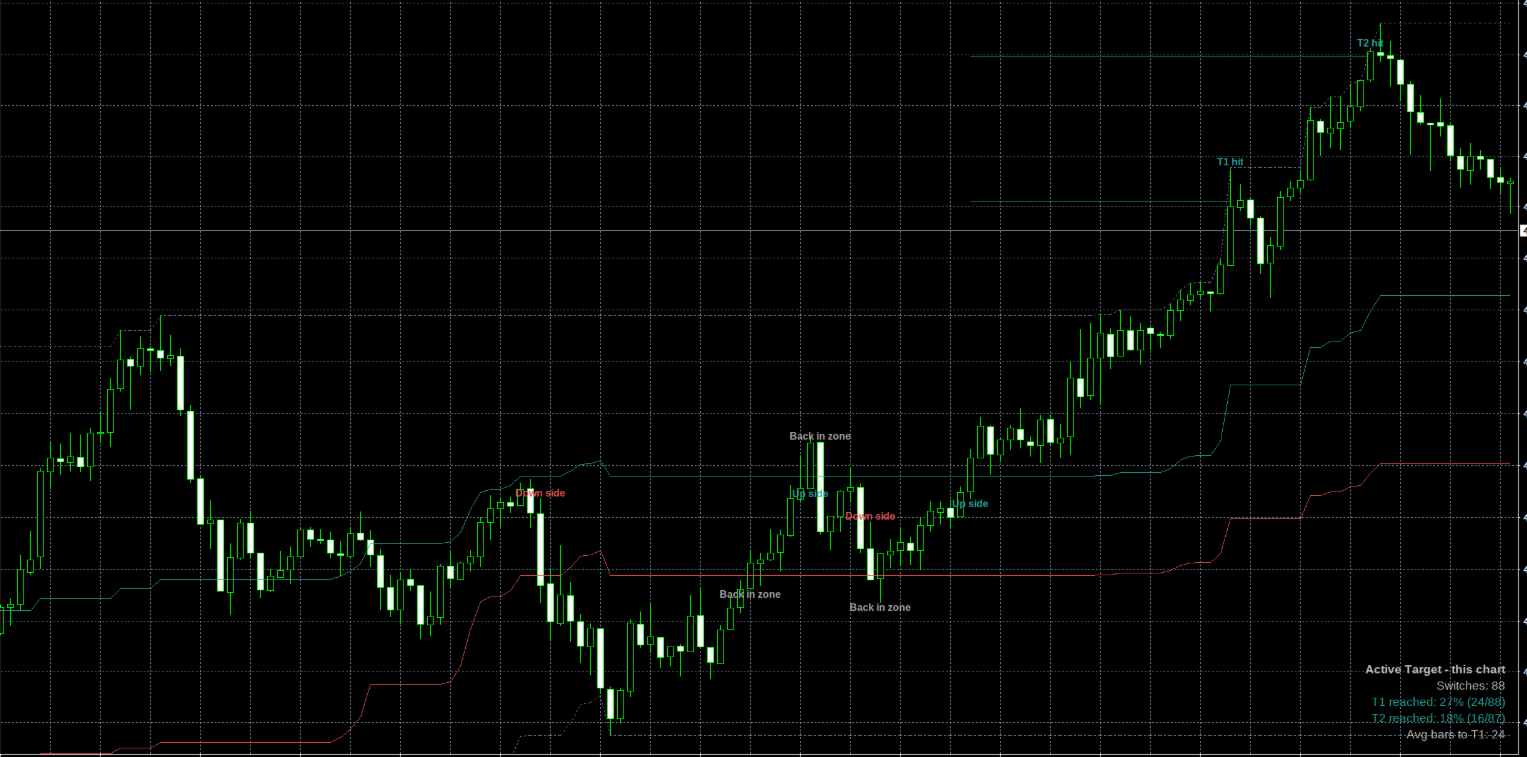
Active Target maps the recent price range, marks a switch zone in the middle of it, and draws two targets beyond the range as soon as price picks a side. A panel on the chart shows how often those targets were actually reached on your symbol and settings.
HOW IT WORKS
- Range: the highest high and lowest low of the last N candles (default 100; presets "About 1 day" and "About 1 week" use the chart timeframe).
- Switch zone: between the 38.2% and 61.8% levels of the range (adjustable).
- Up side: a candle CLOSES above the upper switch line. Down side: a candle CLOSES below the lower switch line. Inside the zone the last side stays active, so the side does not flicker.
- Targets: at the switch, Target 1 is set at the 127.2% extension of the range and Target 2 at the 161.8% extension (both adjustable). Targets are fixed at the switch and never move.
- Notes on the chart: Up side, Down side, T1 hit, T2 hit, Back in zone (price closed back inside the switch zone after a switch).
- Hit-rate panel: counts every switch on the chart and shows how often T1 and T2 were reached before the side switched again, plus the average number of candles to reach T1.
HOW TO USE IT
- Use Target 1 as a first take-profit area and Target 2 for a smaller remaining position.
- "Back in zone" means the move is stalling: protect open profit and avoid chasing.
- For a calmer entry, wait for a retest of the switch line after a switch.
- Check risk first: if Target 1 is closer than your stop, the trade does not pay for its risk.
SETTINGS
Range length (custom candles, about 1 day, about 1 week), switch line %, Target 1 and Target 2 %, past switches kept on the chart, range lines, switch lines, notes, note history, font size, hit-rate panel and its corner, bars to calculate, colours.
Alerts on closed candles (popup, sound, push): up side, down side, Target 1 hit, Target 2 hit, back in zone.
RESULTS AND LIMITATIONS
- In our own test (gold and EURUSD, 15-minute candles, range 100), Target 1 was reached on about 35-38% of switches and Target 2 on about 21-25%. That is close to what random price movement gives, so treat the targets as a map, not a prediction. The panel shows the numbers for your chart.
- Results depend on the range length, timeframe and market. Past hit rates do not guarantee future results.
- Calculations use closed candles. Educational tool. It does not place trades and is not financial advice.