Horizon Flashing
- Experts
-
Steve Zoeger
 Hello to my Fx friends. Forex is so diverse that you can't really single out any particular indicator or strategy. The ever-changing market and the ever-changing economic conditions around the world mean that there are many different ways to trade, so I have developed many different robots. These
- Versione: 1.1
- Attivazioni: 5
Horizon Flashing EA: 10-Point Description
1. Multi-timeframe signal engine
Horizon Flashing reads Stochastic, RSI, EMA (20/50) and MACD on 14 timeframes at once, from M1 to W1. It averages the Stochastic and RSI readings and takes a trend vote across all timeframes (UP, DOWN or SIDE). It looks for oversold and overbought extremes, pullback bounces in an uptrend, and fades in a downtrend.
2. Works on any symbol and any chart timeframe
Attach it to any chart: forex pairs, crypto, stocks, indices or metals. The 14 timeframes are calculated internally, so the chart timeframe only decides how often the EA checks for a new entry. You can run M5, H1 or D1 with no change to the signal logic.
3. Two trading modes
- Simple mode opens one trade at a time with a fixed Stop Loss and Take Profit (default 50 / 150 pips).
- Martingale basket mode opens an entry and adds scaled-up orders as price moves against it (default 25-pip step, lot ×1.2, max 100 trades). It closes the whole basket when the profit target is reached (default $1.00).
4. Built-in trade and risk management
- Trailing stop with breakeven.
- Maximum spread filter.
- Trading-day and trading-hour filter.
- Drawdown protection and equity floor.
- Free-margin guard that skips orders you can’t afford.
- Fixed or balance-growth lot sizing.
5. Quick start
- Drag Horizon Flashing EA onto any chart.
- Enable Algo Trading and allow automated trading in the EA properties.
- Choose your lot size and your mode.
- Test in the Strategy Tester or on a demo account first, then go live.
- Watch the on-chart badge, which shows the current multi-timeframe trend.
6. Long-term backtest, 11 years of data
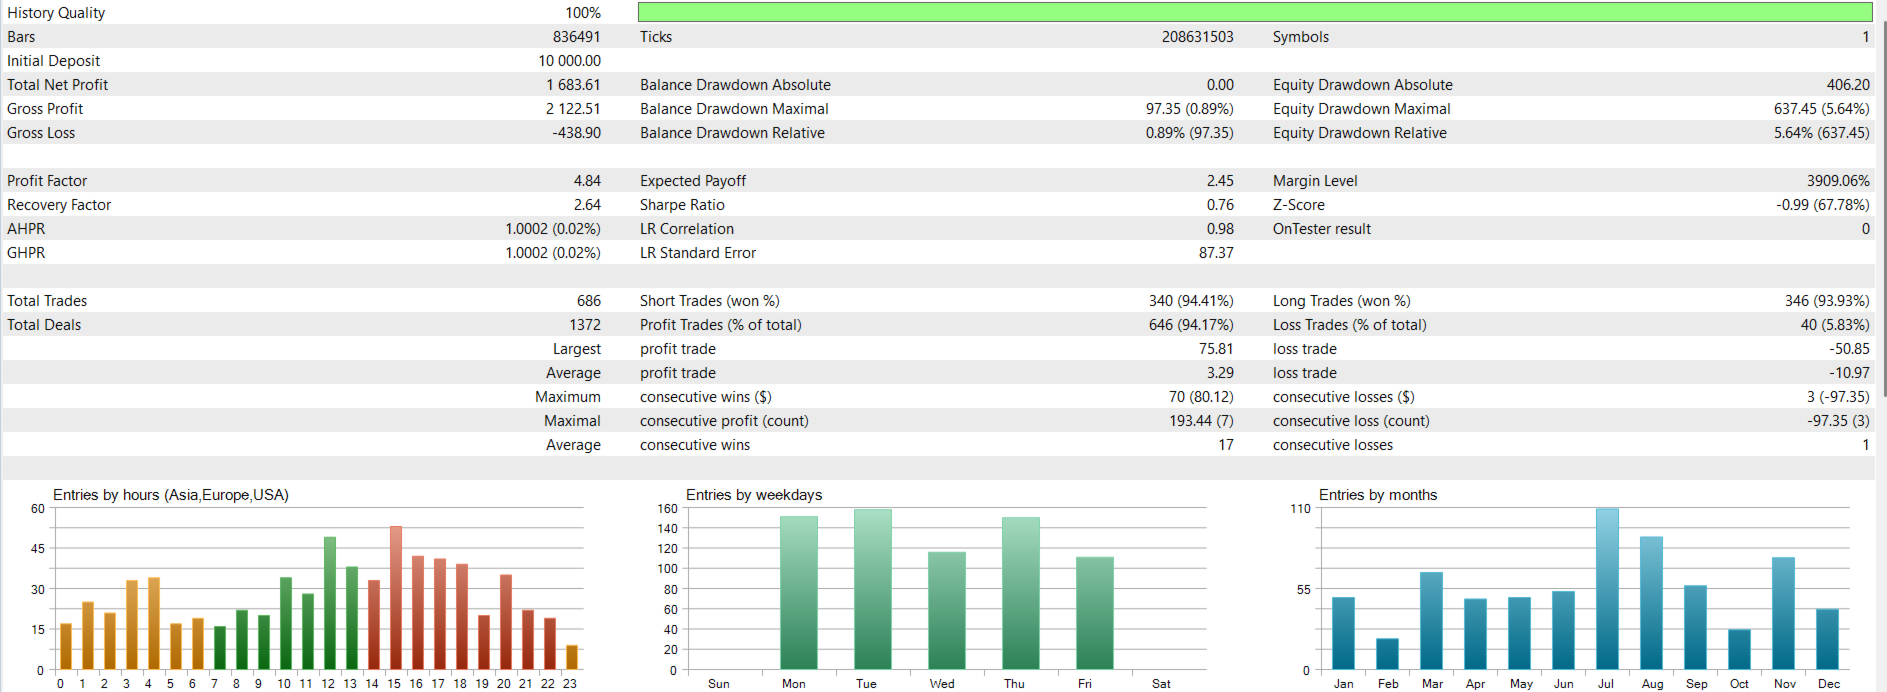
Both tests ran in the MT5 Strategy Tester from July 2015 to March 2026 with 100% history quality, about 208 million ticks and a 10,000 starting deposit. This covers many different market phases, not just one favourable period.
7. Backtest A, higher activity
- Net profit: 4,068 on 10,000.
- Trades: 1,455, of which 92.37% were profitable.
- Profit factor 2.64, recovery factor 2.11, Sharpe ratio 2.07.
- Maximal equity drawdown 19.27%.
- Average profit trade 4.88, average loss trade 22.41.
8. Backtest B, lower-risk profile
- Net profit: 1,684 on 10,000.
- Trades: 686, of which 94.17% were profitable.
- Profit factor 4.84, recovery factor 2.64, Sharpe ratio 0.76.
- Maximal equity drawdown 5.64%.
- Average profit trade 3.29, average loss trade 10.97.
9. Balanced long and short performance
In both tests long and short trades won about the same share of the time: 93.8% long and 90.7% short in Test A, 93.9% long and 94.4% short in Test B. Trades are spread across Monday to Friday and across all twelve months, so results don’t depend on one weekday or season.
10. Read the risk before you trade
The high win rate comes with a trade-off. The average loss is larger than the average win, and martingale baskets can hold large floating drawdowns. Test A’s equity drawdown reached 19.27% even though the balance drawdown was only 2.04%. Backtests use historical data and don’t guarantee future results. Start on a demo account, use a lot size that suits your balance, and size the risk settings to your account.