Nummereins Pivot Points
- Indicatori
- Versione: 1.0
- Attivazioni: 5

NummEinz — Pivot Lines for MetaTrader 5
NummEinz automatically draws classic pivot levels on your trading chart. It gives you clear price reference points to support your chart analysis and trade planning.
The indicator calculates its levels from the previous completed day, week, or month, using that period’s high, low, and closing prices.
Main Features
-
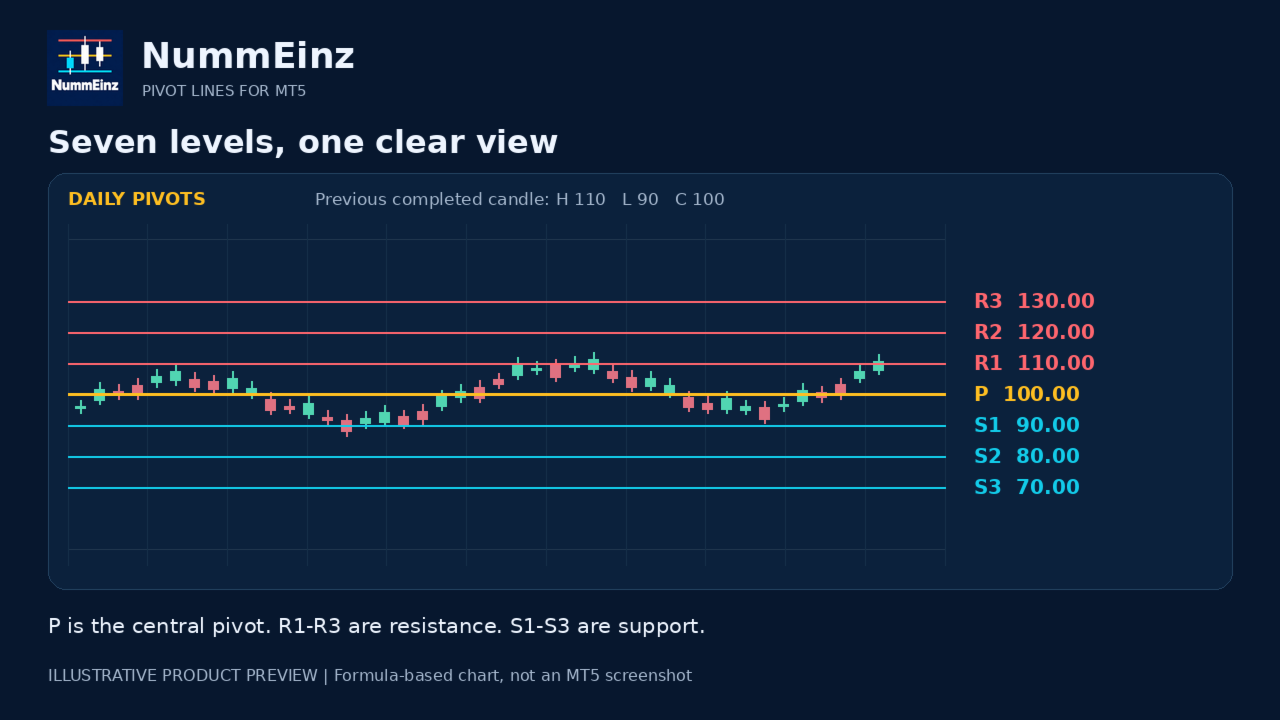
Seven pivot levels: Displays the central pivot point (P), three resistance levels (R1, R2, R3), and three support levels (S1, S2, S3).
-
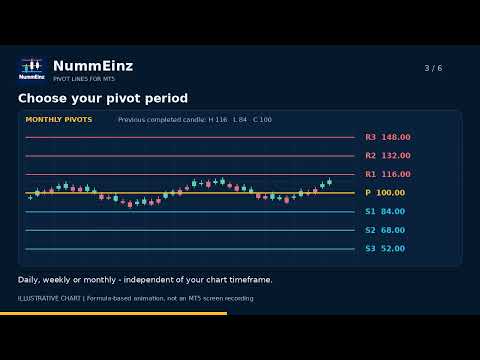
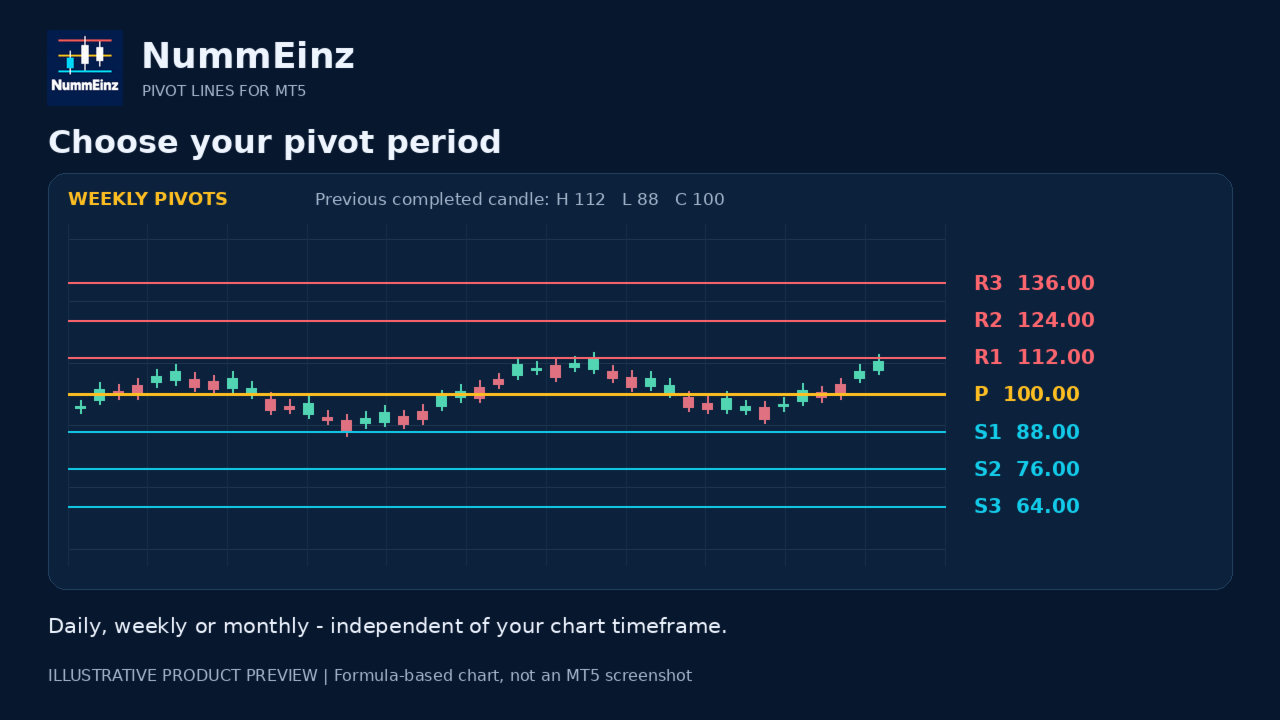
Daily, weekly, or monthly pivots: Choose the calculation period independently of your chart timeframe.
-
Automatic updates: Recalculates the levels when a new selected period begins.
-
Clear price labels: Shows each level’s name and price directly on the chart.
-
Custom appearance: Adjust line colors, style, thickness, and label size.
-
Optional outer levels: Show or hide R3 and S3 for a simpler chart.
-
Multiple instances: Display different pivot periods on the same chart.
-
Works alongside an EA: Use the indicator while your Expert Advisor manages trading.
Advantages
-
Saves time by calculating and drawing pivot levels automatically.
-
Makes support, resistance, and the central pivot easier to identify.
-
Provides consistent reference levels for reviewing possible entries, exits, and price reactions.
-
Keeps the display flexible so it can match your chart layout.
Input Parameters
-
InpPivotPeriod: Select daily, weekly, or monthly pivot calculations. Default: Daily.
-
InpShowR3S3: Show or hide the third resistance and support levels. Default: True.
-
InpShowLabels: Show or hide level names and price labels. Default: True.
-
InpPivotColor: Color of the central pivot line. Default: Gold.
-
InpResistanceColor: Color of the resistance lines. Default: Tomato.
-
InpSupportColor: Color of the support lines. Default: Deep Sky Blue.
-
InpLineStyle: Choose solid, dashed, dotted, or other available line styles. Default: Solid.
-
InpLineWidth: Set line thickness from 1 to 5. Dashed and dotted styles require a width of 1. Default: 1.
-
InpFontSize: Set the label font size from 6 to 36. Default: 10.
How to Use
Attach NummEinz to your chart, select the pivot period, and adjust the display settings as needed. Use the levels together with your trading strategy to assess price behavior.
Calculation and Display
The indicator uses your broker’s candle boundaries. Daily pivots use the previous completed daily candle; weekly and monthly pivots follow the same approach.
Only the current period’s levels are displayed. The horizontal lines extend across the chart; they do not show historical pivot levels for earlier periods.
NummEinz is a chart-analysis indicator. It does not open or close trades or generate trade alerts.