Market Maker Cycle Matrix
- Indicatori
-
Kay Zaremba
 Trader and MQL4 / MQL5 / Pine Script developer behind trader.lifestyle.
YouTube: youtube.com/@traderlifestyle
What I do:
• Build free indicators and Expert Advisors for MT4, MT5
• Turn strategies from YouTube videos, TradingView scripts and forum posts into working code - Versione: 1.0
- Attivazioni: 5
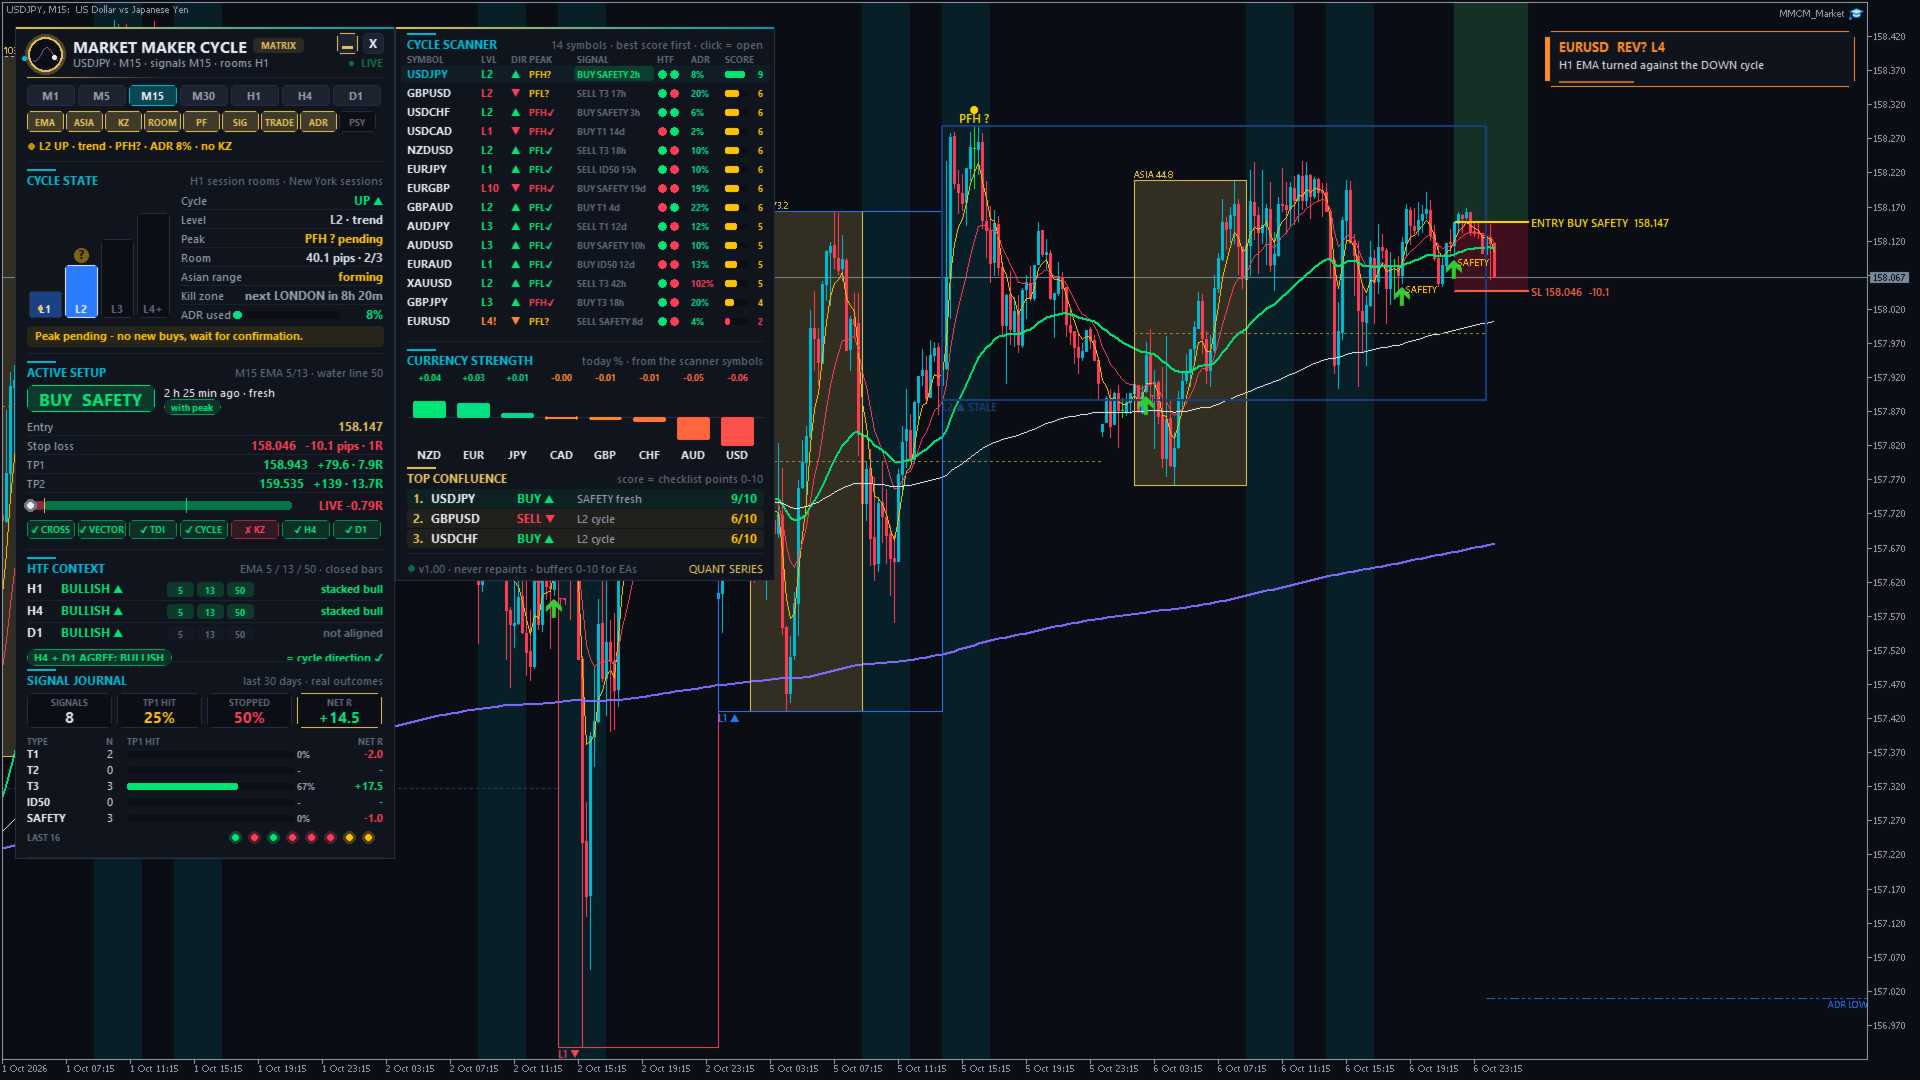
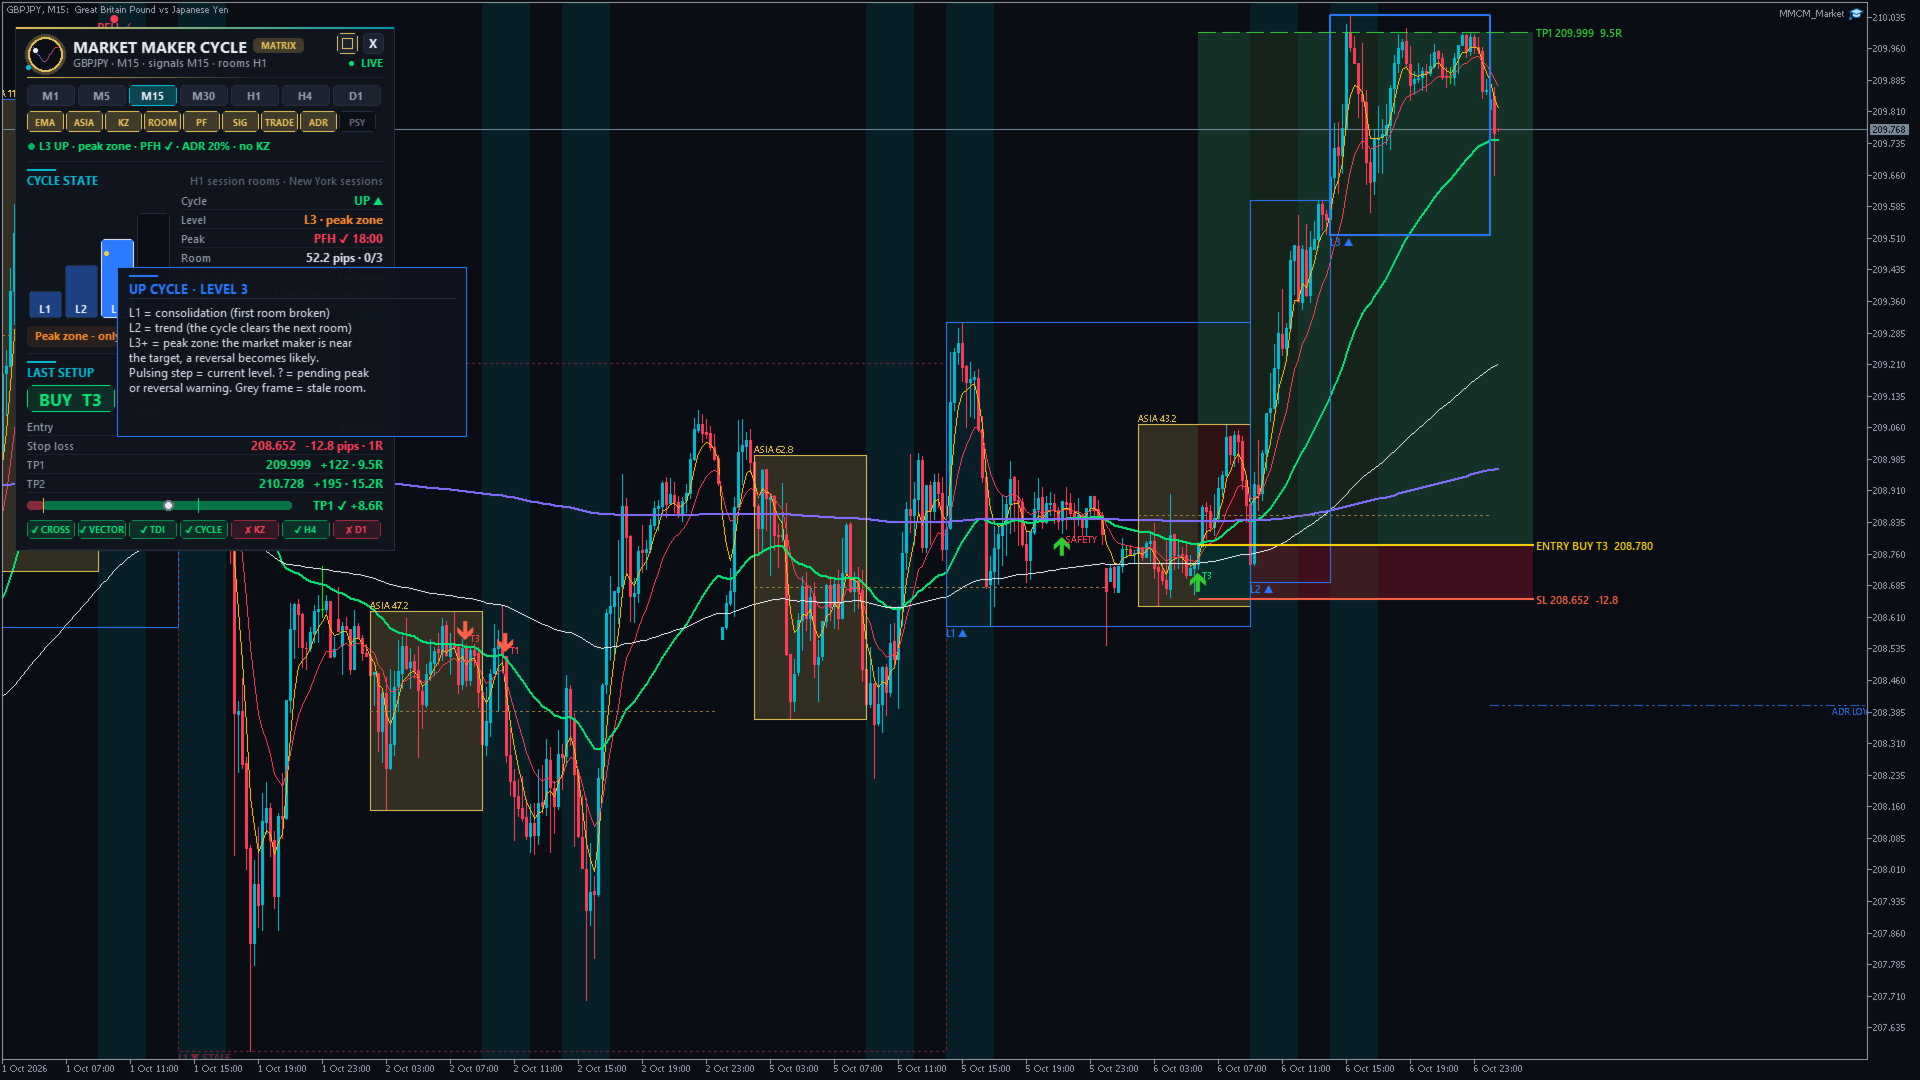
Market Maker Cycle Matrix shows the daily market maker cycle on your MetaTrader 5 chart. The Asian session builds a range. The London open often runs the stops on one side of it. Then the real move starts, room after room, until the market maker reaches the target and the cycle turns.
The indicator tracks this cycle for you: the Asian range, the kill zones, the level count L1 / L2 / L3+, the peak formation that turns the cycle, and five M15 entry types with entry, stop loss and two targets. A signal journal shows how every past signal ended. A scanner watches up to 24 symbols from one chart.
It never repaints. Levels, peaks and signals come only from closed H1 and M15 bars. A signal on the chart stays where it was printed. The indicator does not open trades.
■ How the cycle works
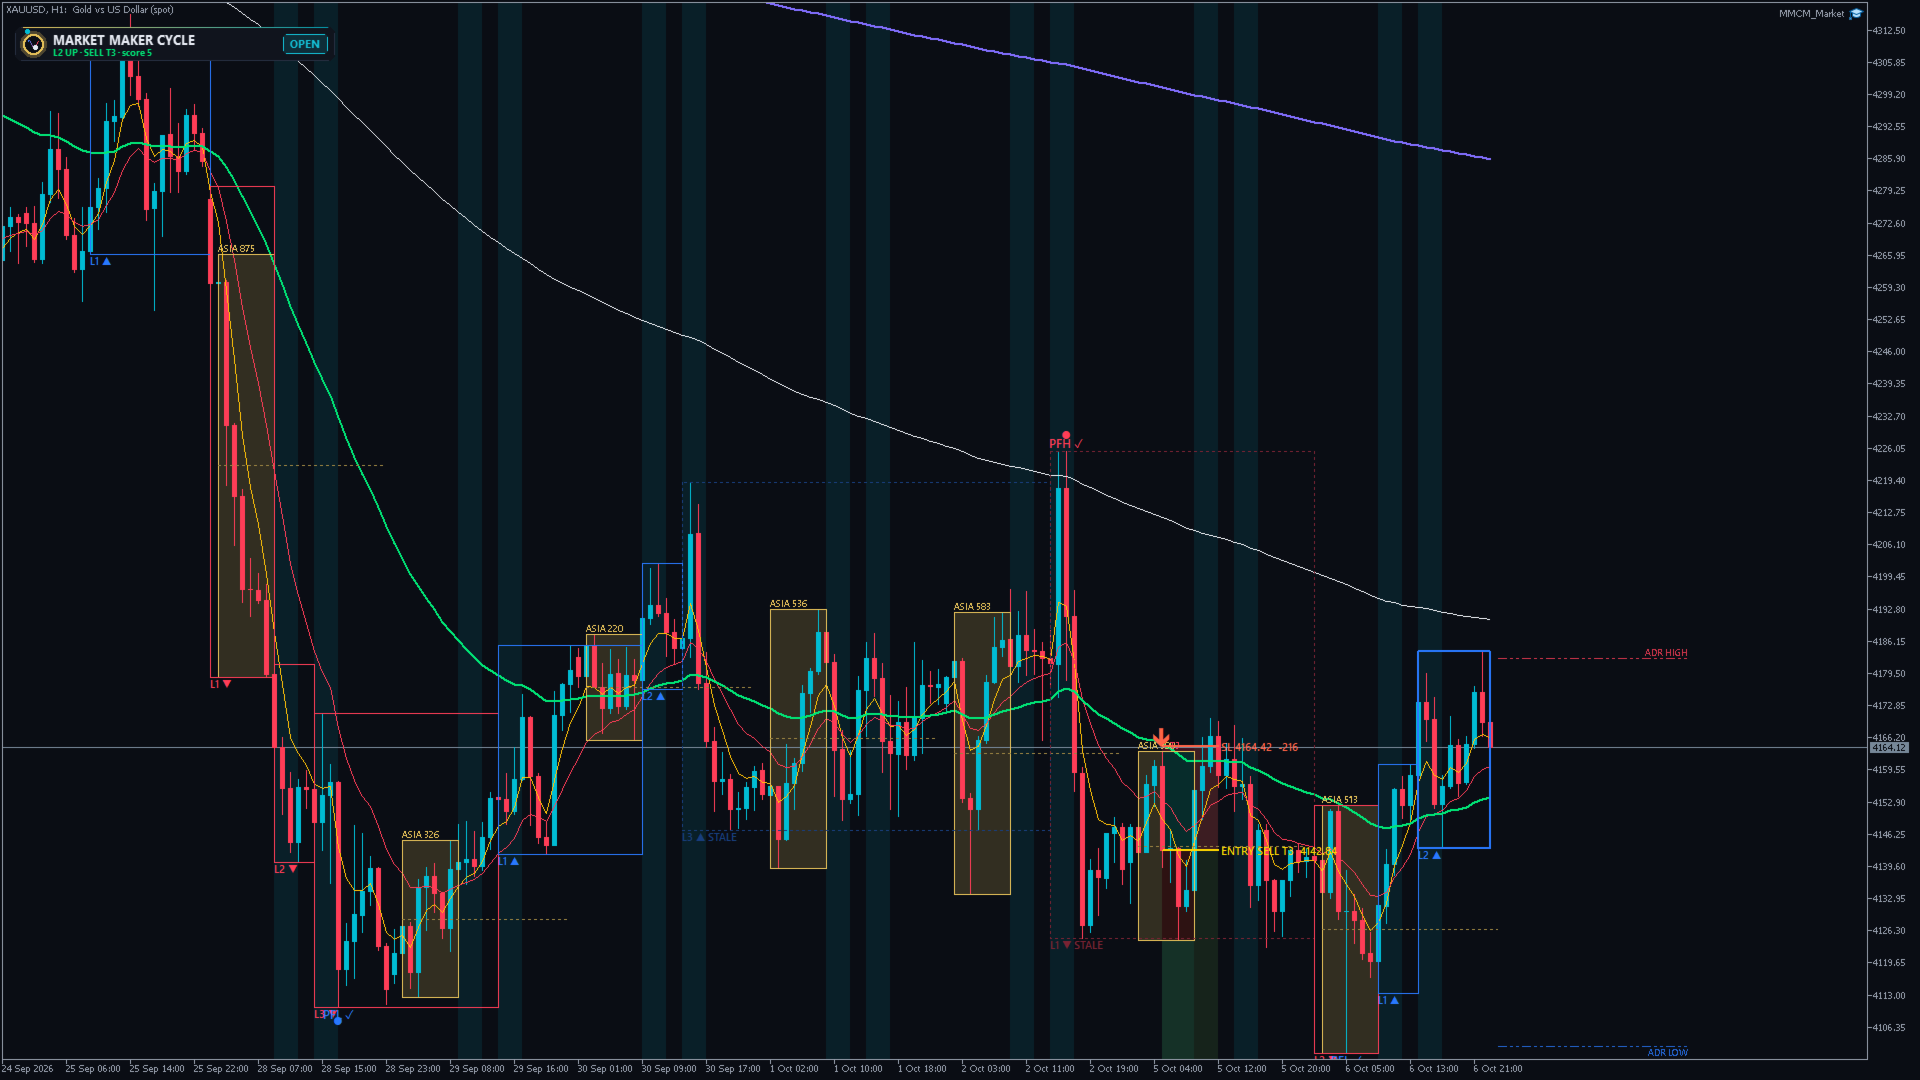
| 1. Asian range | From 19:00 to 02:00 New York time the market builds a quiet range. The indicator draws it as a gold box with a midline. Every setup refers to this box. |
| 2. Stop hunt | Around the London open, price often breaks one side of the range to trigger stop orders, and then turns. |
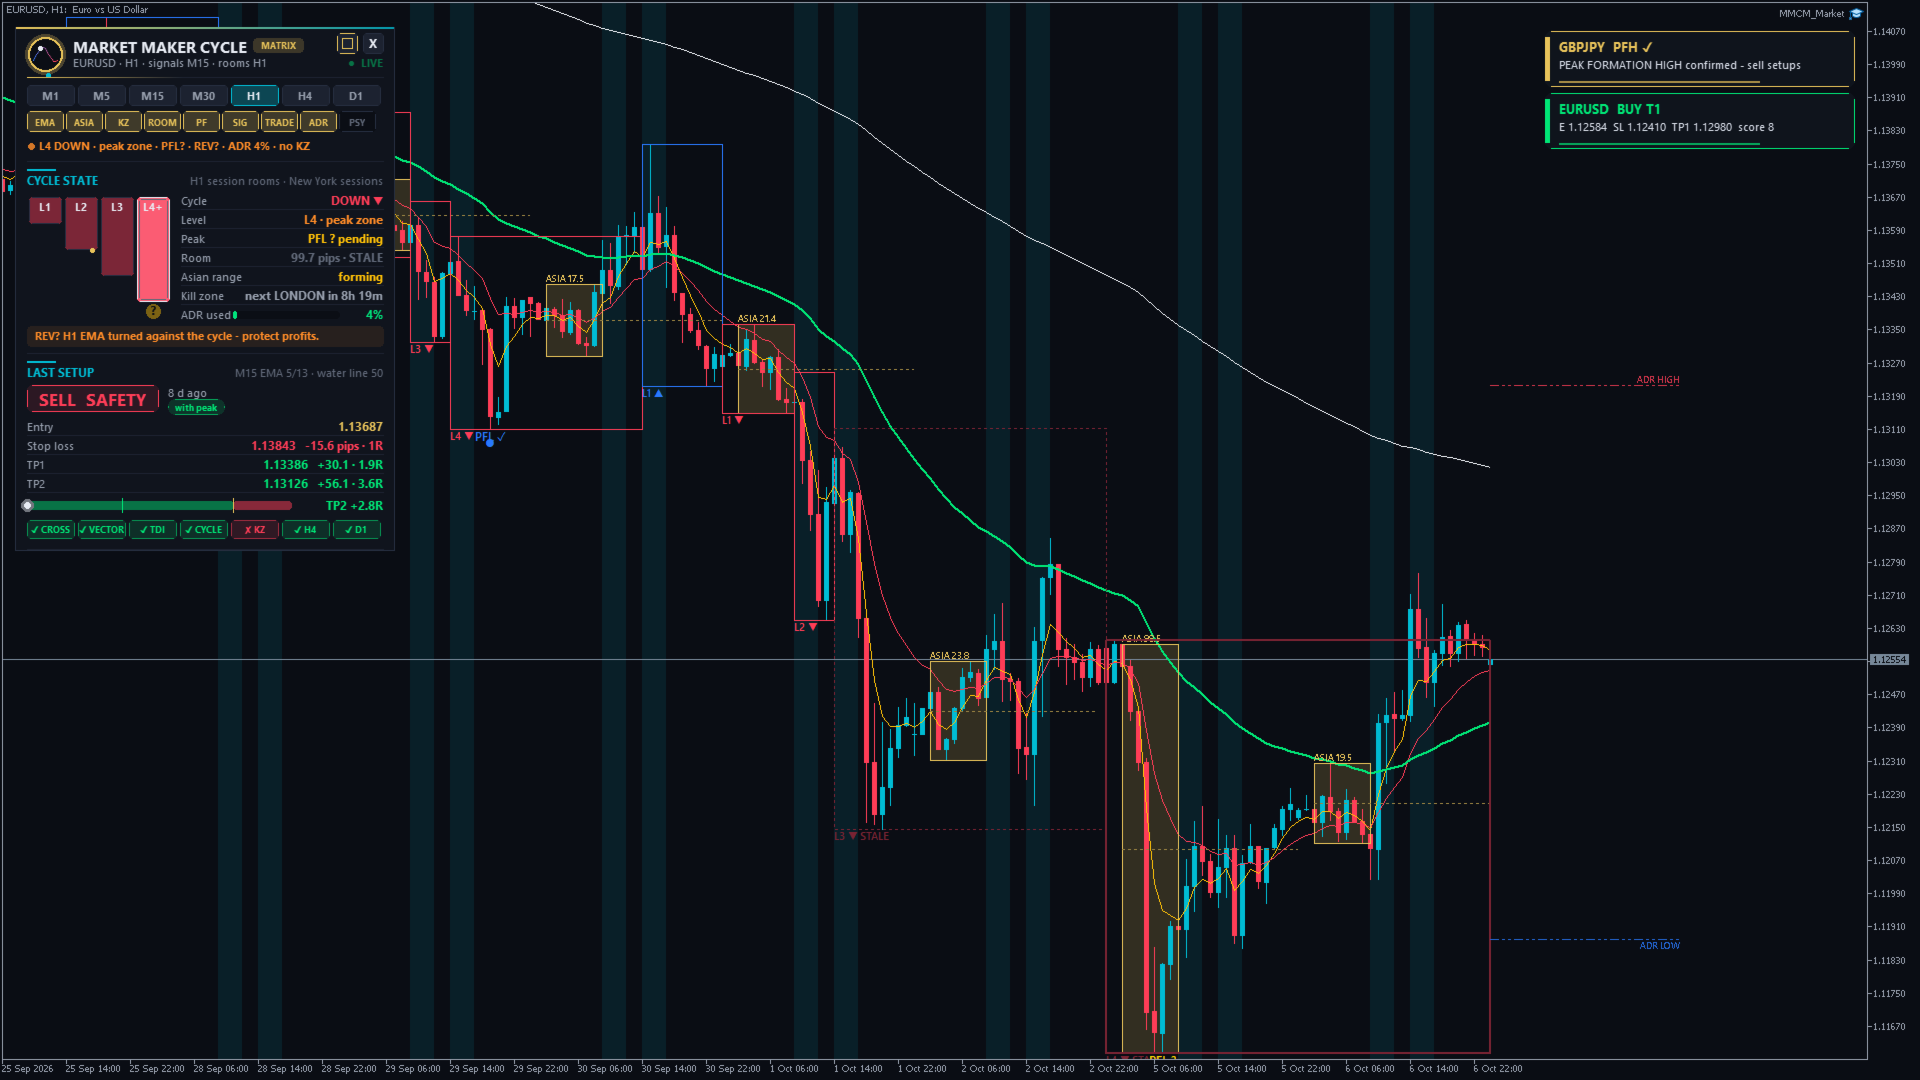
| 3. Levels | Each session (Asia, London, New York) forms a box on H1, called a room. An H1 close beyond the current room moves the cycle one level: L1 = consolidation, L2 = trend, L3+ = peak zone. |
| 4. Peak formation | From level 2 on, an H1 close against the cycle marks a pending peak (PFH ? / PFL ?). When a later close goes beyond the break candle, the peak is confirmed (PFH ✓ / PFL ✓). The cycle turns and counts again from L1. |
Basic rule: trade with the cycle at L1 and L2. At L3+ wait for a confirmed peak and trade the reversal. The dashboard tells you in plain words which situation applies right now.
■ Sessions and kill zones
- All times are in New York time. US daylight saving is handled automatically, so the boxes stay right all year.
- Your broker's server time is detected automatically. You can also enter the GMT offset yourself.
- London kill zone 02:00–05:00 and New York kill zone 07:00–10:00 (New York time) are shaded on the chart. You can change all session times in the inputs.
- ADR high / low targets of today: day low + ADR and day high – ADR.
■ Five entry types (always on M15)
Every entry needs the EMA 5 crossing the EMA 13 on a closed M15 candle. The 50 EMA is the "water line". The signals are computed on M15 on every chart timeframe, so they are the same on M5, H1 or H4.
| T1 | Stop hunt – price broke the Asian range against the trade (stop hunt), then the EMA cross comes back |
| T2 | Inside the range – EMA cross inside the Asian range, before any break (off by default) |
| T3 | Water line – EMA cross at the 50 EMA after a move |
| ID50 | Inside + water line – inside the Asian range and at the 50 EMA at the same time |
| SAFETY | Safety – the range already broke in the trade direction, price pulls back to the 50 EMA and the cross confirms |
Filters you can switch on or off: vector candle (strong body), TDI momentum, cycle direction, no late entries in the peak zone, kill zones only, H4 trend, D1 trend.
■ Every signal comes complete
- Entry, stop loss, TP1 and TP2 are drawn on the chart. The stop goes beyond the stop-hunt wick, the signal candle or the last swing, plus a small ATR buffer.
- The targets come from the ADR projection: TP1 = day extreme + 1 x ADR, TP2 = + 1.5 x ADR. TP1 is always at least 1R away.
- Reward / risk zone on the chart and a live progress bar from stop to TP2 with the current price
- Checklist for each signal: cross, vector, TDI, cycle, kill zone, H4, D1 – green = passed, red = not met
- "with peak" / "vs peak" tag: shows whether the trade goes in the direction of the last confirmed peak formation
■ Signal journal – how did the signals end?
Every signal is followed until it ends: TP1, TP2, stop, back to entry, or expired after 3 days. The result is counted in R: half closes at TP1 and the stop of the rest moves to entry. If the stop and a target are hit in the same candle, it counts as the stop.
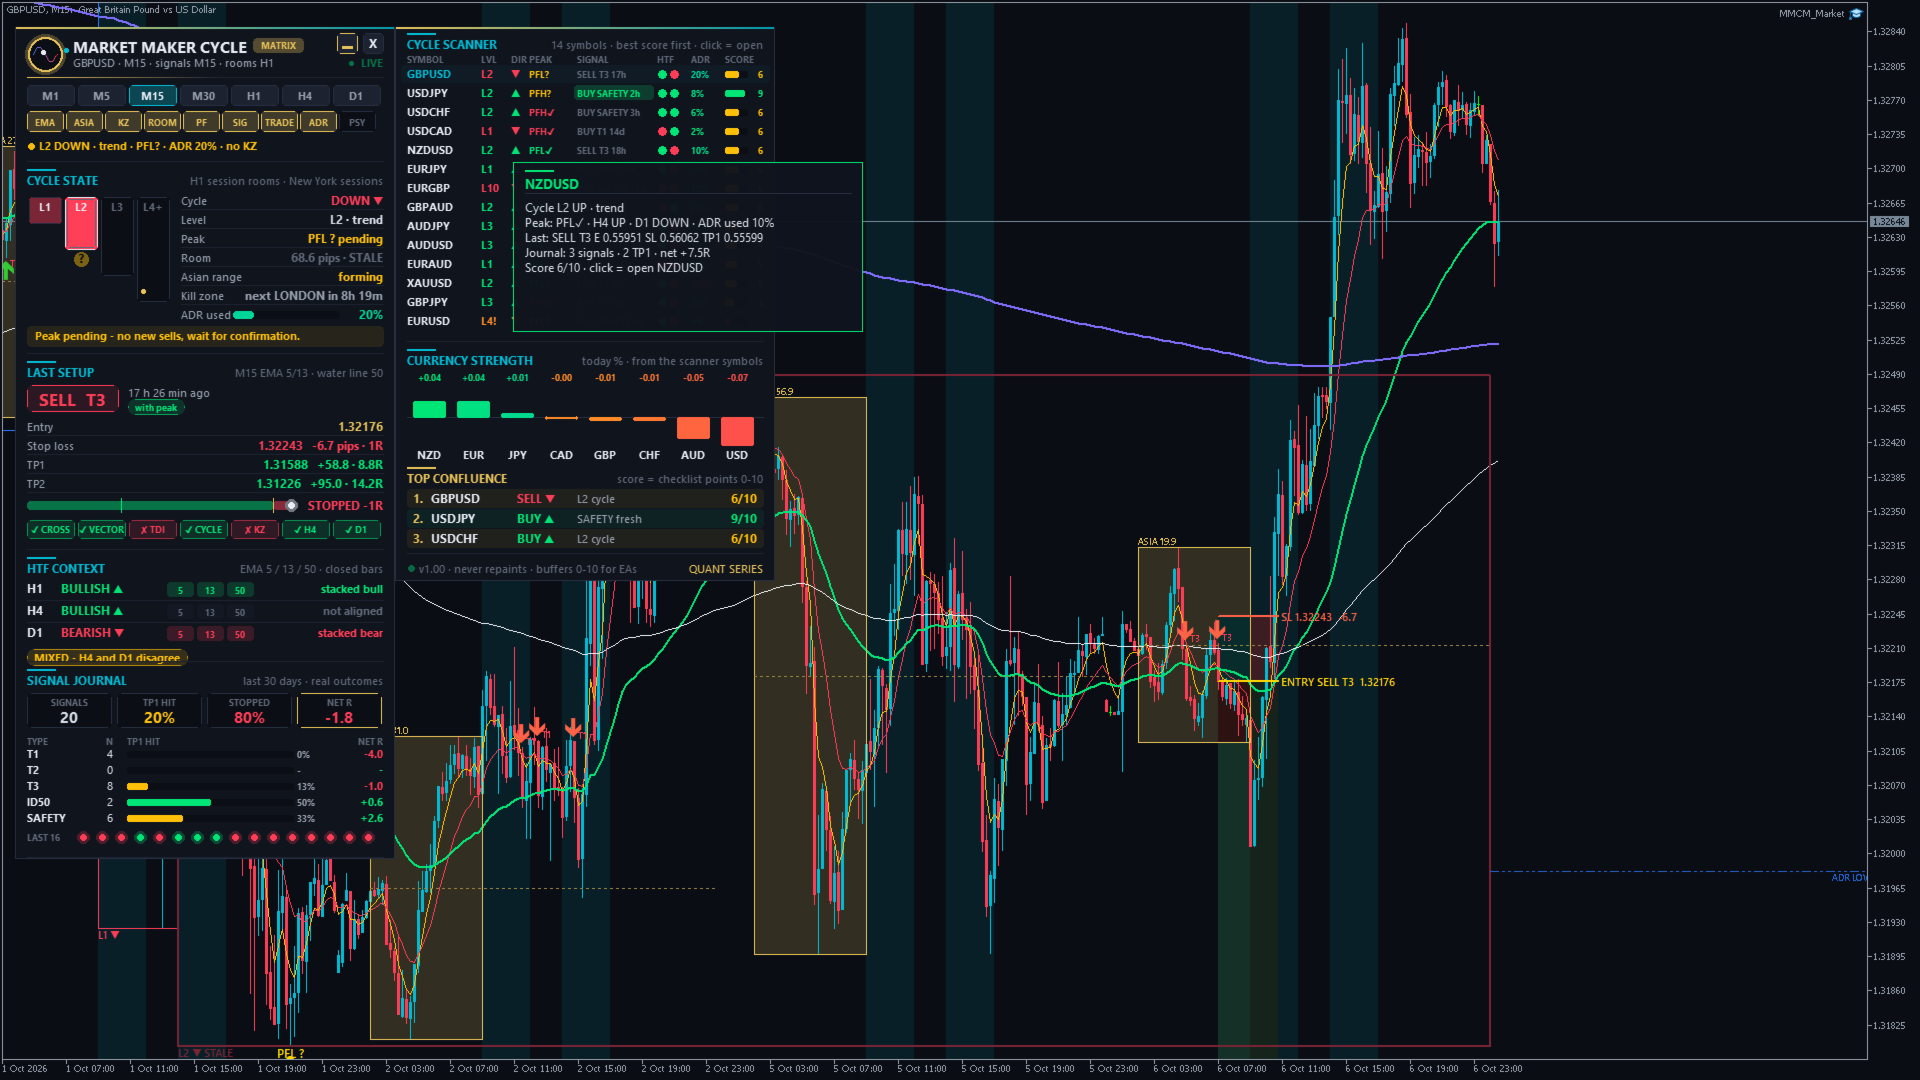
- Signals, TP1 hit rate, stop rate and net R of the last 30 days
- The same figures for each entry type
- The last 16 outcomes as coloured dots. Hover a dot to see that trade.
The journal shows how past signals ended. It does not promise future results.
■ Scanner, confluence score and currency strength
- Up to 24 symbols from one chart: level, direction, peak, last signal with its age, H4 / D1 trend, ADR used and score. Click a row to open that symbol.
- Confluence score 0–10, built from checklist points: cycle direction, fresh signal, H4, D1, kill zone, room left in the ADR, with the peak, level 1–2. A reversal warning subtracts points.
- Top 3 confluence: the three best setups right now
- Currency strength of the 8 major currencies, calculated from the scanner symbols
- Reversal warning at L3+: the H1 EMA 5/13 has turned against the cycle (marked "L3!" and "REV?")
■ Animated dashboard
- Cycle state with an animated level staircase, peak status, current room, Asian range, kill zone countdown and ADR used
- One line of plain-English advice, for example "Peak zone – only reversals after a confirmed PF"
- Active setup, HTF context (H1 / H4 / D1 with the EMA 5 / 13 / 50 stack), journal, scanner and currency strength
- Timeframe buttons and 9 layer buttons: EMA, Asian range, kill zones, rooms, peaks, signals, trade lines, ADR, psychological levels. Your choice is saved for each chart.
- Hover over any value to see what it means and how it was calculated
- Drag the panel anywhere. Close it to a small pill with one click, or switch to the compact panel. When the chart window is too small, it switches to compact by itself.
- It moves out of the way of other Quant Series panels on the same chart
■ Alerts
- Popup, sound, push notification, e-mail and an on-chart toast banner
- Events: new signal (chart and scanner), confirmed peak formation, reversal warning, kill zone open
- Each event is reported only once, also after a restart of the terminal
- Catch-up: signals that formed while the terminal was offline are reported once
- Options: minimum confluence score, scanner alerts only inside the kill zones
■ How to use it in 5 steps
- 1. Open the scanner and look for a high score during a kill zone.
- 2. Check the HTF context: H4 and D1 should agree with the trade.
- 3. Click the symbol and switch to M15 or H1.
- 4. Check the level: trade with the cycle at L1 / L2. At L3+ wait for a confirmed peak.
- 5. Use the drawn entry, stop and targets, and check that the ADR still has room left.
■ For Expert Advisors (iCustom buffers)
| 0–4 | EMA 5 / 13 / 50 / 200 / 800 |
| 5 | Cycle level (+ = up cycle, – = down cycle) |
| 6 | Signal: +1 to +5 = buy, –1 to –5 = sell (T1, T2, T3, ID50, Safety) |
| 7–10 | Entry, stop loss, TP1, TP2 of the signal |
■ Notes
- Works on forex pairs, gold, indices and every other symbol, on every timeframe. M15 and H1 give the clearest view.
- The scanner needs H1, M15, H4 and D1 history of every symbol. The first load takes a few seconds.
- In the Strategy Tester the scanner only shows the tested symbol, because the tester provides data for one symbol.
- The indicator does not open, close or change trades.
- Trading involves risk. This tool shows market structure. It is not financial advice.