Trend Strength Dashboard Seven Timeframes
- Indicatori
- Versione: 1.0
- Attivazioni: 10

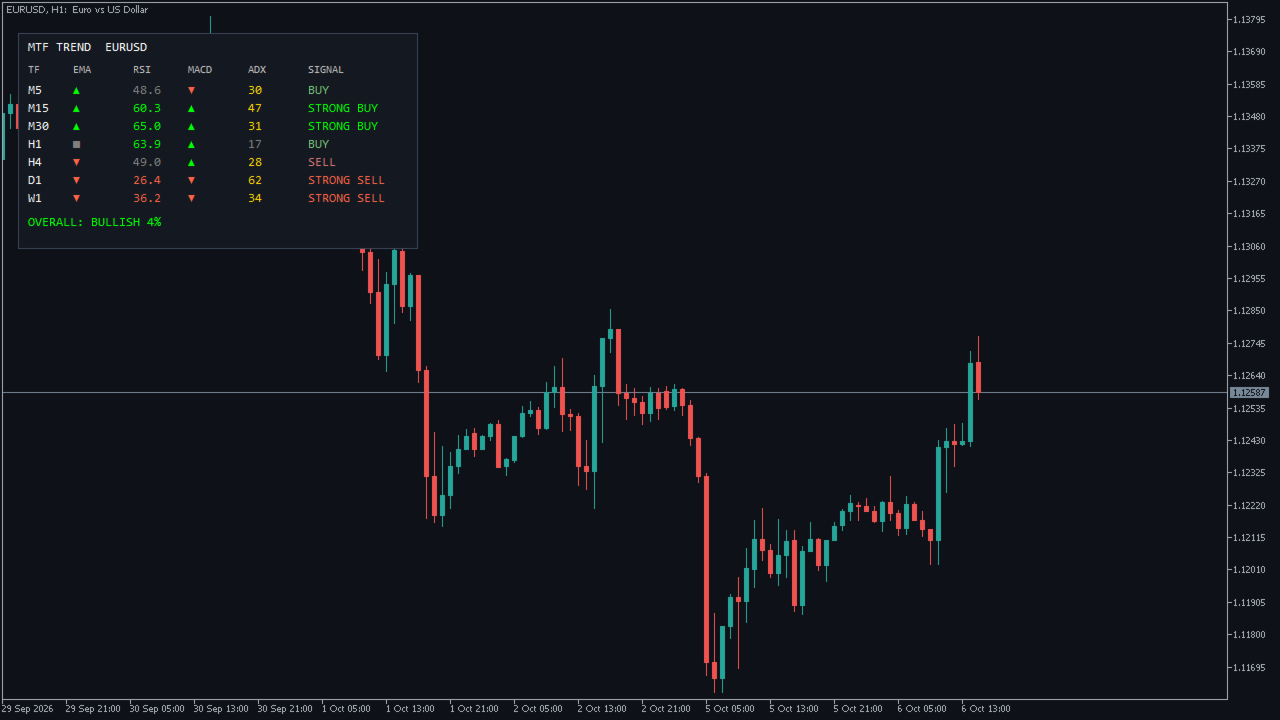
Trend Strength Dashboard Seven Timeframes analyses M5, M15, M30, H1, H4, D1 and W1 at the same time and shows the results in one clean panel. Stop switching timeframes.
For each timeframe
- EMA trend direction, using both the fast/slow cross and price position.
- RSI value, colored by momentum.
- MACD direction.
- ADX trend strength. A weak trend lowers the score.
- A final signal: STRONG BUY, BUY, NEUTRAL, SELL or STRONG SELL.
Overall bias. A percentage that combines all timeframes. When all timeframes align above your chosen threshold, you get an alert by pop-up or push notification.
Inputs
- Fast EMA, Slow EMA, RSI period, ADX period – indicator settings used on every timeframe.
- ADX trend threshold – below this value a timeframe's score is halved.
- Panel X / Y position, Background color – place and style the panel.
- Min overall bias for alert (%) – alert threshold.
- Popup alert, Push notification – alert options.
Lightweight, updates live, and works on any symbol.