Pulse Matrix
- Indicatori
- Versione: 1.0
- Attivazioni: 10

Pulse Matrix
Multi-Timeframe Currency Strength Dashboard for MetaTrader 5
Multi-Timeframe Currency Strength Dashboard for MetaTrader 5Pulse Matrix
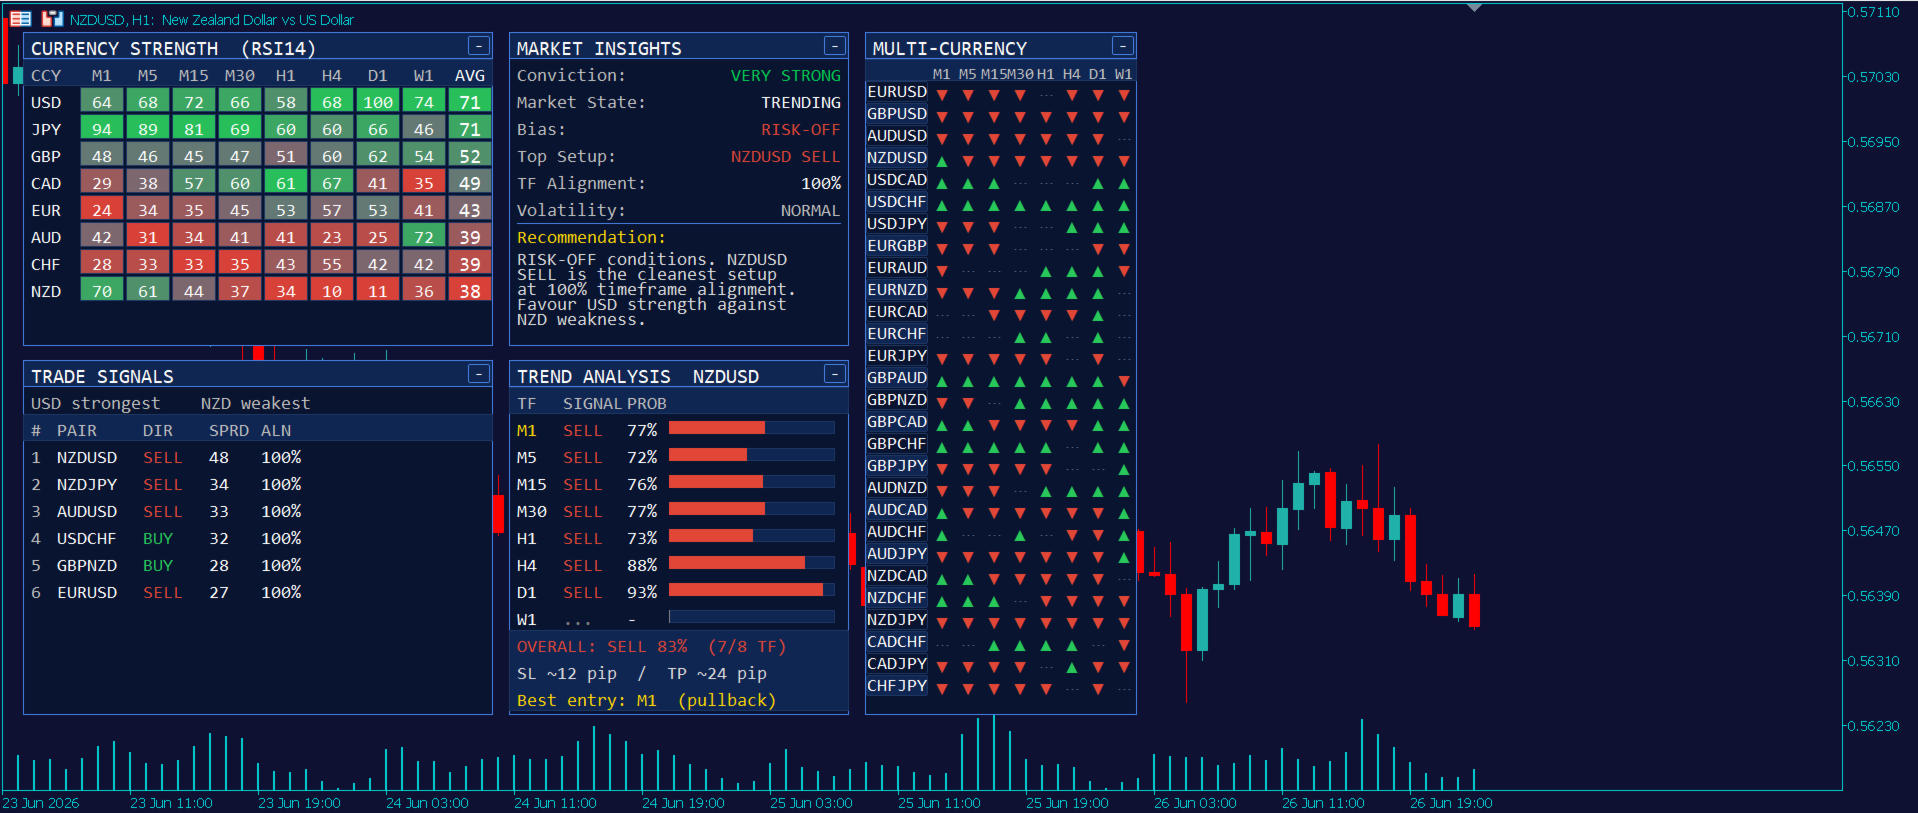
Pulse Matrix turns the entire FX market into one decision surface. It measures the real-time strength of all 8 major currencies across every timeframe from M1 to W1, ranks the strongest and weakest, and tells you exactly which pairs that strength favours — then reads the live trend of whatever chart you're on. Five connected panels, one clean dashboard, zero chart-switching.
Overview
Most strength meters give you a row of bars and leave you to guess what to do with them. Pulse Matrix is built the other way around: it starts from the market-wide strength picture and works forward to an actual decision — which currency is leading, which is lagging, which pair that points to, and how confident the read is.
It aggregates the momentum of every major pair to score each individual currency (USD, EUR, GBP, JPY, CHF, AUD, NZD, CAD) on every standard timeframe, then layers a signal engine, a market-context panel, a clickable 28-pair map, and a self-contained per-symbol trend analyser on top. The whole dashboard is draggable, collapsible, and remembers your layout between sessions.
It runs on any symbol — majors, crosses, metals, indices, crypto — because the Trend Analysis panel reads the chart's own price action, independent of the strength basket.
What's inside — five connected panels
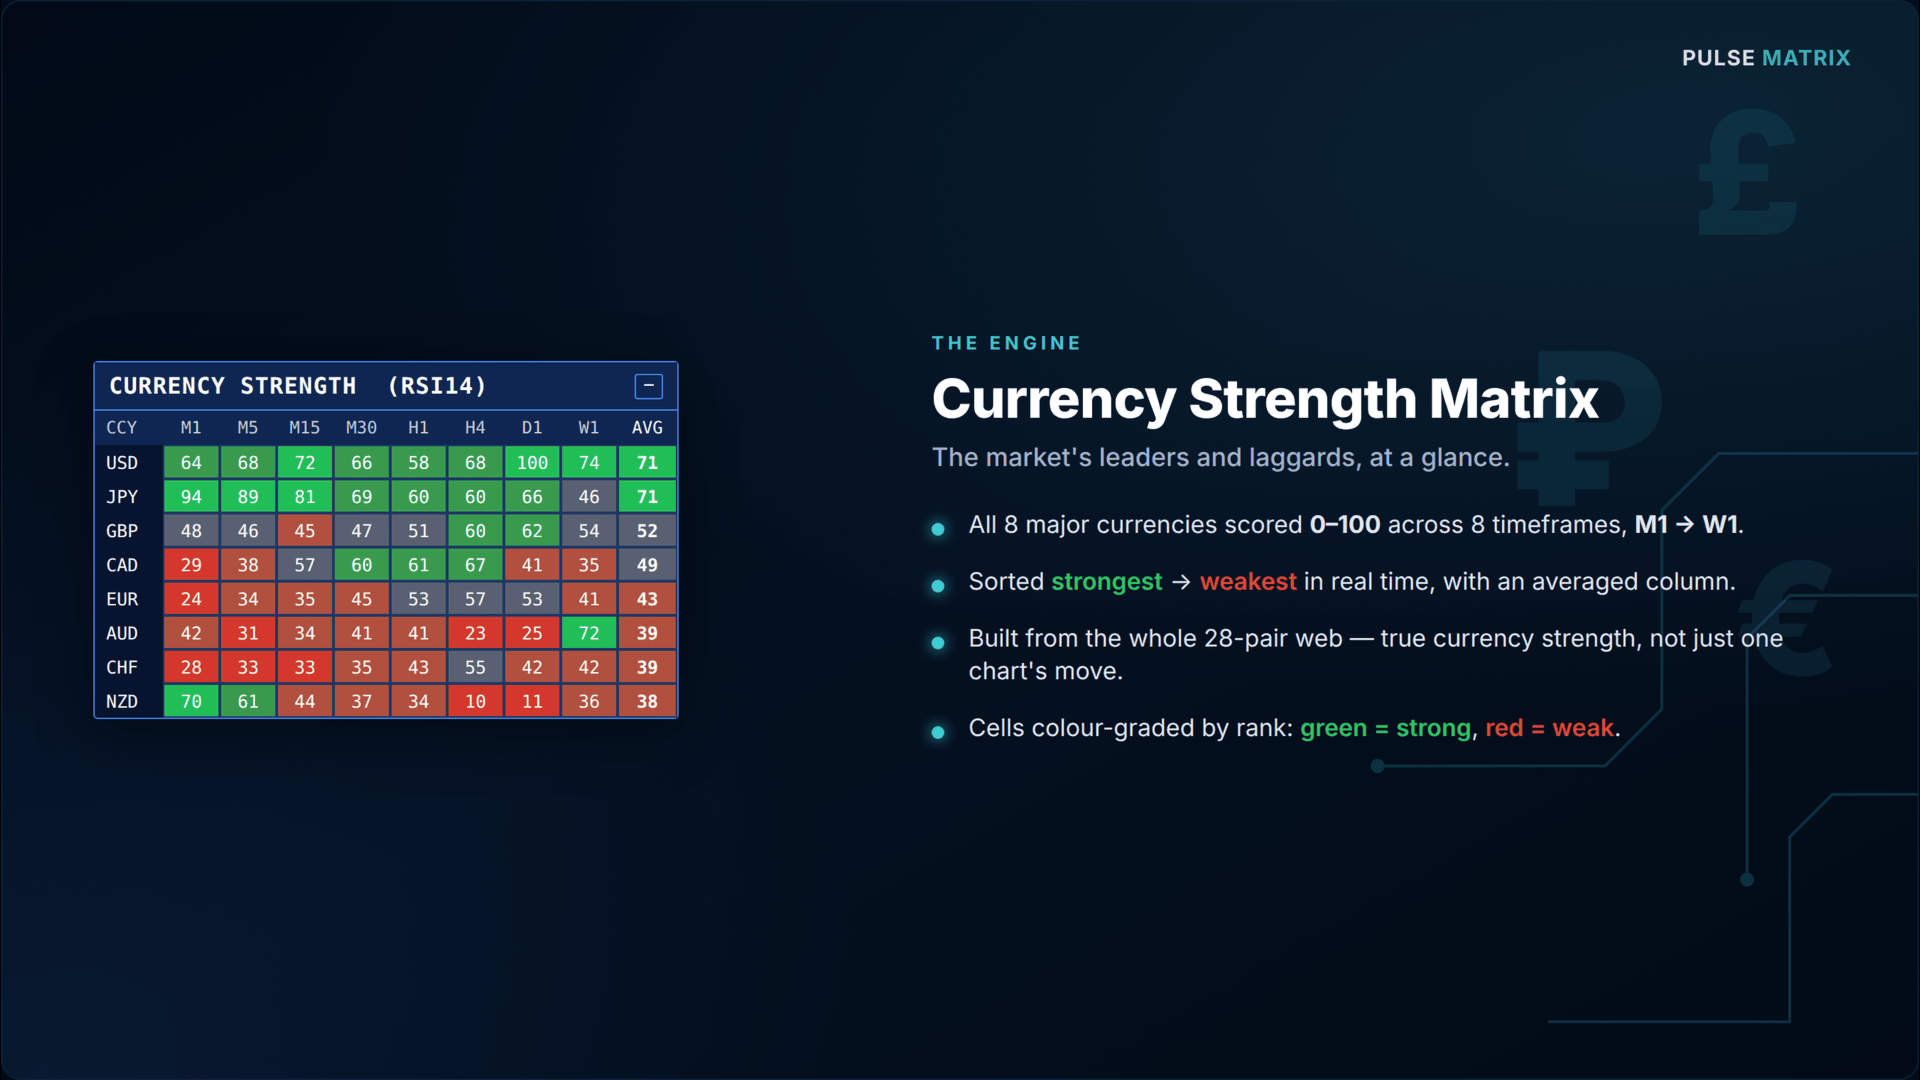
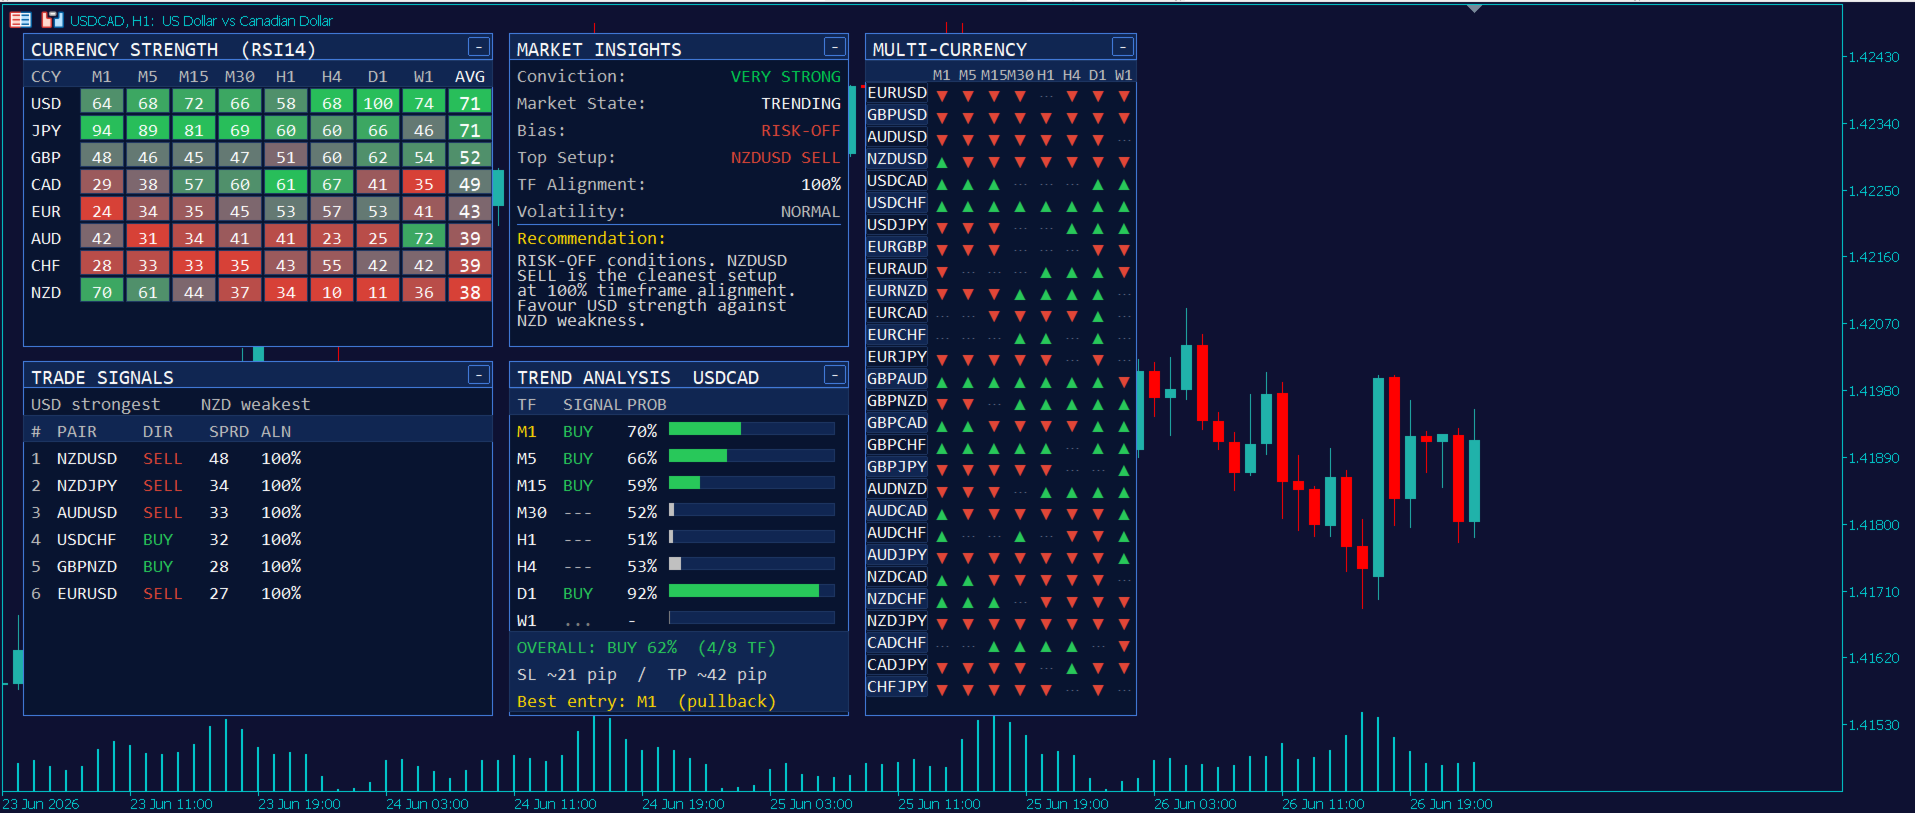
1. Currency Strength Matrix An 8-currency × 8-timeframe heatmap (M1 → W1) scored 0–100, sorted strongest-to-weakest in real time, with an averaged column. Each cell is colour-graded by relative rank so the leaders and laggards jump out at a glance.
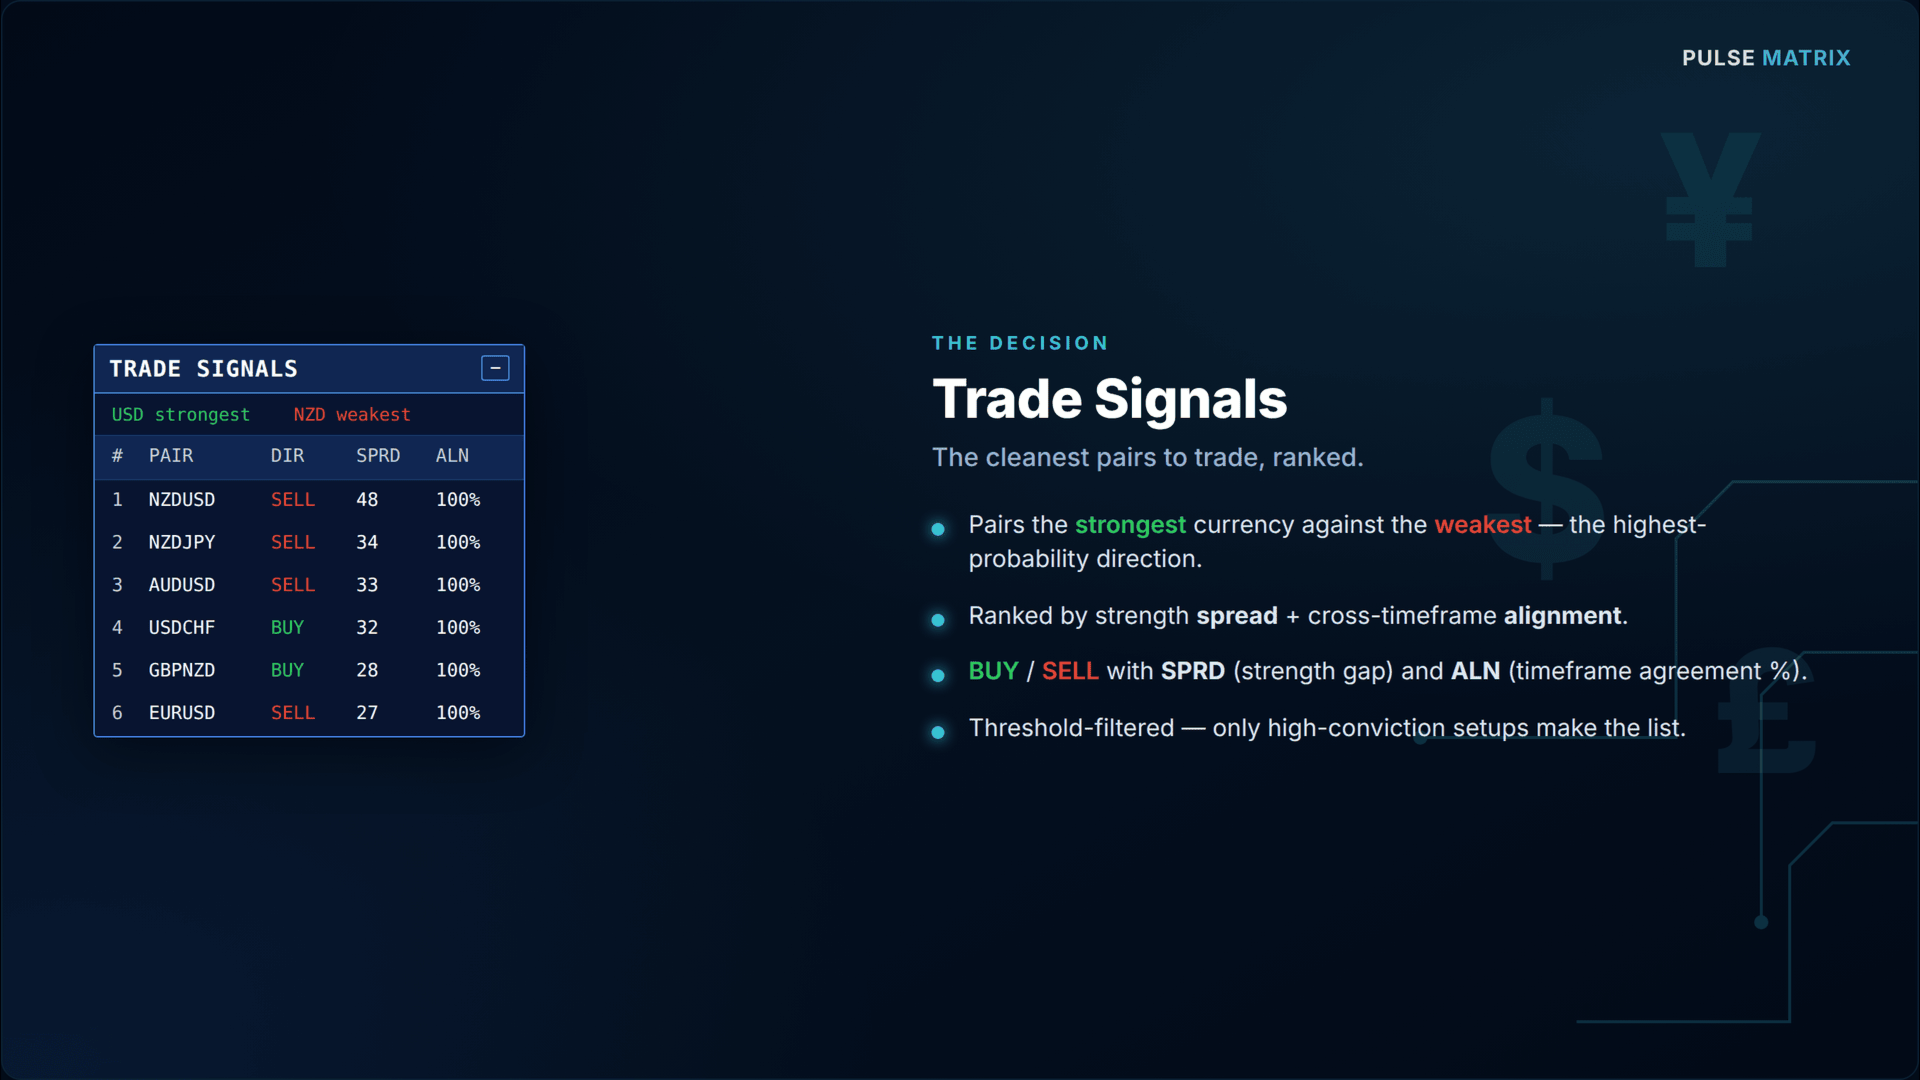
2. Trade Signals Ranks the cleanest pair opportunities by pairing the strongest currency against the weakest. Each signal shows the pair, BUY/SELL direction, the strength spread, and the timeframe alignment % — with thresholds so only high-conviction setups appear.
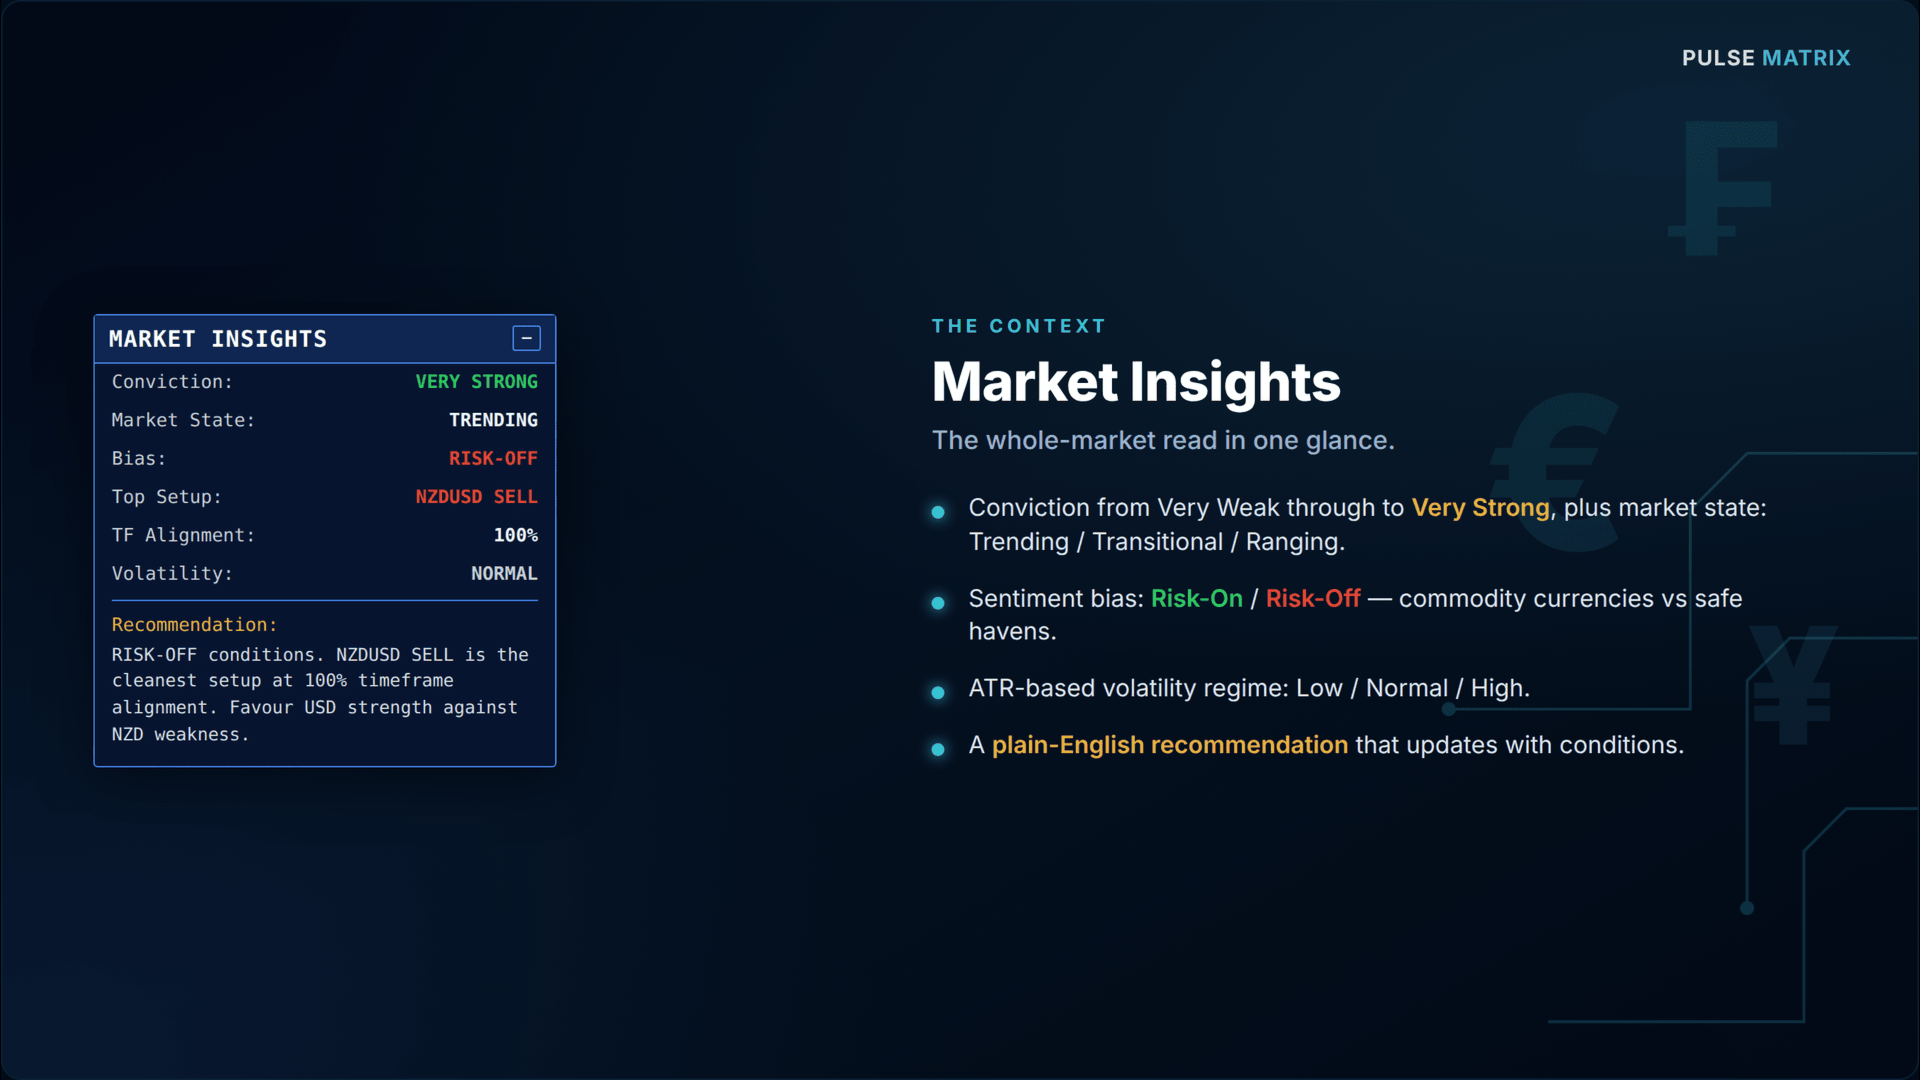
3. Market Insights The context layer: overall conviction, market state (Trending / Transitional / Ranging), a Risk-On / Risk-Off read (commodity currencies vs safe havens), the top setup, timeframe alignment, an ATR-based volatility regime, and a plain-English recommendation that updates with conditions.
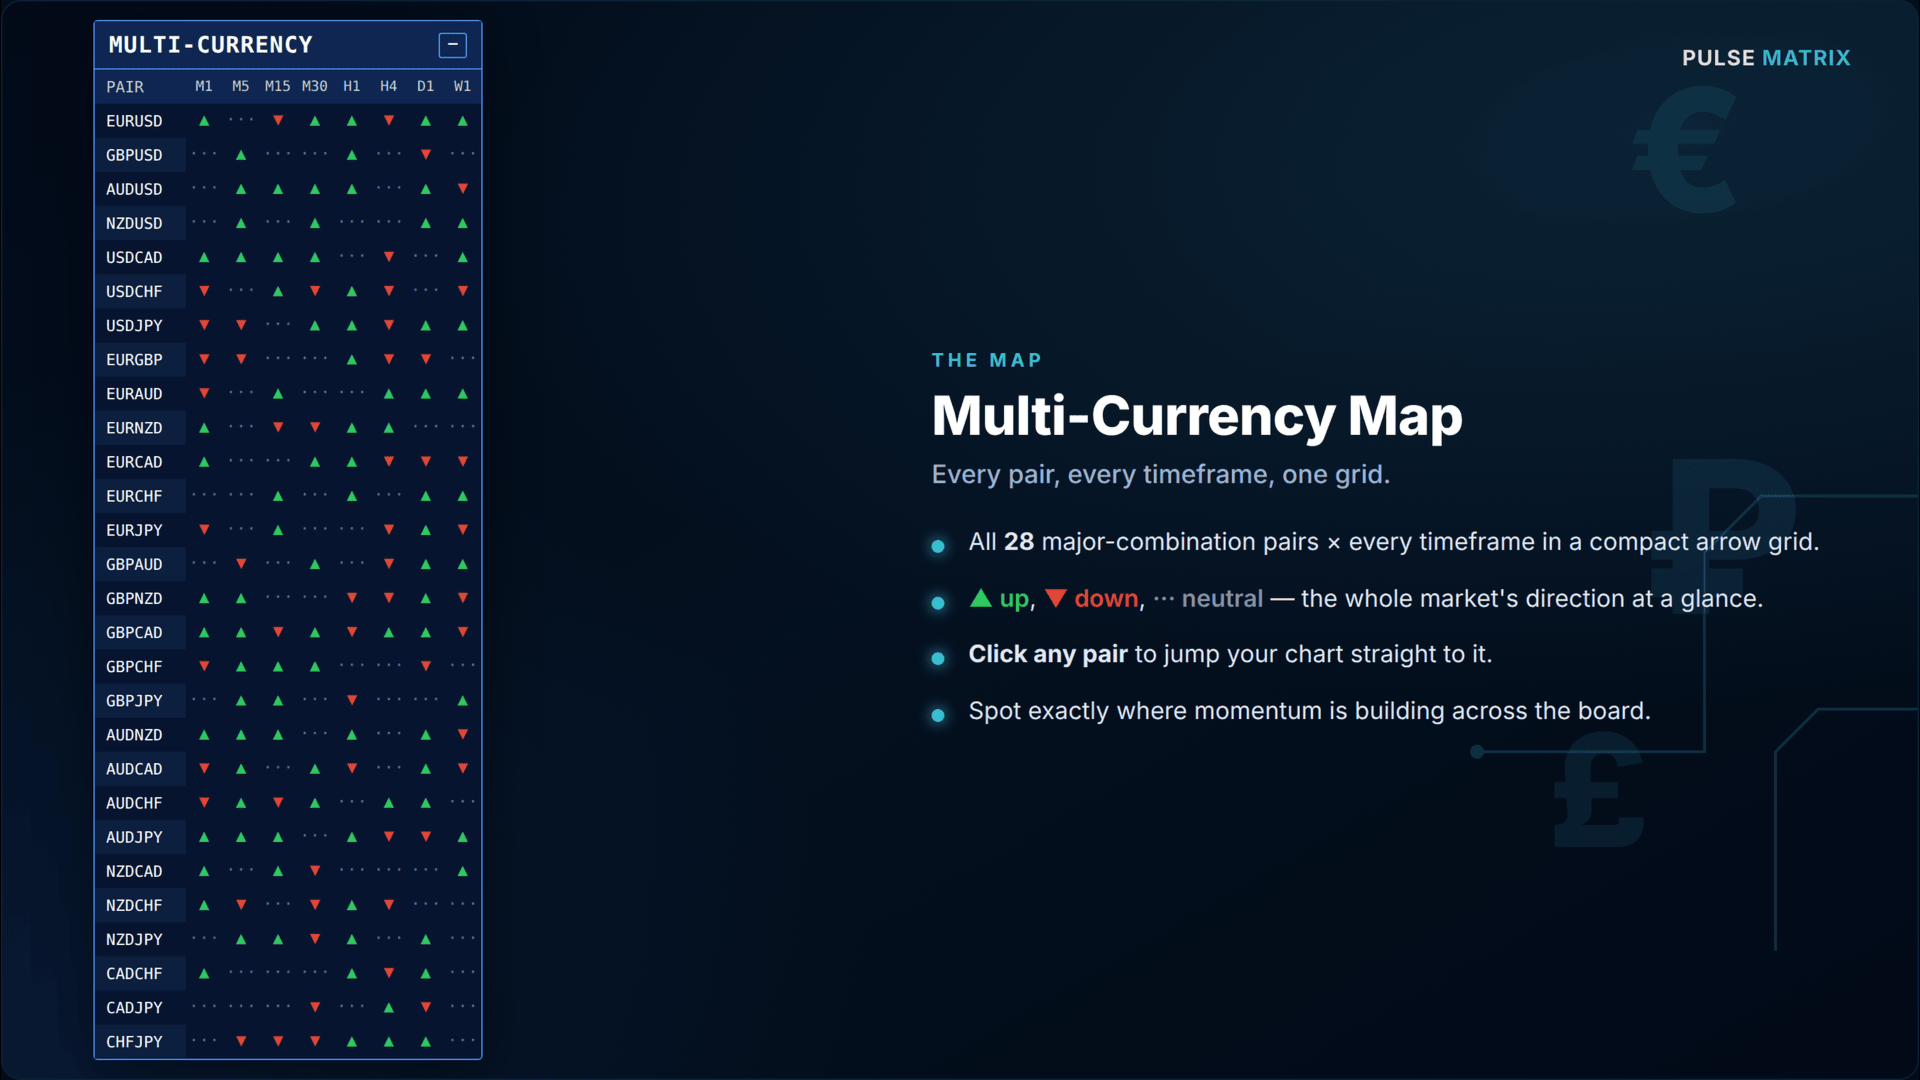
4. Multi-Currency Map All 28 major-combination pairs × every timeframe as a compact arrow grid — green up, red down, grey neutral. Click any pair to jump your chart straight to it.
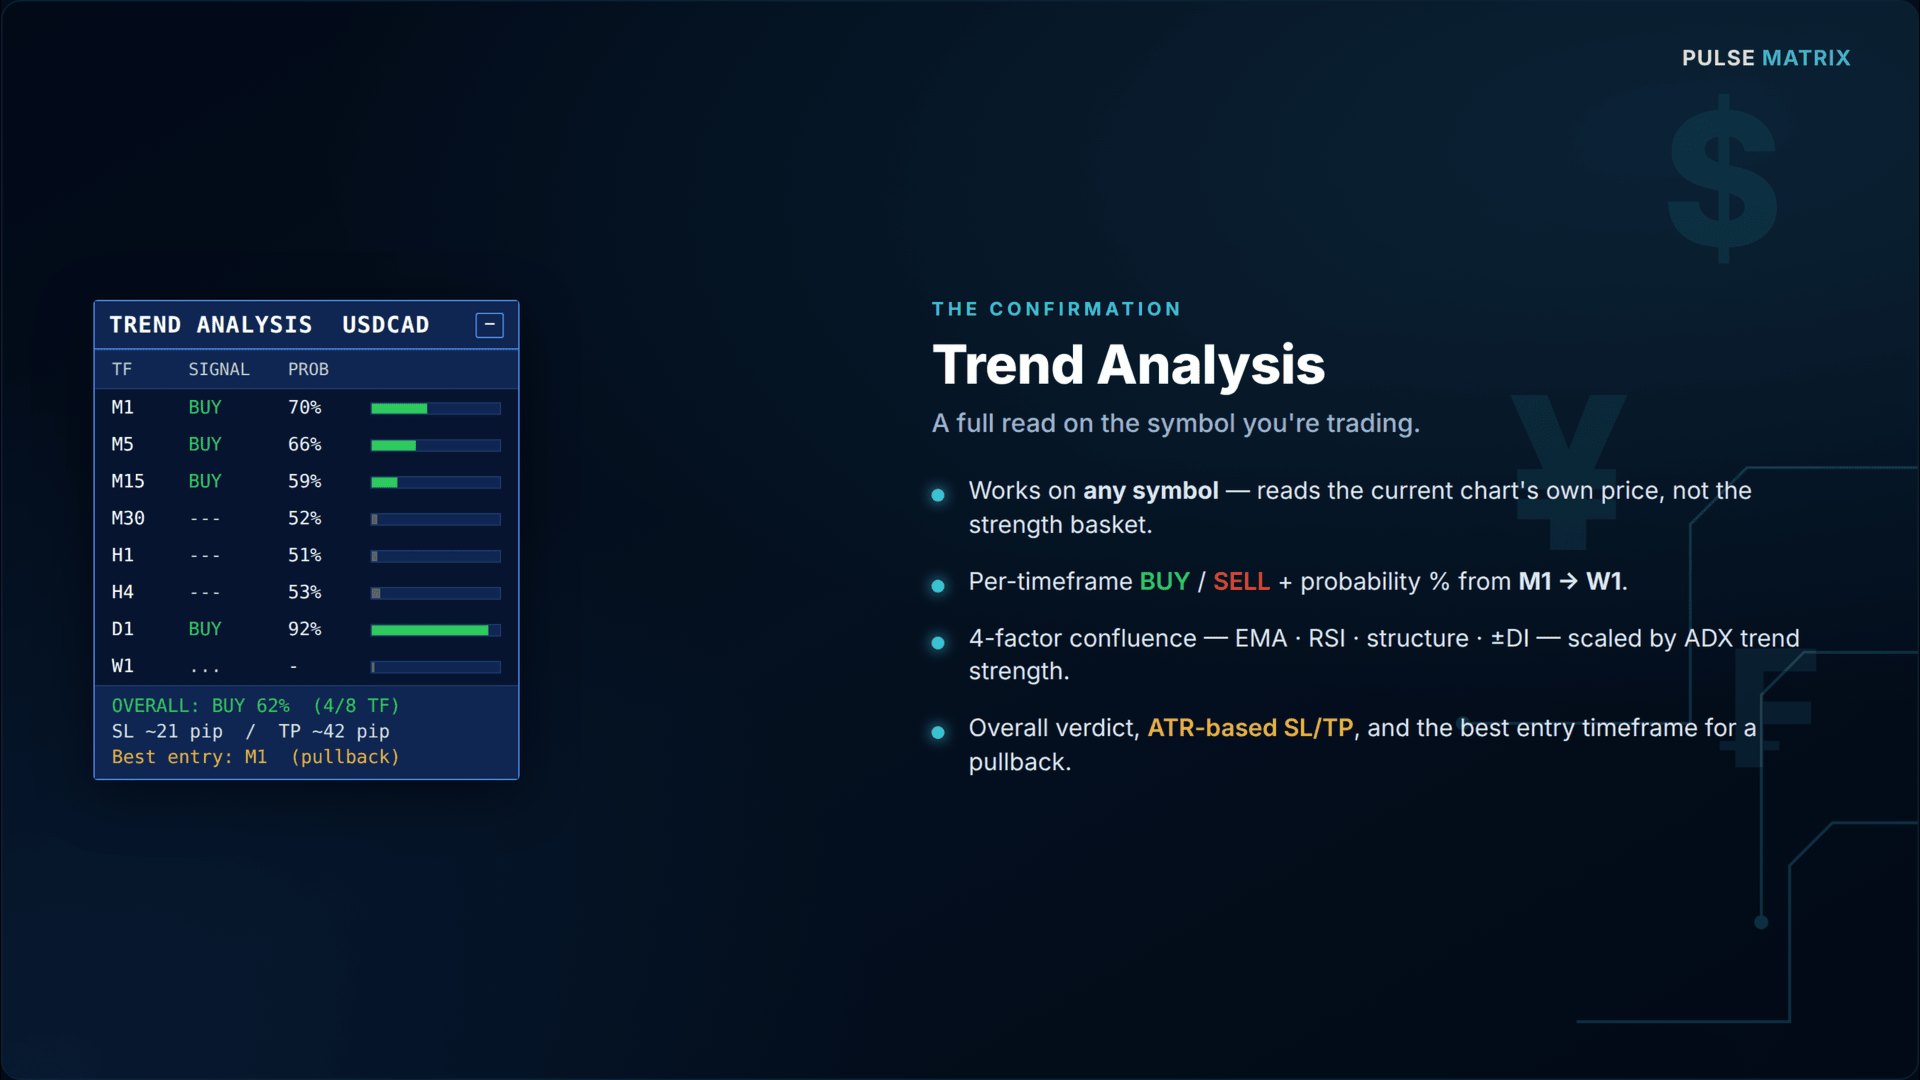
5. Trend Analysis (current symbol) A self-contained multi-factor trend read for whatever you're viewing: a BUY/SELL signal and probability % on each timeframe M1 → W1, an overall multi-timeframe verdict with agreement count, an ATR-derived SL/TP suggestion, and a "best entry timeframe" hint for trend-aligned pullback entries.
Key features
- 8 major currencies scored across 8 timeframes — 64 strength reads, refreshed live
- 28 major-combination pairs monitored simultaneously — no chart-switching
- Works on any symbol (FX, metals, indices, crypto) via the per-symbol trend engine
- Strongest-vs-weakest signal logic with spread + multi-timeframe alignment filters
- Risk-On / Risk-Off market bias and ATR-based volatility regime
- Per-symbol trend probability on every timeframe with confidence bars
- ATR-based SL/TP suggestion and trend-aligned "best entry timeframe" hint
- Clickable multi-currency map — one click switches the chart symbol
- Draggable panels — grab any title bar and move it anywhere
- Collapsible panels — collapse to the title bar to see the chart behind
- Persistent layout — positions and collapsed states survive reloads, timeframe switches, and restarts
- Automatic broker-suffix detection (with manual override)
- Applies a matching dark-blue chart theme automatically on attach
- Lightweight: batched timer refresh, reads pre-computed indicator buffers
- EMA stack — price vs fast EMA, fast EMA vs slow EMA
- Momentum — RSI displacement from the midline
- Structure — price position relative to its recent range
- Directional movement — +DI vs −DI
How the strength engine works
For every major pair on every timeframe, Pulse Matrix measures normalised momentum and distributes it to the two currencies in the pair — momentum credited to the base, debited from the quote. Averaging each currency's contribution across all seven pairs it appears in produces a clean 0–100 strength score, where 50 is neutral. Because the score is built from the whole pair web rather than a single pair, it reflects genuine currency strength, not just one chart's move.
The signal engine then takes the timeframe-weighted strength of each currency (higher timeframes weighted more heavily, the noisiest fast timeframes optionally excluded), finds the strongest and weakest, and ranks every pair by the strength spread between its two currencies. A setup is only flagged when the spread and the cross-timeframe alignment both clear your thresholds — so you see conviction, not noise.
How the Trend Analysis panel works
Independent of the strength basket, this panel reads the current chart symbol directly using a four-factor confluence model on each timeframe:
The factors combine into a BUY / SELL / neutral call, and the probability % is scaled by ADX — real trend strength — so a clean, aligned, high-ADX move reads high, while a choppy or conflicted one stays near 50. The overall row weights the higher timeframes, shows how many timeframes agree, suggests an ATR-based stop and target, and points to the lowest timeframe still aligned with the higher-timeframe trend for a pullback entry.
Recommended workflow
- Scan the Strength Matrix — note the strongest and weakest currencies and whether they agree across timeframes.
- Check Market Insights — favour Strong/Very Strong conviction with high timeframe alignment; stand aside on Ranging.
- Read the Trade Signals — the top-ranked pair is your strongest-vs-weakest candidate.
- Click that pair in the Multi-Currency Map to load its chart.
- Confirm with Trend Analysis — check the overall verdict, agreement count, and the suggested entry timeframe before committing.
Parameters
Calculation
Parameter Default Description
RSI Period 14 Momentum lookback for the strength engine
Refresh Seconds 5 Dashboard refresh interval
Sensitivity 120 Score spread gain (higher = more colour contrast)
Symbol Suffix (auto) Broker symbol suffix; blank = auto-detect
Signals
Parameter Default Description
Show Signals true Toggle the signal panel
Max Signals 6 Number of ranked setups listed
Min Spread 8.0 Minimum strength gap to flag a setup
Min Alignment 0.60 Minimum timeframe agreement (0–1)
Skip Fast TFs 2 Exclude the N fastest timeframes from signals
Insights
Parameter Default Description
Show Insights true Toggle the insights panel
Insights Width 340 Panel width (px)
Show Volatility true Compute the ATR volatility regime
Volatility TF H1 Timeframe used for the volatility read
Multi-Currency
Parameter Default Description
Show Multi-Currency true Toggle the arrow map
Pair Label Width 64 Width of the clickable pair buttons
Arrow Cell Width 26 Width of each timeframe cell
Arrow Threshold 6.0 Strength gap needed for an arrow vs neutral dots
Trend Analysis
Parameter Default Description
Show Trend Analysis true Toggle the per-symbol panel
Fast / Slow EMA 21/50 EMA stack periods
RSI / ADX Period 14/14 Momentum and trend-strength periods
Structure Lookback 20 Bars used for the structure factor
Neutral Threshold 0.15 Below this net score = ranging
ATR TF / Period Current / 14 ATR used for SL/TP sizing
SL Multiplier 1.5 Stop distance = ATR × this
Reward:Risk 2.0 Take-profit = stop × this
Panel position, cell size, font, and colour layout inputs are also available for fine-tuning. The colour theme is fixed for a consistent look.
Compatibility & requirements
Platform: MetaTrader 5 Type: Indicator (chart window) Markets: Any — optimised for the 28 major FX combinations; the Trend Analysis panel works on metals, indices, and crypto too Account: Works on any broker; symbol suffix is auto-detected, with a manual override for non-standard naming
Recommended use cases
Top-down traders who want the market-wide bias before drilling into a pair Swing and day traders hunting strongest-vs-weakest pairings Trend traders confirming multi-timeframe alignment before entry Anyone tired of flipping through 28 charts to find where the momentum is
Important note
Pulse Matrix is an analytical and decision-support tool. It does not place trades and does not guarantee results. Trading carries risk; always combine its readings with your own analysis and risk management. Past or simulated behaviour does not predict future performance.