QCL Dynamic RSI Zones MT5

QCL Dynamic RSI Zones — MetaTrader 5

QCL Dynamic RSI Zones combines a smoothed RSI signal with adaptive boundaries to help you assess momentum in the context of recent market conditions.

Instead of relying on fixed overbought and oversold levels, the indicator adjusts its zones using recent RSI behavior. A dynamic balance line, a color-changing signal, and excursion columns provide a clear view of momentum shifts in a separate chart window.

Key Features

  • Adaptive zones: Upper and lower boundaries respond to recent RSI conditions.

  • Smoothed signal: Reduces short-term fluctuations for easier visual interpretation.

  • Dynamic balance line: Provides a reference for assessing relative momentum.

  • Color-coded momentum: The signal is green above the balance line and red at or below it.

  • Excursion columns: Highlight movement beyond the adaptive boundaries.

  • Customizable appearance: Adjust plot colors, styles, and widths through the Colors tab.

  • Flexible application: Use on different symbols and chart timeframes when sufficient history is available.

Reading the Indicator

A signal above the balance line indicates stronger relative momentum. A signal below it indicates weaker relative momentum.

Movement above the upper boundary highlights an upward momentum excursion. Movement below the lower boundary highlights a downward excursion. These conditions can help you evaluate momentum expansion, pullbacks, and potential exhaustion alongside price structure.

An excursion does not automatically mean that price will reverse. Strong momentum can remain outside a zone for several bars. The adaptive boundaries may also overlap during compressed RSI conditions.

Inputs

  • Length — Default: 14: Controls the underlying calculation length. Lower values increase responsiveness; higher values provide more smoothing.

  • Window — Default: 60: Sets the historical window used to construct the adaptive zones.

  • Upper Factor — Default: 0.10: Adjusts the upper boundary.

  • Lower Factor — Default: 0.10: Adjusts the lower boundary.

Designed for Discretionary Analysis

QCL Dynamic RSI Zones can complement trend analysis, support and resistance, and other trading methods. It is an analytical indicator and does not place or manage trades.

Values on the current candle update as prices change. For decisions based on completed bars, wait for the candle to close.

Platform: MetaTrader 5
Display: Separate indicator window
Developer: Quant Chart Lab


Prodotti consigliati
Indicatore professionale con due medie mobili ponderate e rilevamento automatico delle fasi di mercato laterale. WMA1 (prezzo di apertura) indica il bias di trend. WMA2 (prezzo di chiusura) conferma il momentum. Quando la distanza tra le WMAs si riduce, le candele diventano grigie per segnalare consolidamento. Funziona su tutti gli strumenti e timeframe. Aggiorna alla versione Pro Include segnali di ingresso/uscita, colorazione long/short, filtro EMA HTF, conferma MACD, filtro SMA, avvisi in t
FREE
GDS Renko Pip ST Chart - Pip-Based Renko Chart Indicator for MetaTrader 5 GDS Renko Pip ST Chart is a pip-based Renko chart indicator for MetaTrader 5. It helps traders build and study cleaner Renko price movement using a practical fixed pip or point-based brick structure. This tool is designed as a Renko chart foundation for manual analysis. It does not predict the market, does not generate buy or sell signals and does not decide whether a trade should be opened. Renko EDGE EA Golden Delta | A
FREE
Auto Fibonacci
Ali Gokay Duman
5 (3)
This indicator calculates fibonacci levels via moving averages trend and draw these lines. You can change fast and slow Moving Averages settings for customization. Inputs: Fast MA Time Period :  64 Fast MA Shift: 0 Fast MA Method: Smoothed Fast MA Apply To: Median Price Slow MA Time Period: 32 Slow MA Shift: 0 Slow MA Method: Smoothed Slow MA Apply To: Median Price ZigZag: False ZigZag Color: Red ZigZag Type: DashDot ZigZag Width: VeryThin Fibo Settings TrendFibonacci: True FiboTrendColor: Black
FREE
Dual Period Filter — Adaptive Coppock Curve for MT5 Overview The Coppock Curve is built from the sum of a long and a short rate of change, smoothed afterwards, and is used to observe the direction and strength of medium-term momentum. This indicator extends the classic calculation in two ways. First, the price source passes through an optional adaptive filter before the momentum is calculated. Nine filter types are available: None, SMA, EMA, RMA, Double WMA, Triple VWMA, HMA, LLAMA and Kalman.
FREE
Follow The Line MT5
Oliver Gideon Amofa Appiah
4.6 (35)
This indicator obeys the popular maxim that: "THE TREND IS YOUR FRIEND" It paints a GREEN line for BUY and also paints a RED line for SELL. (you can change the colors). It gives alarms and alerts of all kinds. IT DOES NOT REPAINT and can be used for all currency pairs and timeframes. Yes, as easy and simple as that. Even a newbie can use it to make great and reliable trades. NB: For best results, get my other premium indicators for more powerful and reliable signals. Get them here: https://www.m
FREE
Northstar Flow Candles MT5 is a free chart indicator for traders who use Heikin Ashi candles to review trend context. Its purpose is visual analysis, with candle states and optional markers on the MetaTrader 5 chart. This is a visual tool. It does not place trades or provide popup, push or email notifications. Chart context Five candle states: strong bullish, bullish, balanced, bearish and strong bearish. Context settings based on fast and slow exponential moving averages, ADX and ATR-normalize
FREE
Blahtech VWAP MT5
Blahtech Limited
5 (1)
Blahtech VWAP - Volume Weighted Average Price (VWAP) is the ratio of price to total volume. It provides an average price over a specified time interval.  Links [  Install  |  Update  |  Documentation   ] Feature Highlights Configurable VWAP Line Sessions, intervals, anchored or continuous Previous day settlement line Standard Deviation bands Alerts at bar close or real time Automatic Broker or Tick volumes Significantly reduced CPU usage Input Parameters Expert Advisor Mode  - Reserved for iCu
FREE
"Dominate the charts with cold, calculated precision. Servo Momentum Scalper strips away market noise to deliver raw, high-probability entry triggers. This isn't just an indicator; it’s your tactical advantage in a volatile market. Built for the relentless, designed for those who refuse to lose. Stop chasing the trend—capture it the moment it births. Download now and rewrite your trading reality." NEW: Want to automate this strategy? Check out my ServoSignal Pro EA on my MQL5 profile. Try th
FREE
This Mt5 Indicator Signals when there is two opposite direction bars engulfed by current bar.  has a recent Exponential Moving Average Cross and past bar was oversold/bought Expert Advisor Available in Comments  Free Version Here : https://www.mql5.com/en/market/product/110114?source=Site&nbsp ; Full Alerts for mt5 terminal , phone , email, print to file, print to journal  Buy Signal ( blue line ) Past ema cross ( set at 30 bars back ) Past bar rsi is oversold ( level 40  ) Engulfing bar closes
FREE
Trend ADX
Smaylle Rafael Coelho Mariano
The   Trend ADX   is a specialized implementation of the Average Directional Index (ADX) that focuses on identifying and confirming market trends. By utilizing ADX along with its directional indicators, Trend ADX helps traders pinpoint the strength of a trend and make informed trading decisions. Key Features of Trend ADX Strength Measurement : The Trend ADX quantifies the strength of a trend, allowing traders to determine whether to enter or exit positions based on trend momentum. Direction Indi
FREE
# Power Assisted Trend Following Indicator ## Overview The PowerIndicator is an implementation of the "Power Assisted Trend Following" methodology developed by Dr. Andreas A. Aigner and Walter Schrabmair. This indicator builds upon and improves J. Welles Wilder's trend following concepts by applying principles from signal analysis to financial markets. The core insight of this indicator is that successful trend following requires price movements to exceed a certain threshold (typically a mul
FREE
ThreePointsChannelFree
Dimitr Trifonov
5 (1)
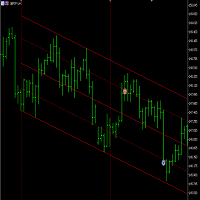
This is a free version of the indicator, the period between the vertical lines is always 30 bars. In the paid version the period can be set by user, so a configuration with many ThreePointsChannel indicators with different periods is possible. The principle of construction - on top of any number of bars set by the user, a channel is constructed with maximum and minimum lines so that the bars touch the maximum and minimum of the channel at exactly three points. The name of the indicator follows
FREE
Are you tired of drawing trendlines every time you're analyzing charts? Or perhaps you would like more consistency in your technical analysis. Then this is for you. This indicator will draw trend lines automatically when dropped on a chart. How it works Works similar to standard deviation channel found on mt4 and mt5. It has 2 parameters: 1. Starting Bar 2. Number of bars for calculation The   starting bar   is the bar which drawing of the trend lines will begin, while the   number of bars for c
FREE
Mitimom
Danil Poletavkin
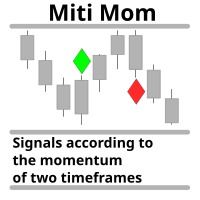
The indicator is based on Robert Miner's methodology described in his book "High probability trading strategies" and displays signals along with momentum of 2 timeframes. A Stochastic oscillator is used as a momentum indicator. The settings speak for themselves period_1 is the current timeframe, 'current' period_2 is indicated - the senior timeframe is 4 or 5 times larger than the current one. For example, if the current one is 5 minutes, then the older one will be 20 minutes The rest of the s
FREE
Multi-timeframe trend indicator based on the ADX / ADXWilder indicator with Fibonacci levels The indicator shows trend areas using ADX or ADXWilder indicator data from multiple timeframes. The impulse mode of the indicator allows you to catch the beginning of a trend, and several "Screens" with different timeframes allow you to filter out market noise. Fibonacci levels are added to the price chart, which have flexible settings. How the indicator works: if PDI is greater than NDI, then   it`s
FREE
Stoch RSI Band Fill è un indicatore Stochastic RSI per MetaTrader 5. MT5 non include uno Stoch RSI integrato, quindi questo indicatore lo aggiunge. Segue gli stessi passaggi di calcolo dello Stoch RSI integrato di TradingView e ne riprende il layout: linee K e D, livelli 80 / 50 / 20 e una banda ombreggiata tra il livello superiore e quello inferiore. Calcolo passo per passo 1. RSI del prezzo selezionato (predefinito: close, periodo 14), smussato con il metodo di Wilder (RMA). La prima media è
FREE
Liquidity Grab X — Liquidity Sweep & Grab Detector (MT5) Full Description Liquidity Grab X is a free rule-based indicator for MetaTrader 4 and MetaTrader 5 that identifies liquidity grabs — moments where price sweeps above a prior swing high or below a prior swing low, triggers resting stop orders, and then rejects back into range. These sweeps are commonly used by price-action and smart-money-concept (SMC) traders as a sign of exhaustion or a potential reversal trigger. How It Works Pivot Detec
FREE
Bosenic TrendCandles
Puguh Andrie Setia Aji
Bosenic V1 Trend Candles Bosenic V1 Trend Candles is a lightweight MT5 chart indicator designed to visually display the trend condition used by the Bosenic V1 trading system. Instead of using a separate trend calculation, the indicator applies the same baseline calculation used by the EA. This allows traders to see the underlying bullish or bearish condition directly on the main price chart. How It Works The indicator calculates EMA values separately from the Open, High, Low, and Close prices us
FREE
Astra BB RSI Arrows — indicatore visivo per segnali di trading precisi basato su Bande di Bollinger e RSI Astra BB RSI Arrows è stato creato per i trader che cercano uno strumento chiaro, ordinato e rapido per individuare potenziali punti di ingresso e di uscita dal mercato. L’indicatore combina due strumenti ampiamente utilizzati nell’analisi tecnica: le Bande di Bollinger e l’RSI. Invece di passare continuamente da una finestra all’altra e controllare manualmente incroci, zone di ipercomprato
FREE
Bollinger Bands B
Flavio Javier Jarabeck
4.5 (6)
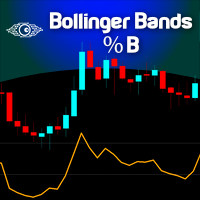
John Bollinger created this indicator in 2010 as a way to read the original indicator (Bollinger Bands) in a more "technical" way, shown as an oscillator. The typical range of the Bollinger Bands %B is 0 - 0.5 - 1.0, where "0" represents the lower band, the "0.5" the middle band, and "1" the upper band. The line on the indicator represents the Closing prices. As simple as that. SETTINGS Bollinger Bands period of analysis Standard Deviation multiplier Shift Price type to be analyzed If you like
FREE
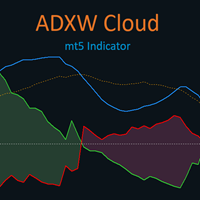
ADXW Cloud
Shahabeddin Baset
4.63 (8)
This is Wilder's ADX with cloud presentation of DI+ & DI- lines. Features 4 standard lines of the ADX indicator: DI+, DI-, ADX, ADXR cloud presentation of DI+/DI- lines with transparent colors applicable to all time-frames and all markets What Is ADX J. Welles Wilder Jr., the developer of well-known indicators such as RSI, ATR, and Parabolic SAR, believed that the Directional Movement System, which is partially implemented in ADX indicator, was his most satisfying achievement. In his 1978 book,
FREE
Goldcrest Indicator — Free Gold Trading Signals for MetaTrader 5 Engineered for Gold. Built for Precision. Goldcrest Indicator is a free, powerful, and easy-to-use MetaTrader 5 indicator designed to help traders identify potential trading opportunities in the gold market (XAUUSD). Built using the proprietary Goldcrest signal-detection framework, the indicator monitors market conditions and displays clear BUY and SELL signals with entry prices and initial SL references directly on your chart , he
FREE
Revolution martingale
Yaroslav Varankin
5 (3)
Revolution Martingale is an indicator designed for trading binary options on the M5 timeframe. Features: M5 Timeframe: It is recommended to use the indicator on the M5 timeframe for optimal trading. Trade Entry: Trades should only be opened on the first candle after a signal appears. Signals: A blue diamond indicates a buying opportunity for upward movement, while a red diamond indicates a buying opportunity for downward movement. Configured for Effective Binary Options Trading: The indicator i
FREE
Super Trend Strategy
Minh Khoa Nguyen
4.5 (4)
The SuperTrend Strategy is a widely-used technical indicator based on the Average True Range (ATR), primarily employed as a trailing stop tool to identify prevailing market trends. The indicator is designed for ease of use while providing reliable insights into the current market trend. It operates based on two key parameters: the period and the multiplier . By default, it uses a period of 15  for the ATR calculation and a multiplier of 3 . The Average True Range (ATR) plays a crucial role in th
FREE
Dual RSI
Paul Conrad Carlson
3.5 (2)
Indicator alerts for Dual Relative strength index rsi. Large rsi preset at 14 is below 30 small rsi preset at 4 is below 10 for buy bullish signals . Large rsi preset are 14 is above 70 small rsi preset at 4 is above 90 for sell bearish signals . Includes mobile and terminal alerts. draws lines when alerts. This indicator can help identify extremes and then the tops or bottoms of those extremes .
FREE
LongTerm
Edoardo Centorame
5 (1)
LongTerm è un indicatore di analisi direzionale progettato per interpretare la forza e la qualità del trend di medio lungo periodo, con un focus specifico sull’analisi long oriented. Non è un indicatore di ingresso né di timing operativo, ma uno strumento pensato per aiutare il trader a comprendere quando il mercato offre condizioni favorevoli o sfavorevoli per il trend long, riducendo il rumore tipico delle oscillazioni di breve periodo. Obiettivi LongTerm nasce per: identificare trend long for
FREE
DoubleRSI Signal
Florian Pierre Bonnet
DoubleRSI — Dual RSI Crossover Indicator with Signal Filters Description DoubleRSI displays two RSI lines with configurable periods on a separate window and generates buy/sell signals based on crossovers between the two RSI lines within defined price zones. How it works A buy signal is generated when the short RSI crosses above the long RSI while the long RSI is within the configured buy zone (default 50-70). A sell signal is generated when the short RSI crosses below the long RSI while the long
FREE
Medias Ema
Jean Charles Vilhena Maia
3EMA — Tre Medie Mobili per MetaTrader 5 3EMA riunisce tre medie mobili in un unico indicatore, con periodi iniziali di 13, 20 e 200. Uno strumento visivo per osservare la direzione delle medie, i loro incroci e la posizione del prezzo rispetto a diversi riferimenti di tendenza. Caratteristiche: • Tre medie mobili direttamente sul grafico. • Periodi regolabili individualmente. • Metodo selezionabile: semplice, esponenziale, smussato o ponderato lineare. • Il metodo selezionato si applica a t
FREE
Trend MACD Candles
Claus Dietrich
4 (2)
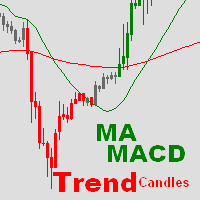
COLORED TREND MA / MACD CANDLES draw MA Candles above/below Moving Average draw MACD Candles above and below 0 and Signal-Line Your  Advantage: a simple view of the trend direction a simple view over the higher trend direction a calmer chart for the eye clear rules can be defined Settings: Value Quick-Set : pre-Settings MACD 3 / 9 / 6 MACD customize MA Candles Fast EMA : 12 Slow EMA : 26 MACD SMA : 9 1. MA Period : default 14 and 20, which are my favorite for all timeframes, I believe in the 14
FREE
This indicator is a zero-lag indicator and displays  strength of trend change . True Trend  Oscillator Pro works best in combination with True Trend Moving Average Pro that displays exact trend as is. Oscillator value is exact price change in given direction of the trend. True Trend Moving Average Pro: https://www.mql5.com/en/market/product/103586 If you set PERIOD input parameter to 1 this indicator becomes a sharpshooter for binary options. Developers can use True Trend Oscillator in Exper
FREE
Gli utenti di questo prodotto hanno anche acquistato
Trend Sniper X
Sarvarbek Abduvoxobov
4.86 (44)
Trend Sniper X è un indicatore trend-following multi-timeframe per MetaTrader 5 che aiuta i trader a identificare la direzione del trend e i potenziali punti di inversione con chiarezza e precisione. per MT4: https://www.mql5.com/en/market/product/193245 Informazioni sul prezzo: Il prezzo attuale è promozionale ed è soggetto a modifiche con il rilascio di futuri aggiornamenti e nuove funzionalità. Offerta Bonus: Per ricevere GRATIS l'Auto-Trade Assistant EA per questo indicatore, invia un messa
Un nuovo Re in città - Indicatore + Gestione ordini (TP1 + TP2 + TP3) + Invio opzionale di segnali Telegram INCLUSO (GRATIS) (SISTEMA COMPLETO DI TRADING e SEGNALI) Il nostro miglior EA per l’Oro: Gold Slayer Questo indicatore include una strategia avanzata, un sistema di trading con gestione ordini personalizzabile e un sistema mean reversion che combina estensioni di envelope, supportato da molteplici filtri intelligenti di conferma come RSI per individuare ingressi di inversione ad alta proba
Smart Trend Trading System — MetaTrader 5 Dopo l'acquisto, inviami un messaggio su MQL5 per ricevere GRATUITAMENTE Smart Universal Expert Advisor, insieme al corso online, al manuale PDF e all'accesso al gruppo privato. STTS riunisce la direzione del trend, i segnali di entrata e uscita, le zone di inversione e i livelli di prezzo importanti direttamente sul grafico. Segui il sistema manualmente oppure collega un EA compatibile separato per eseguire le operazioni automaticamente con le impostazi
Entry Points Pro vi mostra dove entrare, dove mettere lo stop e con quale lotto operare — prima di piazzare l'ordine. PREZZO Ora 199 USD: 8 copie a questo prezzo, poi 249 USD. Il prezzo finale è di 349 USD. Guadagno facendo trading sui mercati e lo dimostro, quindi non ho bisogno di vendere questo indicatore a tutti. È uno strumento per trader che ragionano con la propria testa, non un pulsante magico. Nessuna rottura, nessun trade. Una freccia grigia è un segnale annullato: il prezzo non ha ro
M5 Sniper
MeanFX
5 (4)
Porta il tuo vantaggio nel trading sotto i riflettori! M5 Sniper è un nuovo indicatore di MeanFX. Combina segnali di trading precisi con livelli TP/SL adattivi , creando così le migliori operazioni statistiche possibili! Il prezzo aumenta ogni 5 acquisti, il prossimo prezzo è di 69$ Scrivimi dopo l'acquisto per ricevere consigli/guida e un EA bonus Cosa lo rende diverso? Performance statistica comprovata su Gold XAUUSD ( funziona su quasi ogni asset , concentrandosi sulla padronanza di un singol
Zoryk Gold
Reda El Koutbane
4.79 (19)
ZORYK — Sistema avanzato di segnali XAUUSD per MetaTrader 5 Conosci sicuramente questa sensazione. Passi molto tempo ad analizzare l’oro. Aspetti il punto d’ingresso corretto. Finalmente apri l’operazione e il prezzo inizia immediatamente a muoversi contro di te. Chiudi troppo presto, sposti lo Stop Loss o esiti per alcuni secondi. Successivamente il mercato raggiunge esattamente l’obiettivo che avevi previsto inizialmente, ma senza di te nella posizione. Il problema non era sempre la direzione.
Ultra Indicator
Ihor Otkydach
5 (1)
ULTRA è un indicatore tecnico che funziona secondo un approccio “tutto in uno”: analizza autonomamente il mercato, genera segnali di trading, visualizza i livelli per l’impostazione degli ordini stop-loss e suggerisce quando chiudere le operazioni per realizzare profitti o ridurre al minimo le perdite. In altre parole, non importa se non sai come analizzare il mercato, determinare i livelli — dove impostare lo stop-loss — o se hai difficoltà con la gestione del capitale. ULTRA farà tutto questo
Gann Made Easy è un sistema di trading Forex professionale e facile da usare che si basa sui migliori principi del trading utilizzando la teoria di mr. WD Gann. L'indicatore fornisce segnali ACQUISTA e VENDI accurati, inclusi i livelli di Stop Loss e Take Profit. Puoi fare trading anche in movimento utilizzando le notifiche PUSH. CONTATTAMI DOPO L'ACQUISTO PER RICEVERE GRATUITAMENTE LE ISTRUZIONI DI TRADING E OTTIMI INDICATORI EXTRA! Probabilmente hai già sentito parlare molte volte dei metodi d
SuperScalp Pro
Van Minh Nguyen
4.54 (37)
SuperScalp Pro - Professional Multi-Layer Confluence Scalping System SuperScalp Pro è un indicatore di scalping avanzato che potenzia il Supertrend classico con diversi filtri intelligenti di conferma. Aiuta a individuare opportunità di trading Buy/Sell con una maggiore probabilità di successo, riducendo significativamente i falsi segnali. Le frecce Buy e Sell vengono visualizzate chiaramente direttamente sul grafico, insieme ai livelli di Stop Loss e Take Profit basati sull’ATR, calcolati autom
SMC Intraday Formula
VividMind Digital Solutions
5 (26)
Cominciamo con la verità. Nessun indicatore da solo ti renderà profittevole. Se qualcuno ti dice il contrario, ti sta vendendo un sogno. Qualsiasi indicatore che mostra frecce perfette di acquisto/vendita può essere reso impeccabile — basta ingrandire la giusta sezione della storia e catturare solo i trade vincenti. Noi non lo facciamo.  SMC Intraday Formula è uno strumento. Legge la struttura del mercato per te, identifica le zone a più alta probabilità e ti mostra esattamente come appare la t
GoldenX Entry MT5
VividMind Digital Solutions
5 (17)
GoldenX Entry è un indicatore per MT5 con un algoritmo adattivo Smart Entry Trend, un sistema di scoring dei segnali, un rilevatore del regime di mercato e un filtro di volatilità. Ogni segnale include un livello di ingresso calcolato, tre livelli di Take-Profit (TP1, TP2, TP3) e un livello di Stop-Loss. È costruito su più livelli analitici progettati per adattarsi a diverse condizioni di mercato, combinando un sistema analitico multilivello con un ottimizzatore integrato e un sistema di traccia
Gold Trend Coach MT5
Cristhian Alexander Gaibor Cuasquer
4.27 (11)
Segnali di acquisto e vendita senza repaint sull'oro (XAUUSD) per MetaTrader 5. Ogni segnale arriva con stop loss e tre take profit. Un filtro Smart Money Concepts con BOS e CHoCH, così operi a favore della struttura, non contro. Un Mentor live sul pannello che ti guida passo dopo passo dall'ingresso fino al TP3. E alert direttamente sul tuo telefono e sul tuo canale Telegram. Questo è Gold Trend Coach. Mai più da solo davanti al grafico. KIT ACQUIRENTE GRATIS con il tuo acquisto: 1. Telegram A
Boba Analysis Suite
Trade Ready Solutions LLC
5 (2)
Boba Analysis Suite Boba Analysis Suite è un indicatore di analisi per MetaTrader 5. Riunisce la struttura del mercato, le zone di prezzo rilevanti e il contesto generale del mercato in un’unica visualizzazione del grafico. Sviluppato sulla base dell’esperienza pratica come trader e formatore di trading, supporta un processo di analisi strutturato: valutare la direzione del mercato, individuare livelli importanti e analizzare congiuntamente più intervalli temporali. Analisi nel contesto del merc
FX Power MT5 NG
Daniel Stein
5 (33)
FX Power: Analizza la Forza delle Valute per Decisioni di Trading Più Intelligenti Panoramica FX Power è lo strumento essenziale per comprendere la reale forza delle principali valute e dell'oro in qualsiasi condizione di mercato. Identificando le valute forti da comprare e quelle deboli da vendere, FX Power semplifica le decisioni di trading e rivela opportunità ad alta probabilità. Che tu segua le tendenze o anticipi inversioni utilizzando valori estremi di Delta, questo strumento si adatta
Azimuth Pro
Ottaviano De Cicco
5 (7)
Azimuth Pro V2: Synthetic Fractal Structure and Confirmed Entries for MT5 Overview Azimuth Pro is a multi-level swing structure indicator by Merkava Labs . Four nested swing layers, swing-anchored VWAP, ABC pattern detection, three-timeframe structural filtering, and closed-bar confirmed entries — one chart, one workflow from micro-swings to macro-cycles. This is not a blind signal product. It is a structure-first workflow for traders who care about location, context, and timing. 1. What Change
FiboSniper Pro
Van Minh Nguyen
5 (4)
FiboSniper Pro – Multi-Filter Fibonacci System with Auto SL/TP and Control Panel FiboSniper Pro è un indicatore tecnico che combina Fibonacci Envelopes dinamici con diversi filtri di conferma per generare segnali Buy e Sell selezionati. I livelli di Fibonacci vengono calcolati sulla base di Moving Average e ATR e successivamente filtrati tramite ADX, EMA, RSI, ATR, Volume, Time e struttura delle candele. L’indicatore visualizza direttamente sul grafico i livelli automatici di Stop Loss e Take Pr
Gold Entry Sniper
Tahir Mehmood
5 (23)
Gold Entry Sniper – Dashboard ATR Multi-Timeframe per Scalping e Swing Trading sull’Oro Gold Entry Sniper è un indicatore avanzato per MetaTrader 5 che offre segnali di acquisto/vendita precisi per XAUUSD e altri strumenti, basato sulla logica ATR Trailing Stop e l' analisi multi-timeframe . Caratteristiche e Vantaggi Analisi Multi-Timeframe – Visualizza trend su M1, M5, M15 in un'unica dashboard. Trailing Stop Basato su ATR – Stop dinamici che si adattano alla volatilità. Dashboard Professional
M1 Sniper MT5
Oleg Rodin
5 (7)
M1 SNIPER   è un sistema di indicatori di trading facile da usare. Si tratta di un indicatore a freccia progettato per l'intervallo temporale M1. L'indicatore può essere utilizzato come sistema autonomo per lo scalping sull'intervallo temporale M1 e come parte del tuo sistema di trading esistente. Sebbene questo sistema di trading sia stato progettato specificamente per il trading sull'intervallo temporale M1, può comunque essere utilizzato anche con altri intervalli temporali. Inizialmente ho p
Apex Patterns PRO Acquista l'indicatore - Ottieni GRATUITAMENTE l'Expert Advisor basato su di esso. Intelligenza auto-ottimizzante per pattern grafici e breakout Gli scanner di pattern tradizionali si basano su input fissi, registrando spesso prestazioni inferiori quando la volatilità e le strutture del mercato cambiano. Apex Patterns PRO è progettato per adattarsi alle mutevoli condizioni di mercato combinando il riconoscimento dei pattern grafici strutturali, il filtraggio del momentum e l'au
SQN Max indicator for MT5 by ITC
Renaud Herve Francois Candel
Sqn Max Indicator Sqn Max is an exclusive indicator to trade the market with high effectiveness. The indicator is based on price action, volatility and trend. This indicator is as simple as possible but not too simple. The indicator can generate alerts to ease the trading process. You don't have to stay all day in front of your screen. The indicator can be used with any class of assets and with any time frame. It is possible to achieve better results trading our list of selected assets. We achi
Adaptive Price Action Engine Acquista un indicatore, ricevi l'EA gratis Analisi Auto-Ottimizzata del Trend e dei Pattern Candlestick Multi-Timeframe I mercati cambiano continuamente e non tutti i pattern di Price Action hanno lo stesso valore in ogni condizione di mercato. Adaptive Price Action Engine è progettato per adattarsi alle condizioni di mercato in continua evoluzione, combinando struttura del trend, analisi Multi-Timeframe, pattern Candlestick e ottimizzazione statistica in un unico fr
Atomic Analyst MT5
Issam Kassas
4.51 (65)
Atomic Analyst — MetaTrader 5 Dopo l'acquisto, inviami un messaggio su MQL5 per ricevere GRATUITAMENTE Smart Universal Expert Advisor, insieme al corso online, al manuale PDF e all'accesso al gruppo privato. Atomic Analyst riunisce l’azione del prezzo, la direzione del trend, i segnali di entrata e uscita, lo Stop Loss e diversi livelli di Take Profit direttamente sul grafico. INDIVIDUA IL SEGNALE. COMPRENDI IL CONTESTO OPERATIVO. Atomic Analyst organizza la sua analisi in informazioni visive ch
Prossimo aggiornamento — Versione 2.52 in arrivo! [NOVITÀ] Preparati a 4 nuove funzionalità principali progettate per migliorare la tua analisi di mercato e il tuo flusso di lavoro nel trading Portiamo l’analisi di mercato a un livello superiore con 4 nuove funzionalità progettate per soddisfare le tue esigenze di trading. Ecco le novità: 1. TRADE OVERVIEW DASHBOARD 2. CONFLUENCE AT ZONE 3. STRONG & WEAK HIGH/LOW 4. OTE 1. TRADE OVERVIEW DASHBOARD Una dashboard che ti aiuta a comprendere più fa
Divergence Bomber
Ihor Otkydach
4.89 (94)
Ogni acquirente dell’indicatore riceverà inoltre gratuitamente: L’utilità esclusiva “Bomber Utility”, che gestisce automaticamente ogni operazione, imposta i livelli di Stop Loss e Take Profit e chiude le posizioni secondo le regole della strategia I file di configurazione (set file) per adattare l’indicatore a diversi asset I set file per configurare il Bomber Utility in tre modalità: “Rischio Minimo”, “Rischio Bilanciato” e “Strategia di Attesa” Una guida video passo-passo per installare, con
Tokyo mt5 Indicator
Vasiliy Strukov
5 (15)
Il Tokyo Indicator offre una chiara panoramica visiva della direzione del trend, dei potenziali segnali di trading e delle condizioni di mercato. La sua linea di trend a gradini, codificata a colori, distingue le fasi rialziste (in blu) da quelle ribassiste (in magenta). Frecce direzionali dedicate evidenziano potenziali opportunità di acquisto e vendita al variare del trend visualizzato. Una dashboard integrata riunisce in un'unica visualizzazione pratica il segnale corrente, il bias di mercato
Power Candles MT5
Daniel Stein
4.58 (12)
Power Candles V3 - Indicatore di forza ad ottimizzazione automatica Power Candles V3 trasforma la forza delle valute e degli strumenti in un piano di trading attuabile su ogni grafico a cui è collegato. Invece di limitarsi a colorare le candele, esegue un'auto-ottimizzazione in tempo reale in background e ti fornisce i migliori valori di Stop Loss, Take Profit e soglia di segnale per il simbolo che hai davanti. Basta un clic per adottarlo nel trading live: i raggi di ingresso, Stop Loss e Take P
Currency Strength Wizard   è un indicatore molto potente che ti fornisce una soluzione all-in-one per un trading di successo. L'indicatore calcola la potenza di questa o quella coppia forex utilizzando i dati di tutte le valute su più intervalli di tempo. Questi dati sono rappresentati in una forma di indice di valuta facile da usare e linee elettriche di valuta che puoi utilizzare per vedere il potere di questa o quella valuta. Tutto ciò di cui hai bisogno è collegare l'indicatore al grafico ch
Naked Forex Tweezer Pro Indicator Tweezer Pro Indicator is a pattern recognition indicator for Forex, Stocks, Indices, Futures, Commodities and Cryptos. The standard Tweezer is a two bar pattern. Our enhanced version is a multi-bar pattern. We filter the patterns for you so that you only get the     best and most effective patterns   and ignore the noise. The Tweezer pattern is a simple and effective pattern to trade. The strategy that comes with the Tweezer is based on price action. The Twe
Auto Optimized SpeedAngle è un sistema di vettorizzazione del momento di livello istituzionale che elimina l'overfitting ( curve-fitting ) attraverso l'ottimizzazione continua Walk-Forward (WFO). Invece di affidarsi a input statici che si degradano quando i regimi di mercato cambiano, l'indicatore recalibra dinamicamente i suoi parametri utilizzando la validazione Out-of-Sample (OOS), assicurando che i segnali visualizzati rappresentino reali vantaggi statistici anziché anomalie storiche. Quadro
Smc Pro ToolKit
Talal N Z Aljarusha
5 (13)
SMC PRO TOOLKIT — SMART MONEY ANALYSIS & STRUCTURED TRADE PLANNING SMC Pro ToolKit is a professional Smart Money Concepts analysis workspace for MetaTrader 5. It combines market structure, multi-timeframe analysis, institutional price zones, setup evaluation, confirmation tools, volume context, alerts, and risk planning inside one organized chart environment. One workspace. Multiple layers of confirmation. One structured trading plan. OPEN COMPLETE USER GUIDE MULTI-CONDITION SETUP ENGINE At
Altri dall’autore
QCL Structure Trail for MetaTrader 5 QCL Structure Trail combines confirmed market structure breaks with an ATR-based trailing line to help traders follow directional moves and monitor changing market conditions directly on the price chart. Its clear display includes a color-changing trailing line and optional signal arrows, keeping the chart focused on price action. How It Works The indicator identifies confirmed swing highs and swing lows using the selected Pivot Confirmation Length. A bullish
FREE
QCL Momentum Candles — MT5 See momentum changes through a clear, candle-based oscillator. QCL Momentum Candles converts smoothed Stochastic RSI values into synthetic momentum candles in a separate indicator window. Green and red candles help you follow shifts in momentum, while a centered scale and highlighted extreme zones provide context for your chart analysis. Main Features Synthetic momentum candles: View oscillator movements as candle bodies and wicks. Directional colors: Green candles ind
FREE
QCL Market Structure Zones is a chart-based analytical indicator for identifying confirmed swing points, supply and demand zones, and breaks of market structure. The indicator uses confirmed swing highs and swing lows to create volatility-adjusted zones. Zone height and overlap filtering are calculated using the Average True Range, allowing the indicator to adapt to different symbols and timeframes. Main features Confirmed swing high and swing low detection Automatic supply and demand zones Aver
FREE
RSI Flow Candles MT5 QCL RSI Flow Candles transforms RSI momentum into smoothed Heikin Ashi-style candles in a separate indicator window. Its candle structure, adaptive trend line and reference zones help traders assess momentum direction, pullbacks and transitions within a familiar 0–100 oscillator scale. Key Features RSI-based candles: View momentum through candle bodies and wicks instead of a conventional RSI line. Directional colors: Green candles indicate that the oscillator close is at or
FREE
QCL Market Structure Zones is a free market structure indicator for MetaTrader 4. It identifies confirmed swing points, creates volatility-adjusted supply and demand zones, and marks Break of Structure events directly on the price chart. The indicator can also display Higher High, Lower High, Higher Low, and Lower Low labels together with an optional pivot-based ZigZag. It is designed for visual market analysis and does not open, modify, or close trades. Main Features Confirmed swing high and sw
FREE
QCL Structure Trail for MetaTrader 4 QCL Structure Trail combines confirmed market structure breaks with a volatility-based trailing line. It helps traders identify directional changes and follow price movements through a clear display directly on the chart. How It Works The indicator identifies confirmed swing highs and swing lows using the selected Pivot Confirmation Length. A bullish signal appears when the closing price crosses above the latest confirmed swing high. A bearish signal appears
FREE
QCL Bollinger Trend Trail Follow trend direction with a clear, adaptive line directly on your price chart. QCL Bollinger Trend Trail combines trend detection with integrated volatility filtering to display a trailing reference line. Its two-color presentation helps you identify rising, falling, and unchanged trend conditions without adding a separate indicator window. The line advances as the trend develops and holds its position when conditions do not support further movement. Key Features Adap
FREE
QCL Dynamic RSI Zones — MetaTrader 4 QCL Dynamic RSI Zones combines a smoothed RSI signal with adaptive boundaries to help you assess momentum relative to recent market conditions. Instead of relying on fixed overbought and oversold levels, the indicator adjusts its zones using recent RSI behavior. A dynamic balance line, a color-changing signal, and excursion columns display momentum conditions in a separate chart window. Key Features Adaptive boundaries: Upper and lower zones respond to recent
FREE
QCL Adaptive Band Oscillator — MetaTrader 5 A smooth 0–100 oscillator with adaptive reference bands for a clearer view of price momentum. QCL Adaptive Band Oscillator combines smoothed price calculations with dynamic upper and lower reference bands. Displayed in a separate indicator window, it helps you examine momentum swings, potential turning points, and divergences between price and the oscillator. A smooth transformation keeps the oscillator and both reference bands within the 0–100 range ,
FREE
QCL RSI Flow Candles — MetaTrader 4 QCL RSI Flow Candles transforms RSI momentum into smoothed Heikin Ashi-style candles in a separate indicator window. Candle bodies, wicks, a directional trend line and reference zones provide a visual framework for assessing momentum, pullbacks and changing conditions. Key Features RSI-based candles: View momentum through candle structure instead of a conventional RSI line. Directional colors: Green candles indicate that the oscillator close is at or above its
FREE
QCL Bollinger Trend Trail — MT4 Track trend direction with an adaptive trailing line directly on your MetaTrader 4 chart. QCL Bollinger Trend Trail combines trend detection with integrated volatility filtering to provide a clear visual reference alongside price action. Its two-color line advances as a trend develops and holds its position when conditions do not support further movement. Key Features Adaptive trailing line: Follows developing price movements. Directional colors: Distinguishes upw
FREE
QCL Adaptive Band Oscillator — MetaTrader 4 A smooth 0–100 oscillator with adaptive reference bands for a clearer view of price momentum. QCL Adaptive Band Oscillator combines smoothed price calculations with dynamic upper and lower bands. Displayed in a separate indicator window, it helps you examine momentum swings, potential turning points, and divergences between price and the oscillator. A smooth transformation keeps the oscillator and both bands within the 0–100 range , with a center refer
FREE
QCL Clouds MT4
Ahmadreza Najafi
QCL Clouds for MetaTrader 4 is an adaptive market-regime indicator designed to display trend direction, momentum transitions, and dynamic price zones in a clean and practical format. The indicator combines its internal calculations into color-changing signal-line segments, crossover dots, and a projected market cloud. The simplified presentation helps traders identify directional changes without placing multiple overlapping lines on the chart. HOW TO READ QCL CLOUDS • Blue Signal Line Indicates
QCL Clouds MT5
Ahmadreza Najafi
QCL Clouds is an adaptive market-regime indicator designed to present trend direction, momentum transitions, and dynamic price zones in a clean and easy-to-read format. Instead of displaying multiple overlapping lines, the indicator combines its calculations into one color-changing signal line, crossover dots, and a projected market cloud. HOW TO READ QCL CLOUDS • Blue Signal Line Indicates that bullish conditions are currently dominant. • Orange Signal Line Indicates that bearish conditions are
Filtro:
Nessuna recensione
Rispondi alla recensione