QCL Dynamic RSI Zones MT5

QCL Dynamic RSI Zones — MetaTrader 5

QCL Dynamic RSI Zones combines a smoothed RSI signal with adaptive boundaries to help you assess momentum in the context of recent market conditions.

Instead of relying on fixed overbought and oversold levels, the indicator adjusts its zones using recent RSI behavior. A dynamic balance line, a color-changing signal, and excursion columns provide a clear view of momentum shifts in a separate chart window.

Key Features

  • Adaptive zones: Upper and lower boundaries respond to recent RSI conditions.

  • Smoothed signal: Reduces short-term fluctuations for easier visual interpretation.

  • Dynamic balance line: Provides a reference for assessing relative momentum.

  • Color-coded momentum: The signal is green above the balance line and red at or below it.

  • Excursion columns: Highlight movement beyond the adaptive boundaries.

  • Customizable appearance: Adjust plot colors, styles, and widths through the Colors tab.

  • Flexible application: Use on different symbols and chart timeframes when sufficient history is available.

Reading the Indicator

A signal above the balance line indicates stronger relative momentum. A signal below it indicates weaker relative momentum.

Movement above the upper boundary highlights an upward momentum excursion. Movement below the lower boundary highlights a downward excursion. These conditions can help you evaluate momentum expansion, pullbacks, and potential exhaustion alongside price structure.

An excursion does not automatically mean that price will reverse. Strong momentum can remain outside a zone for several bars. The adaptive boundaries may also overlap during compressed RSI conditions.

Inputs

  • Length — Default: 14: Controls the underlying calculation length. Lower values increase responsiveness; higher values provide more smoothing.

  • Window — Default: 60: Sets the historical window used to construct the adaptive zones.

  • Upper Factor — Default: 0.10: Adjusts the upper boundary.

  • Lower Factor — Default: 0.10: Adjusts the lower boundary.

Designed for Discretionary Analysis

QCL Dynamic RSI Zones can complement trend analysis, support and resistance, and other trading methods. It is an analytical indicator and does not place or manage trades.

Values on the current candle update as prices change. For decisions based on completed bars, wait for the candle to close.

Platform: MetaTrader 5
Display: Separate indicator window
Developer: Quant Chart Lab


Produits recommandés
Indicateur professionnel affichant deux moyennes mobiles pondérées directement sur le graphique et détectant automatiquement les phases de marché sans momentum. WMA1 (prix d’ouverture) définit le biais de tendance. WMA2 (prix de clôture) confirme le momentum. Lorsque l’écart entre les deux WMAs se réduit, les bougies deviennent grises pour signaler un marché en range. Compatible avec tous les instruments et toutes les unités de temps. Passez à la version Pro La version Pro ajoute signaux d’ent
FREE
GDS Renko Pip ST Chart - Pip-Based Renko Chart Indicator for MetaTrader 5 GDS Renko Pip ST Chart is a pip-based Renko chart indicator for MetaTrader 5. It helps traders build and study cleaner Renko price movement using a practical fixed pip or point-based brick structure. This tool is designed as a Renko chart foundation for manual analysis. It does not predict the market, does not generate buy or sell signals and does not decide whether a trade should be opened. Renko EDGE EA Golden Delta | A
FREE
Auto Fibonacci
Ali Gokay Duman
5 (3)
This indicator calculates fibonacci levels via moving averages trend and draw these lines. You can change fast and slow Moving Averages settings for customization. Inputs: Fast MA Time Period :  64 Fast MA Shift: 0 Fast MA Method: Smoothed Fast MA Apply To: Median Price Slow MA Time Period: 32 Slow MA Shift: 0 Slow MA Method: Smoothed Slow MA Apply To: Median Price ZigZag: False ZigZag Color: Red ZigZag Type: DashDot ZigZag Width: VeryThin Fibo Settings TrendFibonacci: True FiboTrendColor: Black
FREE
Dual Period Filter — Adaptive Coppock Curve for MT5 Overview The Coppock Curve is built from the sum of a long and a short rate of change, smoothed afterwards, and is used to observe the direction and strength of medium-term momentum. This indicator extends the classic calculation in two ways. First, the price source passes through an optional adaptive filter before the momentum is calculated. Nine filter types are available: None, SMA, EMA, RMA, Double WMA, Triple VWMA, HMA, LLAMA and Kalman.
FREE
Follow The Line MT5
Oliver Gideon Amofa Appiah
4.6 (35)
This indicator obeys the popular maxim that: "THE TREND IS YOUR FRIEND" It paints a GREEN line for BUY and also paints a RED line for SELL. (you can change the colors). It gives alarms and alerts of all kinds. IT DOES NOT REPAINT and can be used for all currency pairs and timeframes. Yes, as easy and simple as that. Even a newbie can use it to make great and reliable trades. NB: For best results, get my other premium indicators for more powerful and reliable signals. Get them here: https://www.m
FREE
Northstar Flow Candles MT5 is a free chart indicator for traders who use Heikin Ashi candles to review trend context. Its purpose is visual analysis, with candle states and optional markers on the MetaTrader 5 chart. This is a visual tool. It does not place trades or provide popup, push or email notifications. Chart context Five candle states: strong bullish, bullish, balanced, bearish and strong bearish. Context settings based on fast and slow exponential moving averages, ADX and ATR-normalize
FREE
Blahtech VWAP MT5
Blahtech Limited
5 (1)
Blahtech VWAP - Volume Weighted Average Price (VWAP) is the ratio of price to total volume. It provides an average price over a specified time interval.  Links [  Install  |  Update  |  Documentation   ] Feature Highlights Configurable VWAP Line Sessions, intervals, anchored or continuous Previous day settlement line Standard Deviation bands Alerts at bar close or real time Automatic Broker or Tick volumes Significantly reduced CPU usage Input Parameters Expert Advisor Mode  - Reserved for iCu
FREE
"Dominate the charts with cold, calculated precision. Servo Momentum Scalper strips away market noise to deliver raw, high-probability entry triggers. This isn't just an indicator; it’s your tactical advantage in a volatile market. Built for the relentless, designed for those who refuse to lose. Stop chasing the trend—capture it the moment it births. Download now and rewrite your trading reality." NEW: Want to automate this strategy? Check out my ServoSignal Pro EA on my MQL5 profile. Try th
FREE
This Mt5 Indicator Signals when there is two opposite direction bars engulfed by current bar.  has a recent Exponential Moving Average Cross and past bar was oversold/bought Expert Advisor Available in Comments  Free Version Here : https://www.mql5.com/en/market/product/110114?source=Site&nbsp ; Full Alerts for mt5 terminal , phone , email, print to file, print to journal  Buy Signal ( blue line ) Past ema cross ( set at 30 bars back ) Past bar rsi is oversold ( level 40  ) Engulfing bar closes
FREE
Trend ADX
Smaylle Rafael Coelho Mariano
Le   Trend ADX   est une implémentation spécialisée de l'Average Directional Index (ADX) qui se concentre sur l'identification et la confirmation des tendances du marché. En utilisant l'ADX ainsi que ses indicateurs directionnels, le Trend ADX aide les traders à déterminer la force d'une tendance et à prendre des décisions éclairées. Caractéristiques Clés du Trend ADX Mesure de la Force   : Le Trend ADX quantifie la force d'une tendance, permettant aux traders de savoir quand entrer ou sortir de
FREE
# Power Assisted Trend Following Indicator ## Overview The PowerIndicator is an implementation of the "Power Assisted Trend Following" methodology developed by Dr. Andreas A. Aigner and Walter Schrabmair. This indicator builds upon and improves J. Welles Wilder's trend following concepts by applying principles from signal analysis to financial markets. The core insight of this indicator is that successful trend following requires price movements to exceed a certain threshold (typically a mul
FREE
This is a free version of the indicator, the period between the vertical lines is always 30 bars. In the paid version the period can be set by user, so a configuration with many ThreePointsChannel indicators with different periods is possible. The principle of construction - on top of any number of bars set by the user, a channel is constructed with maximum and minimum lines so that the bars touch the maximum and minimum of the channel at exactly three points. The name of the indicator follows
FREE
Are you tired of drawing trendlines every time you're analyzing charts? Or perhaps you would like more consistency in your technical analysis. Then this is for you. This indicator will draw trend lines automatically when dropped on a chart. How it works Works similar to standard deviation channel found on mt4 and mt5. It has 2 parameters: 1. Starting Bar 2. Number of bars for calculation The   starting bar   is the bar which drawing of the trend lines will begin, while the   number of bars for c
FREE
Mitimom
Danil Poletavkin
The indicator is based on Robert Miner's methodology described in his book "High probability trading strategies" and displays signals along with momentum of 2 timeframes. A Stochastic oscillator is used as a momentum indicator. The settings speak for themselves period_1 is the current timeframe, 'current' period_2 is indicated - the senior timeframe is 4 or 5 times larger than the current one. For example, if the current one is 5 minutes, then the older one will be 20 minutes The rest of the s
FREE
Multi-timeframe trend indicator based on the ADX / ADXWilder indicator with Fibonacci levels The indicator shows trend areas using ADX or ADXWilder indicator data from multiple timeframes. The impulse mode of the indicator allows you to catch the beginning of a trend, and several "Screens" with different timeframes allow you to filter out market noise. Fibonacci levels are added to the price chart, which have flexible settings. How the indicator works: if PDI is greater than NDI, then   it`s
FREE
Stoch RSI Band Fill est un indicateur Stochastic RSI pour MetaTrader 5. MT5 ne propose pas de Stoch RSI intégré : cet indicateur en ajoute un. Il suit les mêmes étapes de calcul que le Stoch RSI intégré de TradingView et reprend la même présentation : lignes K et D, niveaux 80 / 50 / 20 et bande ombrée entre les niveaux supérieur et inférieur. Calcul étape par étape 1. RSI du prix choisi (par défaut : close, période 14), lissé selon la méthode de Wilder (RMA). La première moyenne est la moyenne
FREE
Liquidity Grab X — Liquidity Sweep & Grab Detector (MT5) Full Description Liquidity Grab X is a free rule-based indicator for MetaTrader 4 and MetaTrader 5 that identifies liquidity grabs — moments where price sweeps above a prior swing high or below a prior swing low, triggers resting stop orders, and then rejects back into range. These sweeps are commonly used by price-action and smart-money-concept (SMC) traders as a sign of exhaustion or a potential reversal trigger. How It Works Pivot Detec
FREE
Bosenic TrendCandles
Puguh Andrie Setia Aji
Bosenic V1 Trend Candles Bosenic V1 Trend Candles is a lightweight MT5 chart indicator designed to visually display the trend condition used by the Bosenic V1 trading system. Instead of using a separate trend calculation, the indicator applies the same baseline calculation used by the EA. This allows traders to see the underlying bullish or bearish condition directly on the main price chart. How It Works The indicator calculates EMA values separately from the Open, High, Low, and Close prices us
FREE
Astra BB RSI Arrows — indicateur visuel de signaux de trading précis basé sur les Bandes de Bollinger et le RSI Astra BB RSI Arrows a été conçu pour les traders qui recherchent un outil clair, soigné et rapide permettant d’identifier des points d’entrée et de sortie potentiels sur le marché. L’indicateur combine deux concepts largement utilisés en analyse technique : les Bandes de Bollinger et le RSI. Au lieu de passer constamment d’une fenêtre à l’autre et de surveiller manuellement les croisem
FREE
Bollinger Bands B
Flavio Javier Jarabeck
4.5 (6)
John Bollinger created this indicator in 2010 as a way to read the original indicator (Bollinger Bands) in a more "technical" way, shown as an oscillator. The typical range of the Bollinger Bands %B is 0 - 0.5 - 1.0, where "0" represents the lower band, the "0.5" the middle band, and "1" the upper band. The line on the indicator represents the Closing prices. As simple as that. SETTINGS Bollinger Bands period of analysis Standard Deviation multiplier Shift Price type to be analyzed If you like
FREE
ADXW Cloud
Shahabeddin Baset
4.63 (8)
This is Wilder's ADX with cloud presentation of DI+ & DI- lines. Features 4 standard lines of the ADX indicator: DI+, DI-, ADX, ADXR cloud presentation of DI+/DI- lines with transparent colors applicable to all time-frames and all markets What Is ADX J. Welles Wilder Jr., the developer of well-known indicators such as RSI, ATR, and Parabolic SAR, believed that the Directional Movement System, which is partially implemented in ADX indicator, was his most satisfying achievement. In his 1978 book,
FREE
Goldcrest Indicator — Free Gold Trading Signals for MetaTrader 5 Engineered for Gold. Built for Precision. Goldcrest Indicator is a free, powerful, and easy-to-use MetaTrader 5 indicator designed to help traders identify potential trading opportunities in the gold market (XAUUSD). Built using the proprietary Goldcrest signal-detection framework, the indicator monitors market conditions and displays clear BUY and SELL signals with entry prices and initial SL references directly on your chart , he
FREE
Revolution martingale
Yaroslav Varankin
5 (3)
Revolution Martingale is an indicator designed for trading binary options on the M5 timeframe. Features: M5 Timeframe: It is recommended to use the indicator on the M5 timeframe for optimal trading. Trade Entry: Trades should only be opened on the first candle after a signal appears. Signals: A blue diamond indicates a buying opportunity for upward movement, while a red diamond indicates a buying opportunity for downward movement. Configured for Effective Binary Options Trading: The indicator i
FREE
Super Trend Strategy
Minh Khoa Nguyen
4.5 (4)
The SuperTrend Strategy is a widely-used technical indicator based on the Average True Range (ATR), primarily employed as a trailing stop tool to identify prevailing market trends. The indicator is designed for ease of use while providing reliable insights into the current market trend. It operates based on two key parameters: the period and the multiplier . By default, it uses a period of 15  for the ATR calculation and a multiplier of 3 . The Average True Range (ATR) plays a crucial role in th
FREE
Dual RSI
Paul Conrad Carlson
3.5 (2)
Indicator alerts for Dual Relative strength index rsi. Large rsi preset at 14 is below 30 small rsi preset at 4 is below 10 for buy bullish signals . Large rsi preset are 14 is above 70 small rsi preset at 4 is above 90 for sell bearish signals . Includes mobile and terminal alerts. draws lines when alerts. This indicator can help identify extremes and then the tops or bottoms of those extremes .
FREE
LongTerm
Edoardo Centorame
5 (1)
LongTerm est un indicateur d’analyse directionnelle conçu pour interpréter la force et la qualité du trend de moyen long terme, avec un focus spécifique sur l’analyse long oriented. Ce n’est pas un indicateur d’entrée ni de timing opérationnel, mais un outil pensé pour aider le trader à comprendre quand le marché offre des conditions favorables ou défavorables pour le long trend, en réduisant le bruit typique des oscillations de court terme. Objectifs LongTerm naît pour: identifier des long tren
FREE
DoubleRSI Signal
Florian Pierre Bonnet
DoubleRSI — Indicateur de Croisement Double RSI avec Filtres de Signal Description DoubleRSI affiche deux lignes RSI avec des périodes configurables dans une fenêtre séparée et génère des signaux d’achat/vente basés sur les croisements entre les deux lignes RSI à l’intérieur de zones de prix définies. Fonctionnement Un signal d’achat est généré lorsque le RSI court croise au-dessus du RSI long tandis que le RSI long se trouve dans la zone d’achat configurée (par défaut 50–70). Un signal de ven
FREE
Medias Ema
Jean Charles Vilhena Maia
3EMA — Trois Moyennes Mobiles pour MetaTrader 5 3EMA réunit trois moyennes mobiles dans un seul indicateur, avec des périodes initiales de 13, 20 et 200. Un outil visuel pour observer leur direction, leurs croisements et la position du prix par rapport à différents repères de tendance. Fonctionnalités : • Trois moyennes mobiles directement sur le graphique. • Périodes réglables individuellement. • Méthode au choix : simple, exponentielle, lissée ou pondérée linéaire. • La méthode sélectionné
FREE
Trend MACD Candles
Claus Dietrich
4 (2)
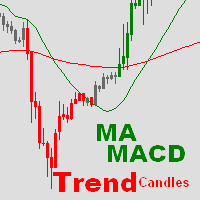
COLORED TREND MA / MACD CANDLES draw MA Candles above/below Moving Average draw MACD Candles above and below 0 and Signal-Line Your  Advantage: a simple view of the trend direction a simple view over the higher trend direction a calmer chart for the eye clear rules can be defined Settings: Value Quick-Set : pre-Settings MACD 3 / 9 / 6 MACD customize MA Candles Fast EMA : 12 Slow EMA : 26 MACD SMA : 9 1. MA Period : default 14 and 20, which are my favorite for all timeframes, I believe in the 14
FREE
This indicator is a zero-lag indicator and displays  strength of trend change . True Trend  Oscillator Pro works best in combination with True Trend Moving Average Pro that displays exact trend as is. Oscillator value is exact price change in given direction of the trend. True Trend Moving Average Pro: https://www.mql5.com/en/market/product/103586 If you set PERIOD input parameter to 1 this indicator becomes a sharpshooter for binary options. Developers can use True Trend Oscillator in Exper
FREE
Les acheteurs de ce produit ont également acheté
Trend Sniper X
Sarvarbek Abduvoxobov
4.86 (44)
Trend Sniper X est un indicateur de suivi de tendance multi-unités de temps pour MetaTrader 5 qui aide les traders à identifier la direction de la tendance et les points d'inversion potentiels avec clarté et précision. pour MT4: https://www.mql5.com/en/market/product/193245 Informations sur le prix : Le prix actuel est un prix promotionnel et est susceptible de changer lors des prochaines mises à jour et nouvelles fonctionnalités. Offre bonus : Pour obtenir GRATUITEMENT l'Auto-Trade Assistant E
Un nouveau Roi en ville - Indicateur + Gestion des ordres (TP1 + TP2 + TP3) + Envoi optionnel de signaux Telegram INCLUS (GRATUIT) (SYSTÈME COMPLET DE TRADING et DE SIGNAUX) Notre meilleur EA pour l’Or : Gold Slayer Cet indicateur inclut une stratégie avancée, un système de trading avec gestion des ordres personnalisable ainsi qu’un système de retour à la moyenne combinant des extensions d’enveloppes, soutenu par plusieurs filtres intelligents de confirmation comme le RSI afin de détecter des en
Smart Trend Trading System — MetaTrader 5 Après votre achat, envoyez-moi un message sur MQL5 pour recevoir GRATUITEMENT Smart Universal Expert Advisor, ainsi que le cours en ligne, le manuel PDF et l’accès au groupe privé. STTS réunit la direction de la tendance, les signaux d’entrée et de sortie, les zones de retournement et les niveaux de prix importants directement sur votre graphique. Suivez le système manuellement ou connectez un EA compatible distinct pour une exécution automatique selon l
Entry Points Pro vous montre où entrer, où placer le stop et avec quel lot trader — avant que vous ne passiez l'ordre. PRIX Actuellement 199 USD : 8 exemplaires à ce prix, ensuite 249 USD. Le prix final est de 349 USD. Je gagne ma vie en tradant sur les marchés, et je le montre, donc je n'ai pas besoin de vendre cet indicateur à tout le monde. C'est un outil pour les traders qui réfléchissent par eux-mêmes, pas un bouton magique. Pas de cassure, pas de trade. Une flèche grise est un signal annu
Gardez votre avantage de trading dans votre ligne de mire ! M5 Sniper est un nouvel indicateur de MeanFX. Il combine des signaux de trading précis avec des niveaux de TP/SL adaptatifs — créant ainsi les meilleures opportunités de trading statistiques possibles ! Le prix augmente tous les 5 achats, le prochain prix est de 69$ Envoyez-moi un message après l’achat pour recevoir des conseils/un guide et un EA bonus Qu’est-ce qui le distingue ? Performance statistique éprouvée sur Gold XAUUSD ( fonct
Zoryk Gold
Reda El Koutbane
4.79 (19)
ZORYK — Système avancé de signaux XAUUSD pour MetaTrader 5 Vous connaissez certainement cette sensation. Vous passez du temps à analyser l’or. Vous attendez le bon point d’entrée. Vous ouvrez enfin la position, puis le prix commence immédiatement à évoluer contre vous. Vous fermez trop tôt, déplacez le Stop Loss ou hésitez pendant quelques secondes. Ensuite, le marché atteint exactement l’objectif que vous aviez initialement prévu, mais sans vous dans la position. Le problème n’était pas toujour
Ultra Indicator
Ihor Otkydach
5 (1)
ULTRA est un indicateur technique « tout-en-un » : il analyse le marché de manière autonome, génère des signaux de trading, affiche les niveaux permettant de définir des ordres stop-loss et suggère le moment opportun pour clôturer les positions afin de sécuriser les bénéfices ou de minimiser les pertes. En d'autres termes, peu importe que vous ne sachiez pas analyser le marché, déterminer les niveaux (où placer votre stop-loss) ou que vous ayez du mal à gérer votre capital. ULTRA s'occupera de t
Gann Made Easy   est un système de trading Forex professionnel et facile à utiliser qui est basé sur les meilleurs principes de trading en utilisant la théorie de mr. WD Gann. L'indicateur fournit des signaux d'ACHAT et de VENTE précis, y compris les niveaux Stop Loss et Take Profit. Vous pouvez échanger même en déplacement en utilisant les notifications PUSH. VEUILLEZ ME CONTACTER APRÈS L'ACHAT POUR RECEVOIR GRATUITEMENT DES INSTRUCTIONS DE TRADING ET D'EXCELLENTS INDICATEURS SUPPLÉMENTAIRES! V
SuperScalp Pro
Van Minh Nguyen
4.54 (37)
SuperScalp Pro - Professional Multi-Layer Confluence Scalping System SuperScalp Pro est un indicateur de scalping avancé qui améliore le Supertrend classique grâce à plusieurs filtres intelligents de confirmation. Il vous aide à identifier des opportunités de trading Buy/Sell présentant une probabilité de réussite plus élevée, tout en réduisant considérablement les faux signaux. Des flèches Buy et Sell bien visibles apparaissent directement sur le graphique, avec des niveaux de Stop Loss et de T
SMC Intraday Formula
VividMind Digital Solutions
5 (26)
Commençons par être honnêtes. Aucun indicateur ne vous rendra rentable à lui seul. Si quelqu’un vous dit le contraire, il vous vend un rêve. Tout indicateur qui affiche des flèches parfaites d’achat/vente peut être rendu impeccable — il suffit de zoomer sur la bonne partie de l’historique et de capturer uniquement les trades gagnants. Nous ne faisons pas cela.  SMC Intraday Formula est un outil. Il lit la structure du marché pour vous, identifie les zones de prix à la probabilité la plus élevée
GoldenX Entry MT5
VividMind Digital Solutions
5 (17)
GoldenX Entry est un indicateur MT5 doté d’un algorithme adaptatif Smart Entry Trend, d’un système de scoring des signaux, d’un détecteur de régime de marché et d’un filtre de volatilité. Chaque signal inclut un niveau d’entrée calculé, trois niveaux de Take-Profit (TP1, TP2, TP3) ainsi qu’un niveau de Stop-Loss. Il est construit sur plusieurs couches analytiques conçues pour s’adapter à différentes conditions de marché, combinant un système analytique multicouche avec un optimiseur intégré et u
Gold Trend Coach MT5
Cristhian Alexander Gaibor Cuasquer
4.27 (11)
Des signaux d'achat et de vente sans repaint pour l'or (XAUUSD) sur MetaTrader 5. Chaque signal arrive avec un stop loss et trois take profits. Un filtre Smart Money Concepts avec BOS et CHoCH, pour trader dans le sens de la structure, pas contre elle. Un Mentor en direct sur votre panneau qui vous guide à chaque étape, de l'entrée jusqu'au TP3. Et des alertes directement sur votre téléphone et sur votre propre canal Telegram. C'est ça, Gold Trend Coach. Ne tradez plus jamais seul. KIT ACHETEUR
Boba Analysis Suite
Trade Ready Solutions LLC
5 (2)
Boba Analysis Suite Boba Analysis Suite est un indicateur d’analyse pour MetaTrader 5. Il réunit la structure du marché, les zones de prix pertinentes et le contexte général du marché dans une même vue graphique. Développé à partir de l’expérience pratique d’un trader et formateur en trading, il accompagne une démarche d’analyse structurée : évaluer la direction du marché, identifier les niveaux importants et analyser plusieurs unités de temps conjointement. Une analyse en contexte La significat
FX Power MT5 NG
Daniel Stein
5 (33)
FX Power : Analysez la force des devises pour des décisions de trading plus intelligentes Aperçu FX Power est l'outil essentiel pour comprendre la force réelle des principales devises et de l'or, quelles que soient les conditions du marché. En identifiant les devises fortes à acheter et les faibles à vendre, FX Power simplifie vos décisions de trading et révèle des opportunités à forte probabilité. Que vous suiviez les tendances ou anticipiez les retournements à l'aide de valeurs extrêmes de D
Azimuth Pro
Ottaviano De Cicco
5 (7)
Azimuth Pro V2: Synthetic Fractal Structure and Confirmed Entries for MT5 Overview Azimuth Pro is a multi-level swing structure indicator by Merkava Labs . Four nested swing layers, swing-anchored VWAP, ABC pattern detection, three-timeframe structural filtering, and closed-bar confirmed entries — one chart, one workflow from micro-swings to macro-cycles. This is not a blind signal product. It is a structure-first workflow for traders who care about location, context, and timing. 1. What Change
FiboSniper Pro
Van Minh Nguyen
5 (4)
FiboSniper Pro – Multi-Filter Fibonacci System with Auto SL/TP and Control Panel FiboSniper Pro est un indicateur technique qui combine des Fibonacci Envelopes dynamiques avec plusieurs filtres de confirmation afin de générer des signaux Buy et Sell sélectionnés. Les niveaux de Fibonacci sont calculés à partir de Moving Average et ATR, puis filtrés par ADX, EMA, RSI, ATR, Volume, Time et la structure des bougies. L’indicateur affiche directement sur le graphique les niveaux automatiques de Stop
Gold Entry Sniper
Tahir Mehmood
5 (23)
Gold Entry Sniper – Tableau de Bord ATR Multi-Unités de Temps pour Scalping et Swing Trading sur l'Or Gold Entry Sniper est un indicateur avancé pour MetaTrader 5 qui fournit des signaux d'achat/vente précis sur XAUUSD et autres actifs, basé sur la logique de Trailing Stop ATR et l' analyse multi-unités de temps . Caractéristiques et Avantages Clés Analyse Multi-Unités de Temps – Affiche les tendances en M1, M5, M15 sur un seul tableau. Trailing Stop Basé sur l'ATR – Ajuste automatiquement selon
M1 Sniper MT5
Oleg Rodin
5 (7)
M1 SNIPER   est un système d'indicateurs de trading facile à utiliser. Il s'agit d'un indicateur à flèche conçu pour l'unité de temps M1. Cet indicateur peut être utilisé seul pour le scalping sur l'unité de temps M1 ou intégré à votre système de trading existant. Bien que conçu spécifiquement pour le trading sur l'unité de temps M1, ce système peut également être utilisé avec d'autres unités de temps. Initialement, j'avais conçu cette méthode pour le trading du XAUUSD et du BTCUSD. Cependant, j
Apex Patterns PRO Achetez l'indicateur - Obtenez GRATUITEMENT l'Expert Advisor basé sur celui-ci. Intelligence auto-optimisée des figures chartistes et des cassures Les scanners de figures traditionnels s'appuient sur des paramètres fixes, sous-performant souvent lorsque la volatilité et les structures du marché changent. Apex Patterns PRO est conçu pour s'adapter aux conditions changeantes du marché en combinant la reconnaissance des figures chartistes structurelles, le filtrage du momentum et
SQN Max indicator for MT5 by ITC
Renaud Herve Francois Candel
Sqn Max Indicator Sqn Max is an exclusive indicator to trade the market with high effectiveness. The indicator is based on price action, volatility and trend. This indicator is as simple as possible but not too simple. The indicator can generate alerts to ease the trading process. You don't have to stay all day in front of your screen. The indicator can be used with any class of assets and with any time frame. It is possible to achieve better results trading our list of selected assets. We achi
Adaptive Price Action Engine Achetez un indicateur, obtenez l'EA gratuitement Analyse auto-optimisée des tendances et des figures de chandeliers Multi-Timeframe Les marchés évoluent constamment, et tous les modèles de Price Action n’ont pas la même valeur dans toutes les conditions de marché. Adaptive Price Action Engine a été conçu pour s’adapter aux changements du marché en combinant structure de tendance, analyse Multi-Timeframe, figures de chandeliers et optimisation statistique au sein d’un
Atomic Analyst MT5
Issam Kassas
4.51 (65)
Atomic Analyst — MetaTrader 5 Après votre achat, envoyez-moi un message sur MQL5 pour recevoir GRATUITEMENT Smart Universal Expert Advisor, ainsi que le cours en ligne, le manuel PDF et l’accès au groupe privé. Atomic Analyst réunit l’action des prix, la direction de la tendance, les signaux d’entrée et de sortie, le Stop Loss et plusieurs niveaux de Take Profit directement sur votre graphique. REPÉREZ LE SIGNAL. COMPRENEZ LA CONFIGURATION. Atomic Analyst présente son analyse sous forme d’inform
Prochaine mise à jour — Version 2.52 bientôt disponible ! [NOUVEAU] Préparez-vous à découvrir 4 nouvelles fonctionnalités majeures conçues pour améliorer votre analyse du marché et votre flux de travail de trading Nous faisons passer l’analyse du marché au niveau supérieur avec 4 nouvelles fonctionnalités conçues pour répondre à vos besoins en trading. Découvrez : 1. TRADE OVERVIEW DASHBOARD 2. CONFLUENCE AT ZONE 3. STRONG & WEAK HIGH/LOW 4. OTE 1. TRADE OVERVIEW DASHBOARD Un tableau de bord qu
Divergence Bomber
Ihor Otkydach
4.89 (94)
Chaque acheteur de cet indicateur reçoit également gratuitement : L’outil exclusif « Bomber Utility », qui accompagne automatiquement chaque opération de trading, fixe les niveaux de Stop Loss et de Take Profit, et clôture les positions selon les règles de la stratégie Des fichiers de configuration (set files) pour adapter l’indicateur à différents actifs Des set files pour configurer le Bomber Utility selon différents modes : « Risque Minimum », « Risque Équilibré » et « Stratégie d’Attente »
Tokyo mt5 Indicator
Vasiliy Strukov
5 (15)
Le Tokyo Indicator offre une vue d'ensemble visuelle et claire de l'orientation de la tendance, des signaux de trading potentiels et des conditions du marché. Sa ligne de tendance en escalier, codée par couleur, distingue les phases haussières (en bleu) des phases baissières (en magenta). Des flèches directionnelles associées mettent en évidence les opportunités d'achat et de vente potentielles lors des changements de tendance. Un tableau de bord intégré regroupe le signal actuel, l'orientation
Power Candles MT5
Daniel Stein
4.58 (12)
Power Candles V3 - Indicateur de force à optimisation automatique Power Candles V3 transforme la force des devises et des instruments en un plan de trading exploitable sur chaque graphique auquel il est associé. Au lieu de se contenter de colorer les bougies, il effectue une optimisation automatique en temps réel en arrière-plan et vous fournit les meilleurs niveaux de Stop Loss, Take Profit et seuils de signal pour le symbole que vous avez sous les yeux. Un simple clic suffit pour l'adopter en
Currency Strength Wizard   est un indicateur très puissant qui vous offre une solution tout-en-un pour un trading réussi. L'indicateur calcule la puissance de telle ou telle paire de devises en utilisant les données de toutes les devises sur plusieurs périodes. Ces données sont représentées sous la forme d'un indice de devise facile à utiliser et de lignes électriques de devise que vous pouvez utiliser pour voir la puissance de telle ou telle devise. Tout ce dont vous avez besoin est d'attacher
Naked Forex Tweezer Pro Indicator Tweezer Pro Indicator is a pattern recognition indicator for Forex, Stocks, Indices, Futures, Commodities and Cryptos. The standard Tweezer is a two bar pattern. Our enhanced version is a multi-bar pattern. We filter the patterns for you so that you only get the     best and most effective patterns   and ignore the noise. The Tweezer pattern is a simple and effective pattern to trade. The strategy that comes with the Tweezer is based on price action. The Twe
Auto Optimized SpeedAngle est un système de vectorisation du momentum de niveau institutionnel qui élimine l'ajustement de courbe ( curve-fitting ) grâce à une optimisation continue par avancement ( Walk-Forward Optimization , WFO). Plutôt que de s'appuyer sur des entrées statiques qui se dégradent lorsque les régimes de marché changent, l'indicateur recalibre dynamiquement ses paramètres en utilisant une validation hors échantillon ( Out-of-Sample , OOS), garantissant ainsi que les signaux affi
Smc Pro ToolKit
Talal N Z Aljarusha
5 (13)
SMC PRO TOOLKIT — SMART MONEY ANALYSIS & STRUCTURED TRADE PLANNING SMC Pro ToolKit is a professional Smart Money Concepts analysis workspace for MetaTrader 5. It combines market structure, multi-timeframe analysis, institutional price zones, setup evaluation, confirmation tools, volume context, alerts, and risk planning inside one organized chart environment. One workspace. Multiple layers of confirmation. One structured trading plan. OPEN COMPLETE USER GUIDE MULTI-CONDITION SETUP ENGINE At
Plus de l'auteur
QCL Structure Trail for MetaTrader 5 QCL Structure Trail combines confirmed market structure breaks with an ATR-based trailing line to help traders follow directional moves and monitor changing market conditions directly on the price chart. Its clear display includes a color-changing trailing line and optional signal arrows, keeping the chart focused on price action. How It Works The indicator identifies confirmed swing highs and swing lows using the selected Pivot Confirmation Length. A bullish
FREE
QCL Momentum Candles — MT5 See momentum changes through a clear, candle-based oscillator. QCL Momentum Candles converts smoothed Stochastic RSI values into synthetic momentum candles in a separate indicator window. Green and red candles help you follow shifts in momentum, while a centered scale and highlighted extreme zones provide context for your chart analysis. Main Features Synthetic momentum candles: View oscillator movements as candle bodies and wicks. Directional colors: Green candles ind
FREE
QCL Market Structure Zones is a chart-based analytical indicator for identifying confirmed swing points, supply and demand zones, and breaks of market structure. The indicator uses confirmed swing highs and swing lows to create volatility-adjusted zones. Zone height and overlap filtering are calculated using the Average True Range, allowing the indicator to adapt to different symbols and timeframes. Main features Confirmed swing high and swing low detection Automatic supply and demand zones Aver
FREE
RSI Flow Candles MT5 QCL RSI Flow Candles transforms RSI momentum into smoothed Heikin Ashi-style candles in a separate indicator window. Its candle structure, adaptive trend line and reference zones help traders assess momentum direction, pullbacks and transitions within a familiar 0–100 oscillator scale. Key Features RSI-based candles: View momentum through candle bodies and wicks instead of a conventional RSI line. Directional colors: Green candles indicate that the oscillator close is at or
FREE
QCL Market Structure Zones is a free market structure indicator for MetaTrader 4. It identifies confirmed swing points, creates volatility-adjusted supply and demand zones, and marks Break of Structure events directly on the price chart. The indicator can also display Higher High, Lower High, Higher Low, and Lower Low labels together with an optional pivot-based ZigZag. It is designed for visual market analysis and does not open, modify, or close trades. Main Features Confirmed swing high and sw
FREE
QCL Structure Trail for MetaTrader 4 QCL Structure Trail combines confirmed market structure breaks with a volatility-based trailing line. It helps traders identify directional changes and follow price movements through a clear display directly on the chart. How It Works The indicator identifies confirmed swing highs and swing lows using the selected Pivot Confirmation Length. A bullish signal appears when the closing price crosses above the latest confirmed swing high. A bearish signal appears
FREE
QCL Bollinger Trend Trail Follow trend direction with a clear, adaptive line directly on your price chart. QCL Bollinger Trend Trail combines trend detection with integrated volatility filtering to display a trailing reference line. Its two-color presentation helps you identify rising, falling, and unchanged trend conditions without adding a separate indicator window. The line advances as the trend develops and holds its position when conditions do not support further movement. Key Features Adap
FREE
QCL Dynamic RSI Zones — MetaTrader 4 QCL Dynamic RSI Zones combines a smoothed RSI signal with adaptive boundaries to help you assess momentum relative to recent market conditions. Instead of relying on fixed overbought and oversold levels, the indicator adjusts its zones using recent RSI behavior. A dynamic balance line, a color-changing signal, and excursion columns display momentum conditions in a separate chart window. Key Features Adaptive boundaries: Upper and lower zones respond to recent
FREE
QCL Adaptive Band Oscillator — MetaTrader 5 A smooth 0–100 oscillator with adaptive reference bands for a clearer view of price momentum. QCL Adaptive Band Oscillator combines smoothed price calculations with dynamic upper and lower reference bands. Displayed in a separate indicator window, it helps you examine momentum swings, potential turning points, and divergences between price and the oscillator. A smooth transformation keeps the oscillator and both reference bands within the 0–100 range ,
FREE
QCL RSI Flow Candles — MetaTrader 4 QCL RSI Flow Candles transforms RSI momentum into smoothed Heikin Ashi-style candles in a separate indicator window. Candle bodies, wicks, a directional trend line and reference zones provide a visual framework for assessing momentum, pullbacks and changing conditions. Key Features RSI-based candles: View momentum through candle structure instead of a conventional RSI line. Directional colors: Green candles indicate that the oscillator close is at or above its
FREE
QCL Bollinger Trend Trail — MT4 Track trend direction with an adaptive trailing line directly on your MetaTrader 4 chart. QCL Bollinger Trend Trail combines trend detection with integrated volatility filtering to provide a clear visual reference alongside price action. Its two-color line advances as a trend develops and holds its position when conditions do not support further movement. Key Features Adaptive trailing line: Follows developing price movements. Directional colors: Distinguishes upw
FREE
QCL Adaptive Band Oscillator — MetaTrader 4 A smooth 0–100 oscillator with adaptive reference bands for a clearer view of price momentum. QCL Adaptive Band Oscillator combines smoothed price calculations with dynamic upper and lower bands. Displayed in a separate indicator window, it helps you examine momentum swings, potential turning points, and divergences between price and the oscillator. A smooth transformation keeps the oscillator and both bands within the 0–100 range , with a center refer
FREE
QCL Clouds MT4
Ahmadreza Najafi
QCL Clouds for MetaTrader 4 is an adaptive market-regime indicator designed to display trend direction, momentum transitions, and dynamic price zones in a clean and practical format. The indicator combines its internal calculations into color-changing signal-line segments, crossover dots, and a projected market cloud. The simplified presentation helps traders identify directional changes without placing multiple overlapping lines on the chart. HOW TO READ QCL CLOUDS • Blue Signal Line Indicates
QCL Clouds MT5
Ahmadreza Najafi
QCL Clouds is an adaptive market-regime indicator designed to present trend direction, momentum transitions, and dynamic price zones in a clean and easy-to-read format. Instead of displaying multiple overlapping lines, the indicator combines its calculations into one color-changing signal line, crossover dots, and a projected market cloud. HOW TO READ QCL CLOUDS • Blue Signal Line Indicates that bullish conditions are currently dominant. • Orange Signal Line Indicates that bearish conditions are
Filtrer:
Aucun avis
Répondre à l'avis