Moving Average Breakout Alert
- Indicatori
- Versione: 1.0

Jireh RSI MA Breakout
Jireh RSI MA Breakout is a multi-filter technical indicator designed to identify price breakouts of a Moving Average after relevant RSI overbought or oversold conditions.
The indicator combines Moving Average breakouts, RSI conditions, breakout candle strength, Higher Timeframe trend confirmation and volume analysis in a single visual system.
Signals are confirmed using closed candles, providing clear and objective breakout detection.
Visual Interface
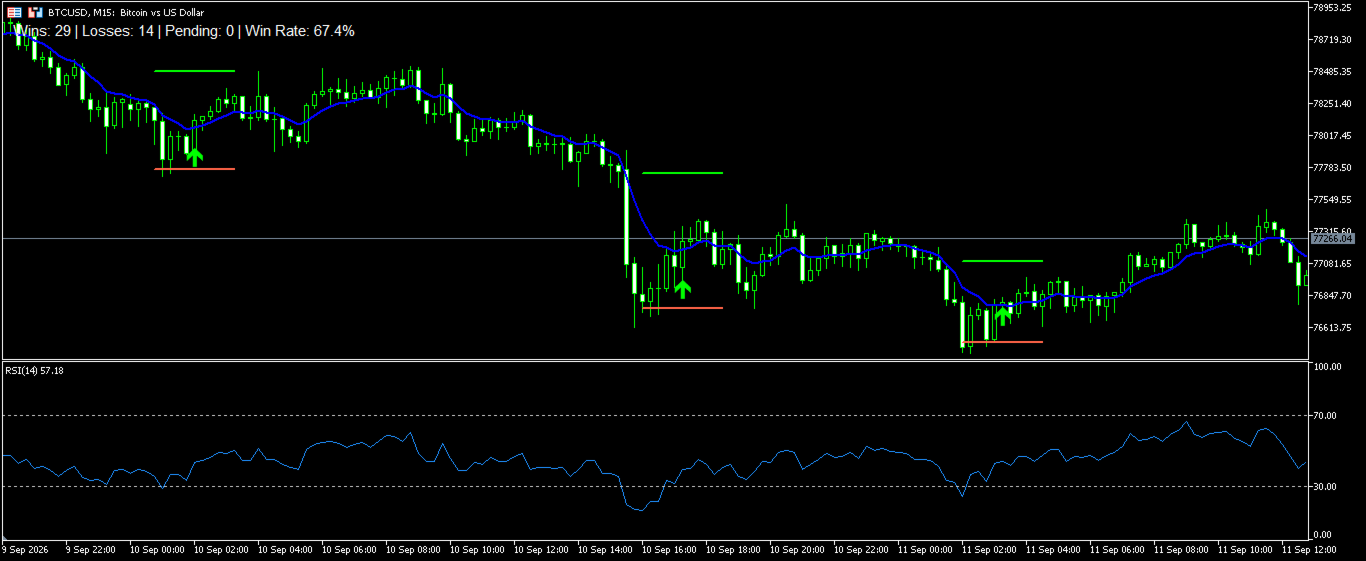
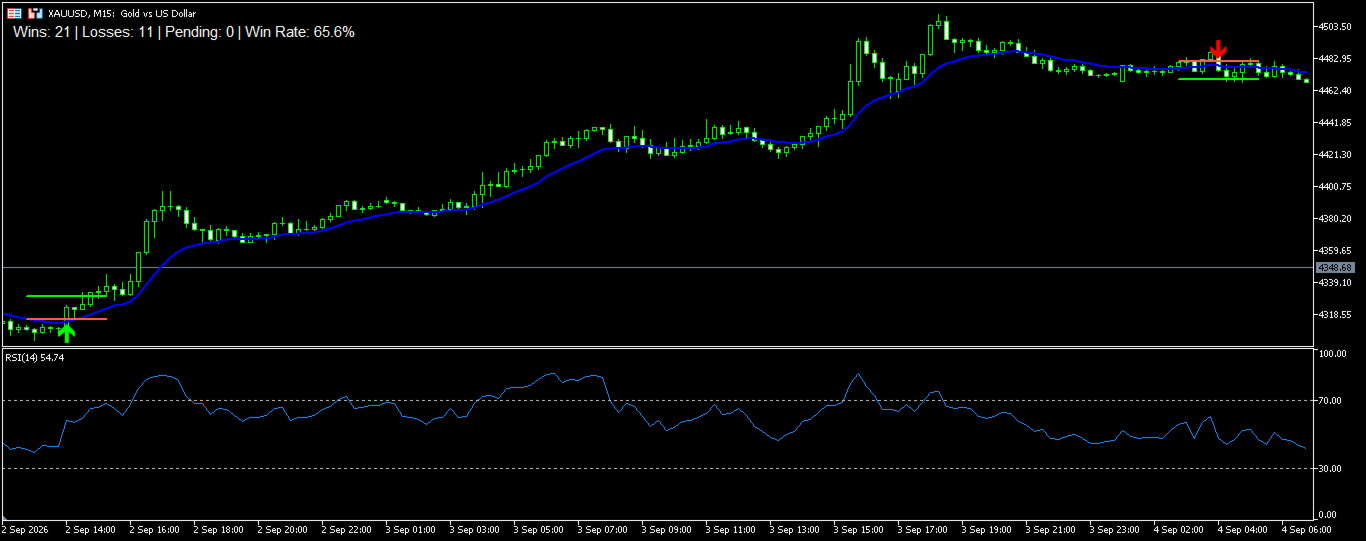
The indicator provides a complete visual interface for signal analysis:
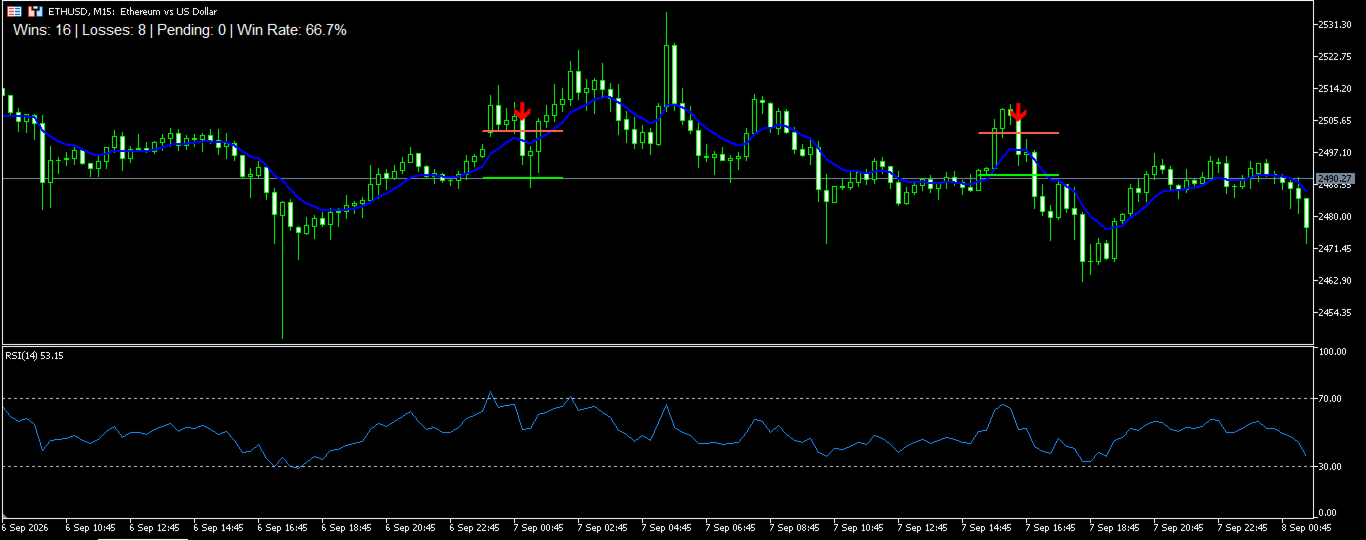
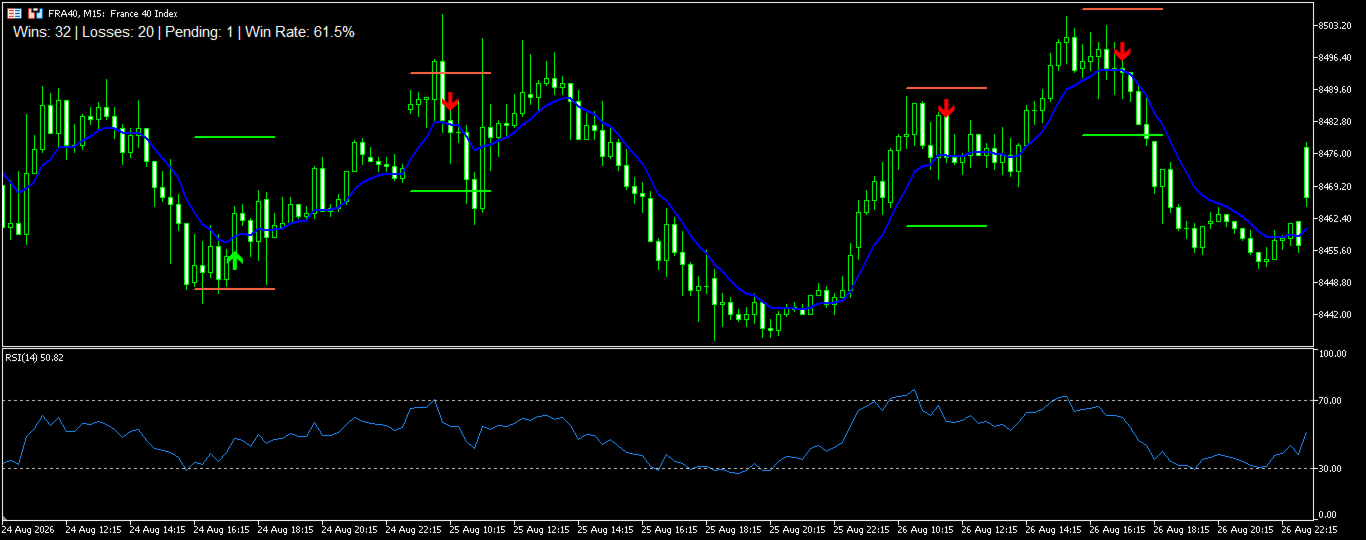
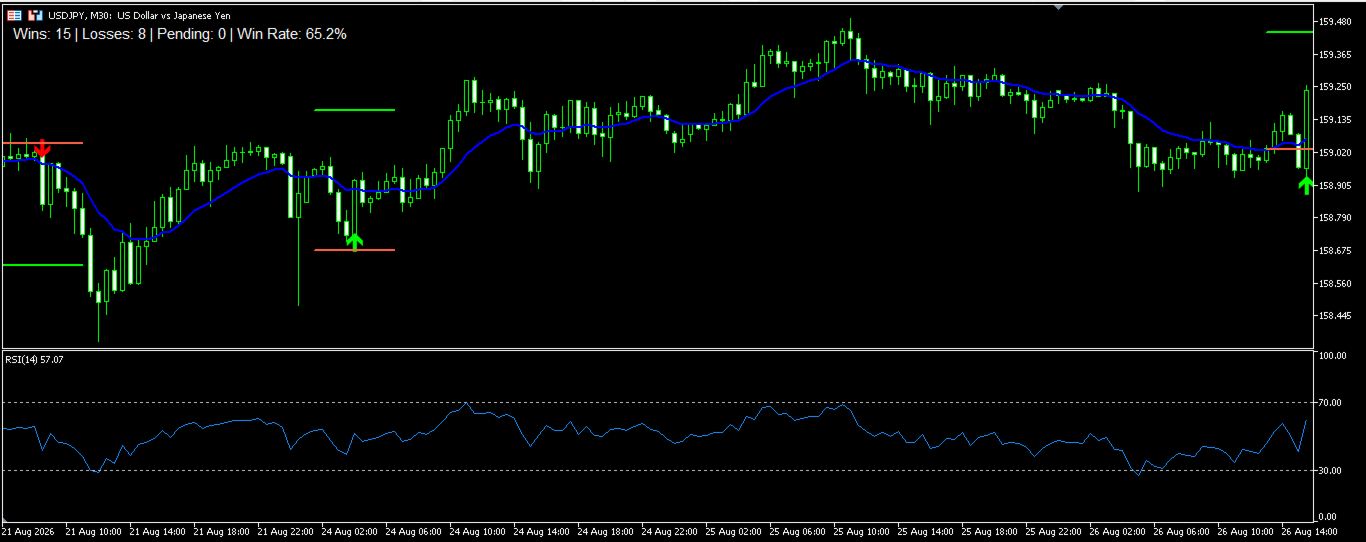
- Blue line — Main Moving Average
- RSI subwindow — optionally displayed continuously on the chart
- Green arrow — Buy signal
- Red arrow — Sell signal
- Red line — Stop Loss level for each signal
- Green line — Take Profit level for each signal
- Statistics panel — Wins, Losses, Pending signals and Win Rate
When the RSI subwindow is enabled, it remains visible on the chart, allowing the user to monitor RSI behavior and overbought/oversold conditions at all times.
When a valid breakout signal is confirmed, the indicator places a Buy or Sell arrow on the signal candle and automatically calculates the corresponding Stop Loss and Take Profit levels.
The SL and TP levels are displayed as short horizontal segments around each signal instead of extending indefinitely across the chart. Their length, width and colors are configurable. The user can also choose to keep all historical SL/TP levels or display only the latest ones.
How the Signal Works
The strategy uses an RSI condition as preparation for a subsequent Moving Average breakout.
For a Buy setup, the RSI must first reach the configured oversold level. The indicator then waits for price to cross and close above the Moving Average.
For a Sell setup, the RSI must first reach the configured overbought level. The indicator then waits for price to cross and close below the Moving Average.
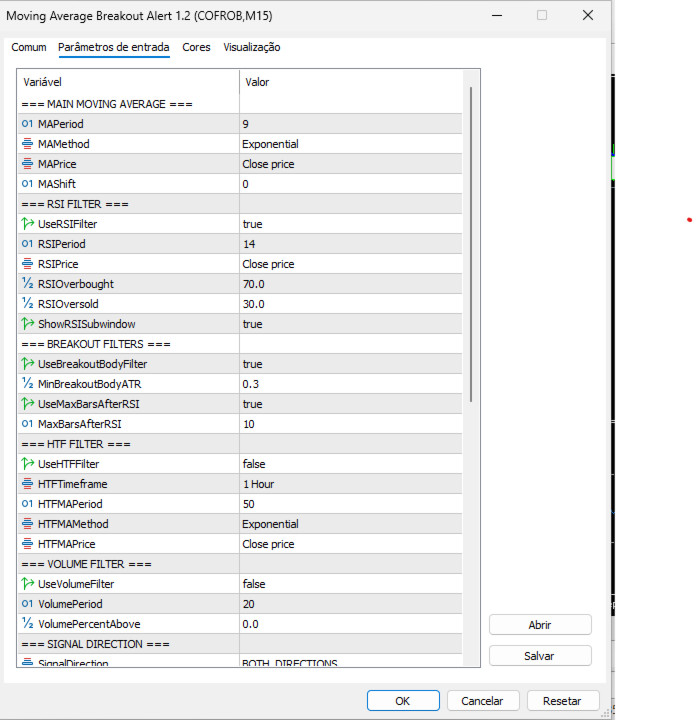
The RSI levels are fully configurable. Traditional values such as 70/30, more restrictive values such as 75/25, or other combinations can be tested according to the characteristics of each market.
Maximum Bars After RSI
The optional Max Bars After RSI filter controls how long an RSI condition remains valid.
For example, if the maximum is set to 10 candles, the Moving Average breakout must occur within the configured period after the RSI condition.
This prevents an old overbought or oversold event from validating a breakout that occurs much later.
The filter can be enabled or disabled.
Breakout Candle Strength Filter
The optional Breakout Body ATR Filter measures the body of the Moving Average breakout candle relative to ATR.
When enabled, a breakout is accepted only if the candle body reaches the minimum ATR proportion configured by the user.
This allows weak crossings to be filtered and makes it possible to adapt the required breakout strength to different symbols and market conditions.
Higher Timeframe Filter
An optional Higher Timeframe (HTF) Moving Average filter can be used as an additional directional confirmation.
The HTF timeframe, Moving Average period, method and applied price are configurable.
This filter can be enabled or disabled depending on the market and trading approach.
Volume Filter
The optional Volume Filter compares the tick volume of the signal candle with the average volume of previous candles.
The user can configure:
- Volume average period
- Required percentage above average
- Filter enabled or disabled
This allows signals to require additional market activity before being validated.
Stop Loss and Take Profit
The indicator provides two Stop Loss calculation methods:
Pivot Stop Loss
For Buy signals, the indicator searches for the lowest price within the configured lookback period.
For Sell signals, it searches for the highest price within the configured lookback period.
ATR Stop Loss
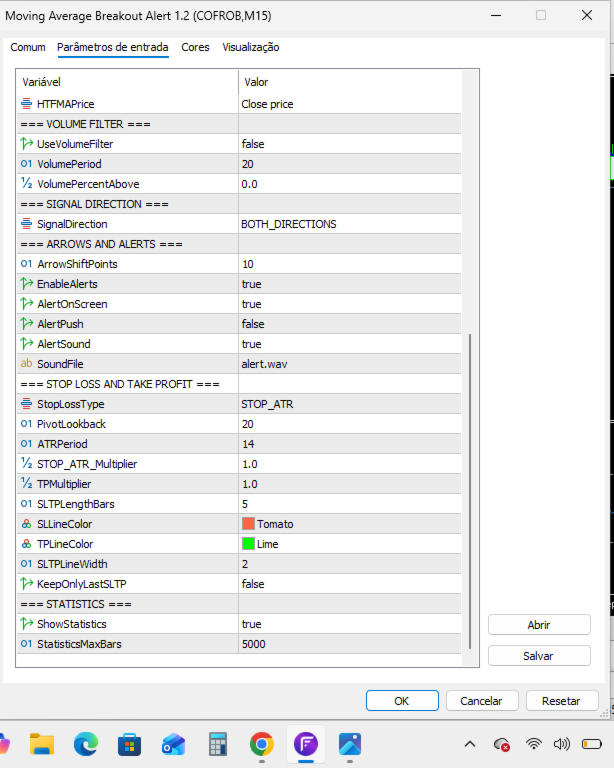
The Stop Loss distance is calculated using ATR multiplied by the configured ATR multiplier.
Take Profit
Take Profit is calculated as a multiple of the initial Stop Loss distance through the configurable TP Multiplier .
This makes it possible to study different risk/reward configurations.
Signal Statistics
The indicator includes a built-in statistics panel showing:
Wins | Losses | Pending | Win Rate
The historical calculation range can be configured by the user.
A signal is classified according to whether its calculated TP or SL is reached first. If TP and SL are both reached during the same candle, the indicator uses a conservative approach and classifies the result as a Loss.
These statistics are intended for visual analysis and strategy research.
Alerts
The indicator supports:
- On-screen alerts
- Push notifications
- Sound alerts
- Custom alert sound
Signals and alerts are confirmed on closed candles.
Flexible Configuration
The main parameters can be adjusted individually, including:
- Moving Average period, method and applied price
- RSI period and overbought/oversold levels
- Maximum bars after RSI condition
- Minimum breakout candle body relative to ATR
- Higher Timeframe filter
- Volume filter
- Buy & Sell, Buy Only or Sell Only
- Pivot or ATR Stop Loss
- Take Profit multiplier
- Arrow distance
- SL/TP line appearance
- Historical SL/TP display
- Statistics calculation range
- Alert options
The flexible configuration allows the indicator to be studied and adjusted for different symbols, timeframes and market conditions, including Forex, Metals, Indices and Cryptocurrencies.
Important Notice
Jireh RSI MA Breakout is an analytical indicator. It does not automatically open, manage or close trades.
The displayed Stop Loss, Take Profit and historical statistics are provided for analysis and strategy research purposes.
Past performance and historical signal statistics do not guarantee future results.