TradeQA

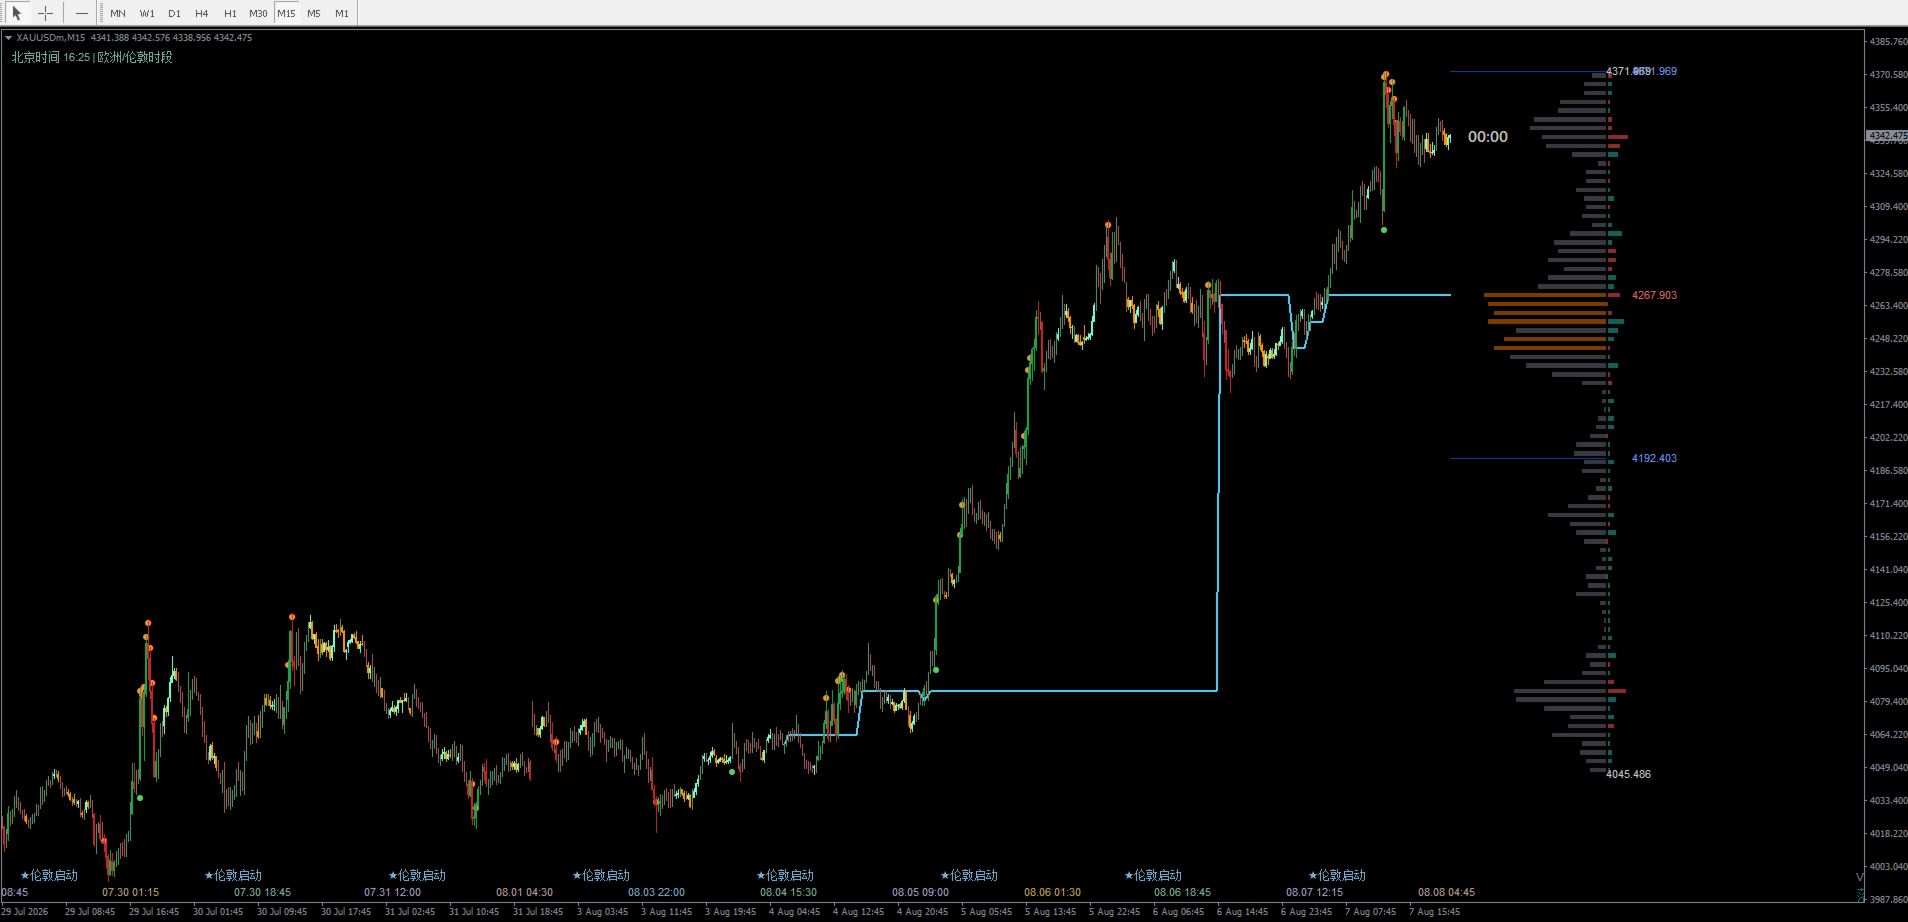
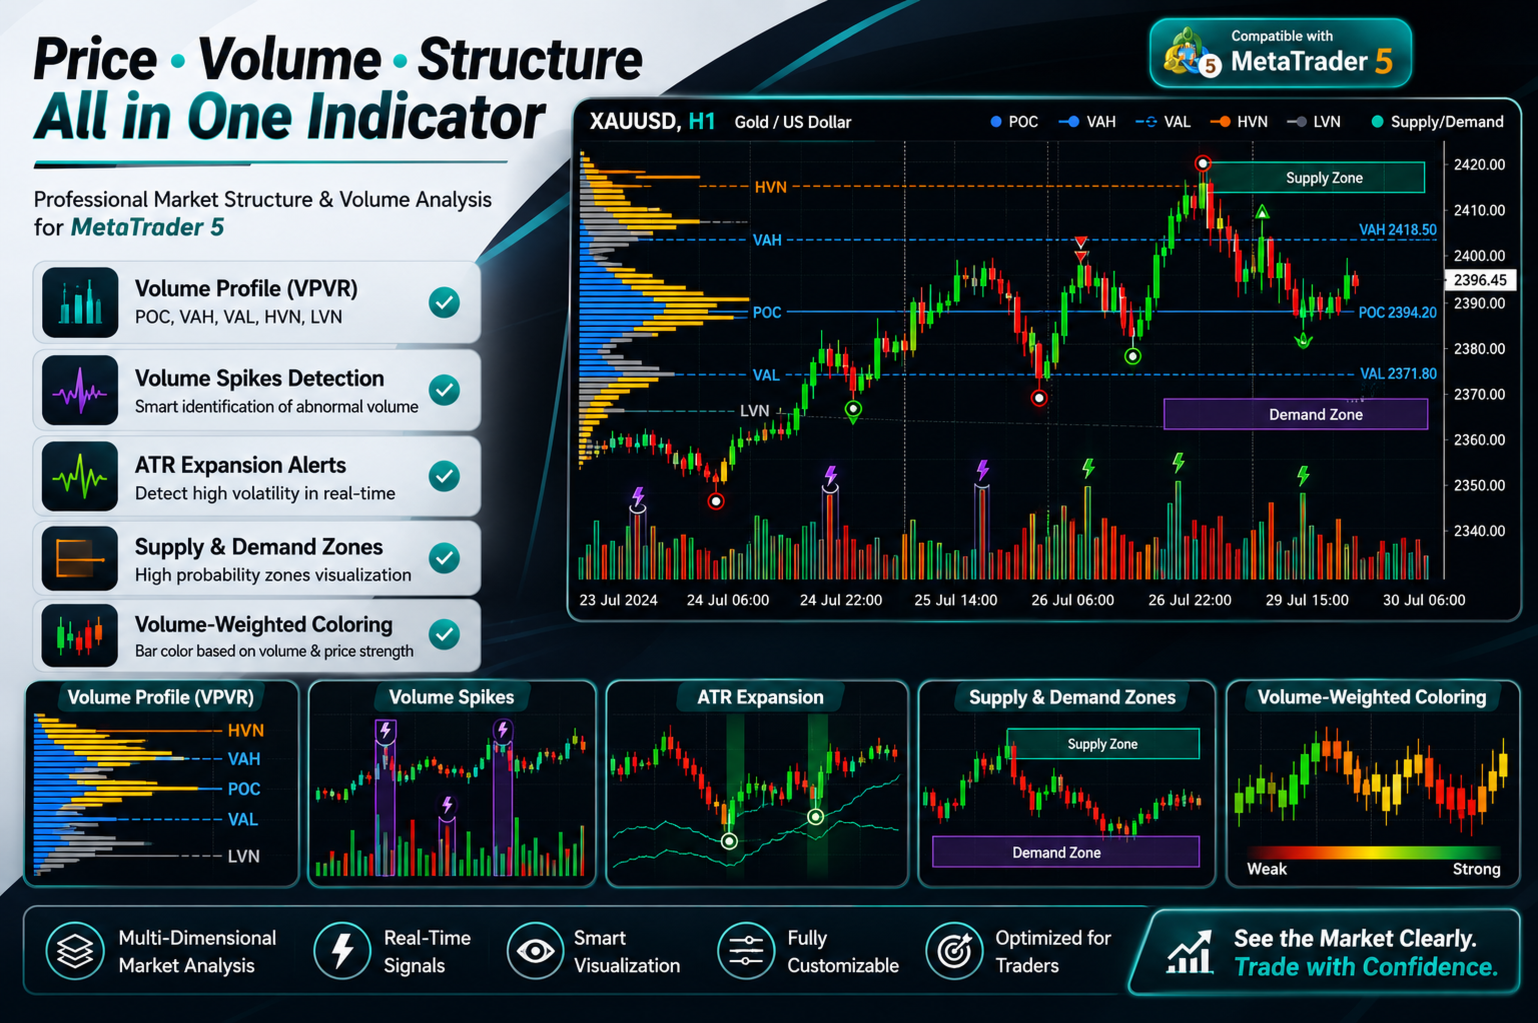
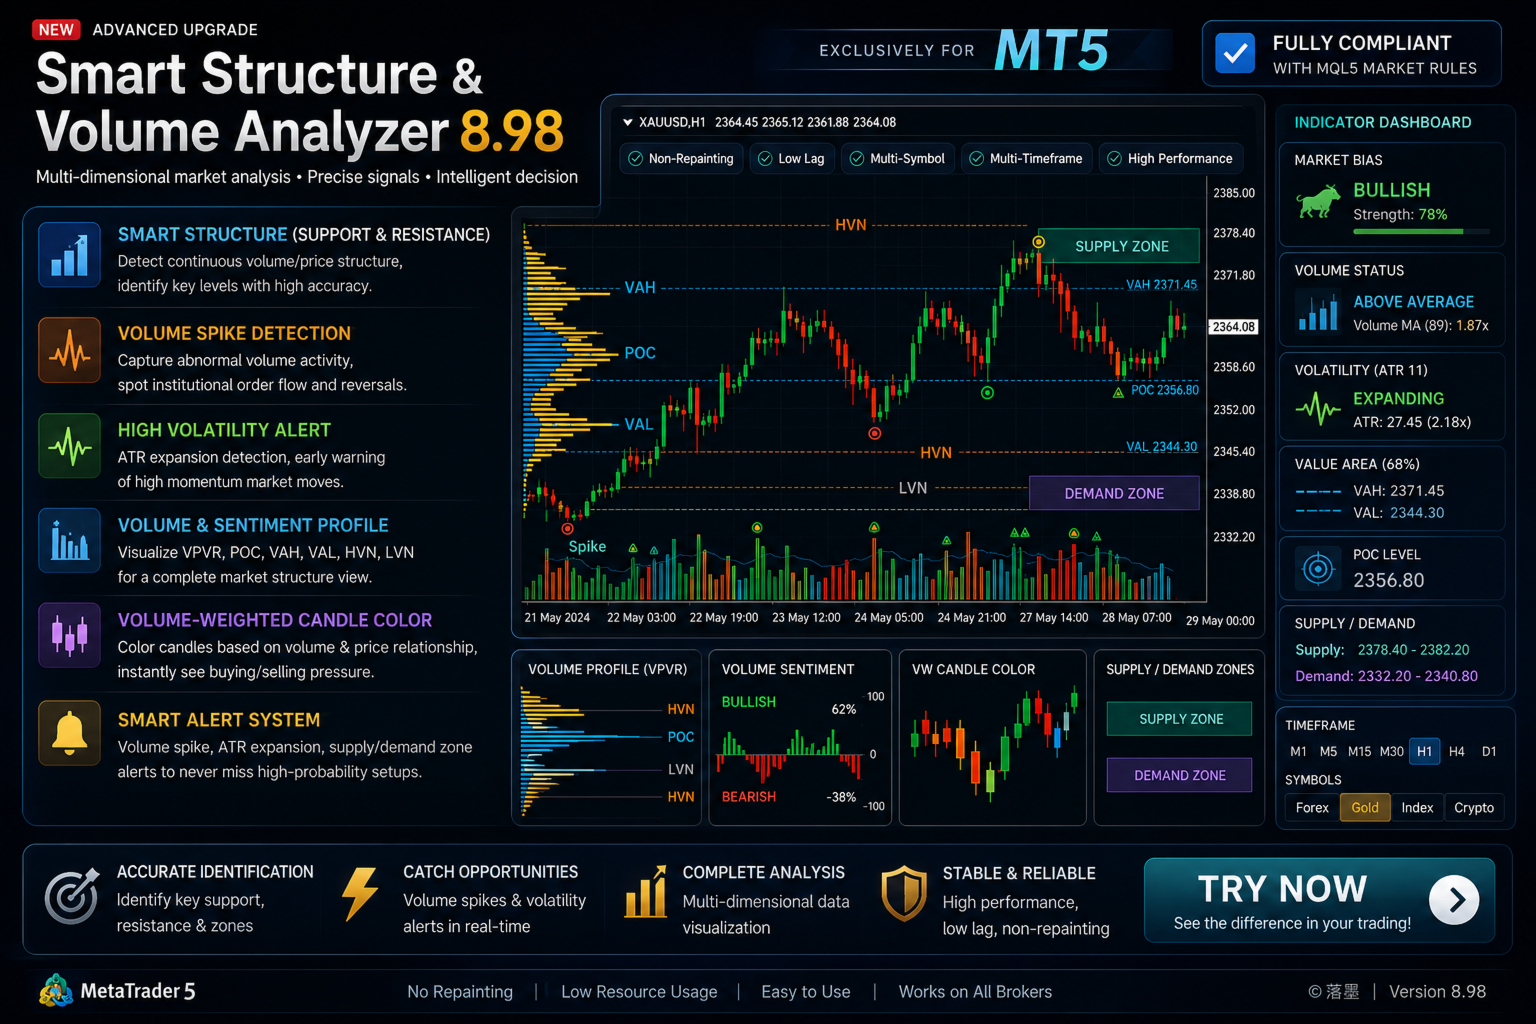
这款量价结构指标适用于   MetaTrader 4 和 MetaTrader 5   的图表分析指标,集合量价结构、成交量分布、市场情绪、波动提示和关键价格区域表现于一体。指标运行直接于主图窗口,可帮助交易者快速观察市场的重要价格位置与活跃程度。


它采用了动态的POC,可以让你看到市场中价值的迁移过程。同时还有四种成交量K线涂色使你不会在不合适的位置入场。


ni你在图表上可以看到VAH,POC,VAH,以及分布图和右侧的情绪值,这样你能轻松的看到市场的交易情绪从而不陷入狂热中去,冷静的看待交易,看待盈亏。


希望你能通过这个指标清晰的看清市场,明白价格所在,位置所处,找到自己的交易节奏。


z指标只是交易的一部分,只是辅助,所以,你要专注而不执拗,冷静的看待每次交易。加油吧,孤独的交易者。
Prodotti consigliati
Adaptive Volume Profile disegna il Volume Profile delle ultime barre direttamente sul grafico: il Point of Control (POC), la Value Area (VAH / VAL), i nodi ad alto volume (HVN), i nodi a basso volume (LVN) e un istogramma del volume opzionale. La dimensione delle righe di prezzo si adatta alla volatilità corrente (ATR), così il profilo resta leggibile su qualsiasi simbolo e timeframe. Caratteristiche POC - il livello di prezzo con il maggior volume scambiato nella finestra Value Area (VAH / VAL)
FREE
Multi-Timeframe Anchored VWAP Indicator (Custom Period & Standard Deviation Channels) — Technical Description Overview This indicator extends the traditional VWAP with multi-timeframe anchoring, session reset, and standard deviation channels, providing a dynamic "fair value" reference area. All calculations are based on currently visible price and volume data; the indicator contains no future functions, does not repaint, and does not drift. Core Features Multi-Timeframe Anchoring Automatically
KT Volume Profile MT4
KEENBASE SOFTWARE SOLUTIONS
Volume profile indicator that tells you which levels price is likely to reach today. Daily profiles with POC, VAH and VAL, naked POCs and a drag box for any range, and every level labelled with how often price reached a level at that distance on your own chart. What you see on the chart A profile for every day on M1 to H1 charts, with the value area in a stronger colour. Yesterday's POC, VAH and VAL across today, each with its odds for today, or "reached" once price gets there. Naked POCs: earli
CyberZingFx Trend Reversal
Afsal Meerankutty
4.18 (17)
NEW YEAR SPECIAL DISCOUNT RUNNING NOW 40% DISCOUNT Price slashed from $149 to $89 until 3rd Jan 2025 Indicator captures the trend reversals with no-repaint Buy and Sell Arrow signals. CyberZingFx Trend Reversal Indicator - your go-to solution for accurate and reliable trend reversal signals. With its  advanced trading strategy , the indicator offers you Buy and Sell Arrow signals that do not repaint, making it a reliable tool for catching Swing Highs and Swing Lows in any market and any time fr
Positionsizecalculator
Takatso Mashilangwako
This indicator is a too that : calculates position size based on account balance/equity , currency pair, given entry level, stop-loss level and risk tolerance (set either in percentage points or in base currency). It displays reward/risk ratio based on take-profit. Shows total portfolio risk based on open trades and pending orders. Calculates margin required for new position, allows custom leverage.                
TITAN AI Volume Profile PRO MT4 is an advanced technical indicator designed for professional market analysis, volume profile distribution, and graphical data visualization in MetaTrader 4. Key Features: - Dynamic Volume Profile calculation based on price action and tick volume. - Automatic High Value Area (VAH), Low Value Area (VAL), and Point of Control (POC) detection. - High Volume Nodes (HVN) and Low Volume Nodes (LVN) highlighting. - Integrated Economic Calendar with news alerts. - Built-
Month Statistics
Elidio Xavier Guimaraes
Month Stats Overview: A Price Analysis Indicator by month. A quantitative technical analysis indicator developed for statistical analysis of price variations, with data classified by calendar month. This indicator processes candle data and displays statistical results based on user input parameters. The input parameters allow defining the type and frequency of the statistics to be calculated. This indicator provides a quantitative basis for identifying market patterns. Output Data: The indicator
Introduction It is common practice for professional trades to hide their stop loss / take profit from their brokers. Either from keeping their strategy to the themselves or from the fear that their broker works against them. Using this indicator, the stop loss / take profit points will be drawn on the product chart using the bid price. So, you can see exactly when the price is hit and close it manually.  Usage Once attached to the chart, the indicator scans the open orders to attach lines for t
Trader Indicator
Matshelo Innocent Beesnaar
The TraderProfit7TopDown is a sophisticated multi-confirmation technical indicator for MetaTrader 4, designed to generate high-probability trading signals by synthesizing data from price action, momentum, and market volume. Its core philosophy is to filter out market noise and false breakouts by requiring a confluence of four distinct analytical factors before presenting a signal, making it a robust tool for trend-following strategies. The indicator's logic is built upon a layered approach. F
The indicator displays a stock chart of a non-standard type, in which the price and time have the same value. The usual chart of Japanese candlesticks does not take into account all the information that the time analysis can give. Renko charts do not use all the information that price can give in relation to time. The "Chart Price and Time" indicator takes into account price and time equally and shows the predominance of price or time. Taking into account price and time equally gives an idea
About testing Mode: 1.To get the best usage experience please use the tick data to test and adjust the test speed to proper speed (tick price jump quickly but K bars scroll slowly)!!! 2.Click "Indicator Properties"-> Click "Reset" before testing the indicator to restore the default parameters of the indicator. 1. Compound Drawings (1) Line segment with arrow (2) Continuous line segment (broken line) (3) Parallelogram (4) Polygon (5) Profit and loss ratio measurement tools 2.     Backtracking  
Let us introduce you to a new era of neural indicators for financial markets! Intelligent Moving is a unique indicator that trains its neural network in real time! You no longer need to look for the optimal indicator parameters for each specific situation. No more late signals. The artificial intelligence is able to adapt itself and predict any market movements. Visually, the indicator is drawn as a main solid moving average line, two dotted lines of standard deviations and signal arrows. For
Here   our MT5 version more valuable tools SMC Trend Trading   ,  Easy SMC Trading  ,  Institutional SMC Architect Volume Analysis Tools  ,  Volume flow Profile  ,  Market volume profile  , FVG with Volume  , Liquidity Heatmap Profile  ,  Volume Spread Analysis 2. Key Features Dynamic Filtering : The core feature. As soon as the current price crosses a historical liquidity level, that level disappears. This reduces chart clutter and prevents you from trading off "dead" support/resistance. Liqui
The indicator looks for buying and selling zones, where a deal can be opened with a minimal stop loss and a better Risk Reward Ratio. The indicator is based on qualitative search of the Double top/Double bottom pattern. Indicator operation principle Looks for local tops/bottoms which can potentially become a Reversal zone It waits for an impulse movement that would exceed the Reversal zone and draws a red/blue wide rectangle Within the Reversal zone, it looks for the strongest area of the zone
Matrixs
Andriy Sydoruk
Matrix is a Forex arrow indicator. Displays signals simply and clearly! The arrows show the direction of the transaction, and are colored accordingly, which can be seen in the screenshots. As you can see, trading with such an indicator is easy. I waited for an arrow to appear in the desired direction - I opened a deal. An arrow formed in the opposite direction - closed the deal. The indicator also displays the lines with the help of which the arrow signals are formed, taking into account the int
MR Volume Profile 4
Sergey Khramchenkov
The "MR Volume Profile 4" indicator is a charting tool that displays trading volume at different price levels rather than time intervals. A key concept in volume profile is the point of control (POC)—the price level with the highest volume traded during the session or time range. While tools like VWAP or OBV provide volume trends, the "MR Volume Profile 4" indicator offers granular detail about where the most market activity occurs at specific price levels. This makes it a more precise tool for
Volume Profile Sniper v11. 1 è uno strumento completo per l'analisi di mercato Un approccio professionale al trading Volume Profile Sniper v11.1 integra più di 15 filtri chiave in un unico indicatore, fornendo segnali chiari basati su una valutazione completa della situazione del mercato. Caratteristiche principali Analisi dello squilibrio di volume-l'algoritmo calcola la percentuale di acquirenti e venditori in ciascuna candela, segnalando la predominanza di una delle parti (soglia configurab
Money Flow Profile MT5 HERE   Here   our more valuable tools SMC Trend Trading   ,  Easy SMC Trading  ,  Institutional SMC Architect Volume Analysis Tools  ,  Volume flow Profile  ,  Market volume profile  , FVG with Volume  , Liquidity Heatmap Profile  ,  Volume Spread Analysis This Master Edition is engineered for clarity and speed, featuring a unique Auto-Theme Sync system that instantly beautifies your chart layout upon loading. Key Features: True Money Flow Calculation: Goes beyond stand
Pairs synthetique mt4
Vincent Albert Feugier
Pairs Synthetic Pro (Synthetic Pairs & Spread) Master Correlation Trading Correlation trading and statistical arbitrage are now within your reach thanks to the Pairs Synthetic Pro indicator. This tool goes beyond simple ratio analysis, acting as a specialized radar for detecting price imbalances between two assets to anticipate market corrections. For example, when Brent rises while WTI lags, the price spread widens. Our indicator, integrated with adaptive Bollinger Bands, identifies when this d
The   Visual Volatility Clustering   indicator clusters the market based on volatility. The indicator does not redraw and gives accurate data, does not use closing prices. Uses the opening prices or the highs or lows of the previous completed bar. Therefore, all information will be clear and unambiguous. The essence of the indicator is to divide the price market into certain areas according to a similar type of volatility. This can be done in any way. In this example, the indicator is configure
Blahtech Market Profile
Blahtech Limited
4.53 (15)
Was: $249  Now: $99   Market Profile defines a number of day types that can help the trader to determine market behaviour. A key feature is the Value Area, representing the range of price action where 70% of trading took place. Understanding the Value Area can give traders valuable insight into market direction and establish the higher odds trade. It is an excellent addition to any system you may be using. Blahtech Limited presents their Market Profile indicator for the MetaTrader community. Ins
OrderFlow Absorption – Indicatore professionale di Delta e Segnali di Assorbimento per MT4 Sblocca la potenza della vera analisi del flusso degli ordini con OrderFlow Absorption – l’indicatore definitivo di istogramma delta e segnali di assorbimento per MetaTrader 4. Progettato per i trader che vogliono vedere cosa succede davvero dietro ogni movimento di prezzo, questo strumento rivela la pressione nascosta di acquisto/vendita e gli eventi di assorbimento che muovono il mercato. Caratteristiche
Zonecore MT4
Frederic Jacques Collomb
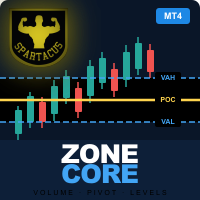
ZONECORE — Volume Profile & Pivot Levels Identificate le zone di prezzo più scambiate con precisione chirurgica. MT5 version Che cos'è ZONECORE? ZONECORE è un indicatore di livello professionale che combina il Profilo di Volume (Volume Profile) e i Livelli Pivot ad alto volume (Pivot Levels) per rivelare le zone di prezzo in cui il mercato ha trascorso più tempo e ha scambiato il maggior volume. Queste zone agiscono come magneti per il prezzo — conoscerle vi offre un vantaggio decisivo nell'ide
Smart Ai Levels Pro+ Wyckoff Theory. Volume Profile. Machine Learning. Institutional Zone Intelligence for Serious Traders This is a sophisticated trading indicator that combines Wyckoff theory, volume profile analysis, machine learning predictions, and multiple timeframe zone calculations. AI-powered Wyckoff zone indicator with real-time volume profile, machine learning reliability predictions, and multi-timeframe cycle analysis. Features 26+ dynamic S/R zones, priority strength markers, volum
The   MarketProfileTPO   indicator for MetaTrader 5 is a powerful tool designed to bring the   Market Profile concept, based on Time Price Opportunity (TPO) analysis , directly onto your main chart window. This indicator calculates and displays the price distribution over a specified period, highlighting key areas of market activity and concentration. It is particularly optimized for   high-volatility instruments   like   NAS100, US30, and XAUUSD   when used on the M1 (1-minute) timeframe, offer
PROP FIRM CHALLENGER EA Automated Grid-Based Trading System for Prop Firm Challenges SPECIAL OFFER: BUY ANY ONE EA FOR $40 — GET THE ENTIRE EA COLLECTION FREE! Take a more systematic approach to prop firm challenges with Prop Firm Challenger EA. Designed for automated trading across Forex, Gold, Cryptocurrencies, and Global Indices, Prop Firm Challenger combines a market-making-inspired grid strategy with configurable money management, order management, and an integrated economic news filter.
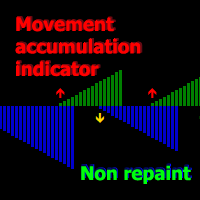
Un indicatore tecnico che calcola le sue letture sui volumi di scambio. Sotto forma di istogramma, mostra l'accumulo della forza del movimento dello strumento di trading. Dispone di sistemi di calcolo indipendenti per le direzioni rialziste e ribassiste. Funziona su qualsiasi strumento di trading e intervallo di tempo. Può integrare qualsiasi sistema di trading. L'indicatore non ridisegna i suoi valori, i segnali appaiono sulla candela corrente. È facile da usare e non carica il grafico, non ric
AutoPivot FXAIEA — see the day's support and resistance at a glance In intraday trading, the hardest part is not spotting a pattern. It is answering the most basic question of all: where will price meet resistance today, where will it find support, and which level actually matters. AutoPivot FXAIEA turns that into something you can simply read off the chart. Every trading day it draws the central pivot P with up to four resistance levels R1–R4 and four support levels S1–S4. Which level price is
Alpha Seeking Bull
Thendo Evans Sithagu
Introducing the Ultimate Trend-Following Indicator: Precision Signals at Your Fingertips In a market saturated with "black-box" systems and cluttered, confusing charts, clarity is the ultimate advantage. Alpha Seeking Bull strips away the noise, distilling complex market analysis into a single, high-fidelity visual cue. Whether you are a seasoned day trader or just starting your journey, this indicator is engineered to provide the confidence you need to execute trades with surgical precision. Th
Using the Trend alternate indicator algorithm, you can quickly understand what kind of trend is currently developing on the market. The Trend Alternate Indicator accompanies lengths, can be used without instruments or timframes. With this indicator, you can try to predict future values. But the main application of the indicator is to generate signals for the purchase and sale. The indicator monitors the market trend with ignoring the sharp fluctuations in the market and the noise around the aver
Gli utenti di questo prodotto hanno anche acquistato
Miraculous Indicator Binary & Forex v3 StrategySafe Miraculous Indicator Binary & Forex v3 StrategySafe è un indicatore professionale progettato per trader che cercano segnali chiari, strumenti di conferma avanzati e un metodo strutturato per operare sui mercati Binary e Forex. La versione v3 include MIR Dashboard, Miraculous Confirmation Dashboard, GANN Law, livelli Square of 9, angoli GANN e una modalità Forex più completa per un’analisi di mercato più precisa. Caratteristiche principali Modal
FFx Engulfing Setup Alerter gives trade suggestions with Entry, Target 1, Target 2 and StopLoss. Below are the different options available: Entry suggestion - pips to be added over the break for the entry 3 different options to calculate the SL - by pips, by ATR multiplier or at the pattern High/Low 3 different options to calculate the 2 TPs - by pips, by ATR multiplier or at Risk/Reward Offset the dashboard - any place on the chart Remove the suggestion once the price reached the SL line Lines
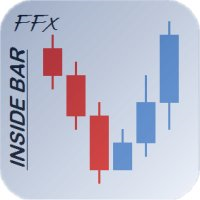
FFx InsideBar Setup Alerter gives trade suggestions with Entry, Target 1, Target 2 and StopLoss. Below are the different options available: Entry suggestion - pips to be added over the break for the entry Minimum candle size - to avoid too close buy/sell entry suggestions 3 different options to calculate the SL - by pips, by ATR multiplier or at the pattern High/Low 3 different options to calculate the 2 TPs - by pips, by ATR multiplier or at Risk/Reward Offset the dashboard - any place on the c
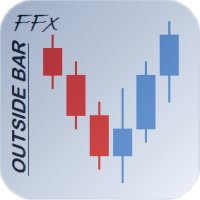
FFx OutsideBar Setup Alerter gives trade suggestions with Entry, Target 1, Target 2 and StopLoss. Below are the different options available: Entry suggestion - pips to be added over the break for the entry. 3 different options to calculate the SL - by pips, by ATR multiplier or at the pattern High/Low. 3 different options to calculate the 2 TPs - by pips, by ATR multiplier or at Risk/Reward. Offset the dashboard - any place on the chart. Remove the suggestion once the price reached the SL line.
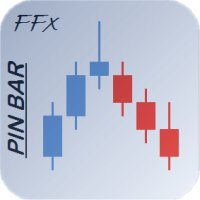
FFx PinBar Setup Alerter gives trade suggestions with Entry, Target 1, Target 2 and StopLoss. Below are the different options available: Entry suggestion - pips to be added over the break for the entry Minimum candle size - to avoid too small candles 3 different options to calculate the SL - by pips, by ATR multiplier or at the pattern High/Low 3 different options to calculate the 2 TPs - by pips, by ATR multiplier or at Risk/Reward Offset the dashboard - any place on the chart Remove the sugges
Automatic, live & interactive picture of all trendlines. Assign push, email and sound alerts to the lines of your choice and be informed about price rollback, breakout, rollback after breakout, number of rollbacks, line expiration by double breakout. Correct, drag or delete the lines and interactively tune the line system. https://youtu.be/EJUo9pYiHFA . Chart examples https: //www.mql5.com/en/users/efficientforex Price Interaction Events All events are effective immediately and only after one
The purpose of this new version of the MT4 standard indicator provided in your platform is to display in a sub-window multiple timeframes of the same indicator with its divergences. See the example shown in the picture below. But the display isn't like a simple MTF indicator. This is the real display of the indicator on its timeframe. Here's the options available in the FFx divergences indicator: Select the timeframes to be displayed (M1 to Monthly) Define the width (number of bars) for each tim
The purpose of this new version of the MT4 standard indicator provided in your platform is to display in a sub-window multiple timeframes of the same indicator with its divergences. See the example shown in the picture below. But the display isn't like a simple MTF indicator. This is the real display of the indicator on its timeframe. Here's the options available in the FFx divergences indicator: Select the timeframes to be displayed (M1 to Monthly). Define the width (number of bars) for each ti
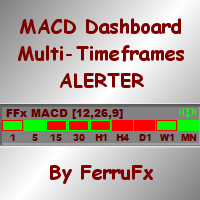
The FFx Dashboard MTF alerter will show you on a single chart all the timeframes (M1 to Monthly) with their own status for the indicator. 2 Alert Options: Single timeframe: each selected timeframe alert separately when a signal occurs Multi timeframes: all selected timeframes must agree for an alert to be triggered Both options have an input to select the timeframes to be used for the alert(s). How to Understand the Status: Green/Red square: histogram above/below 0 line Green square + Red bord
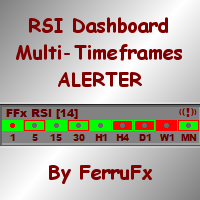
The FFx Dashboard MTF alerter will show you on a single chart all the timeframes (M1 to Monthly) with their own status for the indicator. 2 Alert Options: Single timeframe: each selected timeframe alert separately when a signal occurs Multi timeframes: all selected timeframes must agree for an alert to be triggered Both options have an input to select the timeframes to be used for the alert(s). How to understand the status: Green/Red square: RSI above/below 50 line Green square + Red border: R
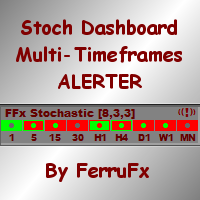
The FFx Dashboard MTF alerter will show you on a single chart all the timeframes (M1 to Monthly) with their own status for the indicator. 2 Alert Options: Single timeframe: each selected timeframe alert separately when a signal occurs Multi timeframes: all selected timeframes must agree for an alert to be triggered Both options have an input to select the timeframes to be used for the alert(s). How to understand the status: Green/Red square: Stoch above/below 50 line Green square + Red border:
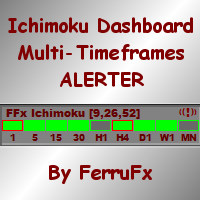
The FFx Dashboard MTF alerter will show you on a single chart all the timeframes (M1 to Monthly) with their own status for the indicator. 2 Alert Options: Single timeframe: each selected timeframe alert separately when a signal occurs Multi timeframes: all selected timeframes must agree for an alert to be triggered Both options have an input to select the timeframes to be used for the alert(s). How to understand the status: Green/Red square: Price above/below Cloud (Kumo) Green square + Red bo
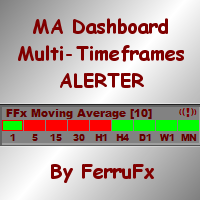
The FFx Dashboard MTF alerter will show you on a single chart all the timeframes (M1 to Monthly) with their own status for the indicator. 2 Alert Options: Single timeframe: each selected timeframe alert separately when a signal occurs Multi timeframes: all selected timeframes must agree for an alert to be triggered Both options have an input to select the timeframes to be used for the alert(s). How to understand the status: Green/Red square: MA pointing Up/Down Green square + Red border: MA po
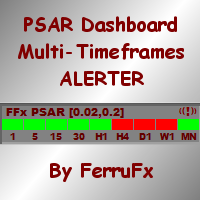
The FFx Dashboard MTF alerter will show you on a single chart all the timeframes (M1 to Monthly) with their own status for the indicator. 2 Alert Options: Single timeframe: each selected timeframe alert separately when a signal occurs. Multi timeframes: all selected timeframes must agree for an alert to be triggered. Both options have an input to select the timeframes to be used for the alert(s). How to understand the status: Green square: Price above PSAR Red square: Price below PSAR Options
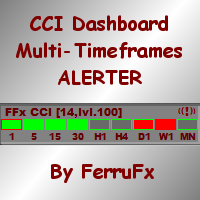
The FFx Dashboard MTF alerter will show you on a single chart all the timeframes (M1 to Monthly) with their own status for the indicator. 2 Alert Options: Single timeframe: each selected timeframe alert separately when a signal occurs Multi timeframes: all selected timeframes must agree for an alert to be triggered Both options have an input to select the timeframes to be used for the alert(s). How to understand the status: Green/Red square: CCI above/below levels (ie. 100/-100) Grey square: C
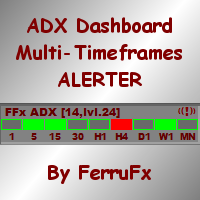
The FFx Dashboard MTF alerter will show you on a single chart all the timeframes (M1 to Monthly) with their own status for the indicator. 2 Alert Options: Single timeframe: each selected timeframe alert separately when a signal occurs Multi timeframes: all selected timeframes must agree for an alert to be triggered Both options have an input to select the timeframes to be used for the alert(s). How to understand the status: Green/Red square: ADX above level Grey square: ADX below level Red bor
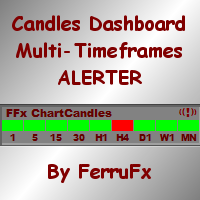
The FFx Dashboard MTF alerter will show you on a single chart all the timeframes (M1 to Monthly) with their own status. 2 Alert Options: Single timeframe: each selected timeframe alert separately when a signal occurs Multi timeframes: all selected timeframes must agree for an alert to be triggered Both options have an input to select the timeframes to be used for the alert(s). How to understand the status: Green/Red square: bullish/bearish candle Options available in the FFx Dashboard Alerter
The indicator of a Professional Trader is an arrow indicator for predicting the direction of price movement. I have been working on this indicator since 2014. You can use this indicator as your main indicator, use its entry signals, and use it as your only indicator to find entry points. About the product: Recommended TF [H4-D1-W1]   . The indicator predicts the direction of the next candle. Fits a variety of tools; Flexibility in settings for different instruments and intervals through the MO
The [GRAFF] III manual trading system is based on multiple MetaTrader (MT4) indicators. Together, the entire PACK of GRAFF III indicators makes an advanced trading tool. The system consists of over 20 different custom-built indicators which have been carefully selected and tested in the long term to produce strong and efficient trading signals. The particular indicators are based on different mathematical formulas, so the entire system is calibrated to remove false signals from its own indicator
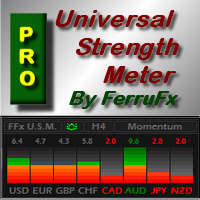
FFx Universal Strength Meter PRO is more than a basic strength meter. Instead of limiting the calculation to price, it can be based on any of the 19 integrated strength modes + 9 timeframes. With the FFx USM, you are able to define any period for any combination of timeframes. For example, you can set the dashboard for the last 10 candles for M15-H1-H4… Full flexibility! Very easy to interpret... It gives a great idea about which currency is weak and which is strong, so you can find the best pai
A simplistic indicator informing a user on RSI divergence by sending messages to mobile device and email. The indicator draws 2 vertical lines, marking two RSI extrema that formed the divergence. You get the alert, open the charts and make a decision. The indicator does not show past divergences, thus when you attach it to a chart for the first time you see nothing. Graphics and alerts will appear as soon as divergences do. Drop it in Tester to see how it works. Parameters: RSIPeriod - number of
Pan PrizMA CD Phase is an analogue of the МetaТrader 5 indicator , and is an option based on the Pan PrizMA indicator. Details . Averaging by a quadric-quartic polynomial increases the smoothness of lines, adds momentum and rhythm. Extrapolation by the sinusoid function near a constant allows adjusting the delay or lead of signals. The value of the phase - wave status parameter (which is close in meaning to the trigonometric phase or the angle of the radius-vector rotation in the trigonometric p
Green Wall Arrows
Daniel Luchinger
1 (1)
The Name Green Wall : Arrows hits a lot of TP, by changing the idea of non using SL as something bad, but instead use Small TP and a lot of free Margin and Patience. Use micro TP and a lot of Free Margin with this indicator on Forex. It also can be used with Binary Options. This strategy is intended to be traded Manually. This Indicator runs on Open Bar, arrows will delete when price are against it. The only Indicator Parameter is Alerts true/false, all the rest is included inside the code. Arro
Golden Monowave
Ahmed Mohamed Ali
Golden Monowave is monowave indicator, the monowave theory is one of Elliott wave approach and one of most complicate and accurate method. Golden Monowave can shortcut many major steps to identify and describe the monowave. It works on any timeframe and with any trading instrument, including currencies, indices, futures, etc. Input Parameters initial_Bars - set the initial number of bars to calculate. wave_color - select the color of the wave. label_color - select the color of labels. temp_labe
Ticks Size
Viktor Kolmakov
This indicator displays in a separate window the difference between the number of points which increased the price, and the number of points that decreased the price during the time interval specified in the settings. The time interval for calculation is expressed as the number of bars of the chart the indicator is attached to. This approach allows you to evaluate the movement direction (growth or fall) of the instrument's price, the strength of the movement and the size of the movement in point
FFx Basket Scanner
Eric Venturi-Bloxs
MetaTrader 5 version available here : https://www.mql5.com/en/market/product/24882 FFx Basket Scanner is a global tool scanning all pairs and all timeframes over up to five indicators among the 16 available. You will clearly see which currencies to avoid trading and which ones to focus on. Once a currency goes into an extreme zone (e.g. 20/80%), you can trade the whole basket with great confidence. Another way to use it is to look at two currencies (weak vs strong) to find the best single pairs
NostradamusMT4
Andrey Spiridonov
1 (1)
NostradamusMT4 is a powerful indicator from the set of professional trader. The indicator is based on Andrei Spiridonov's original price calculation method (ESTIMATED PRICE) for the current candle price. Advantages The indicator does not redraw. It works on any timeframes. Works with any trading instruments. Perfectly suitable for scalping and trading binary options. Parameters Color - color of the ESTIMATED PRICE FUTURE line. How to work with the indicator The indicator forms the ESTIMATED P
Altri dall’autore
BollMTFzzz
Guo Sheng Zhao
Bollinger Bands MTF projects Bollinger Bands from multiple timeframes onto the current MT4 chart. It helps traders review volatility boundaries, trend direction, and nearby price confluence across several timeframes from a single workspace. Key features: - Supports M1, M5, M15, M30, H1, and D1 Bollinger Bands. - Independently displays middle, upper, and lower bands, with an option to show only timeframes above the current chart period. - Evaluates middle-band slope and highlights the active t
FREE
左右交易的其实都是情绪,把握情绪才是交易最终能够获得盈利的关键。 所以我这是一个「趋势氛围灯」指标,它能为您的交易图表做三件事: 1. 一眼识别市场状态 深蓝色背景   → 市场处于 强劲多头氛围 深红色背景   → 市场处于 强劲空头氛围 深灰色背景   → 市场处于 震荡平衡状态 2. 提供直观的视觉辅助 将复杂的多空力量对比 转化为最直观的背景色 让您 无需分析数据 就能感受市场情绪 在多个图表间切换时能 瞬间把握每个品种的当前强弱 3. 辅助交易决策 避免在强势多头时逆势做空 避免在强势空头时逆势做多 在震荡行情中提醒您保持观望或采用区间策略 本质上,它就像为您的交易图表安装了一个「情绪指示灯」,用颜色告诉您市场此刻的“性格”是强势上涨、强势下跌还是犹豫不决.

SAMBAisgood
Guo Sheng Zhao
Long-Term Trend Top & Bottom Identification Indicator (Exclusive for Medium-to-Long-Term Trading) I. Core Orientation of the Indicator This indicator is a streamlined analysis tool   focused on long-term market trends , designed to identify   top and bottom inflection points   for trading varieties such as forex and precious metals. By filtering out interfering signals from small-to-medium cycles, it provides clear guidance for medium-to-long-term trading decisions. II. Core Functions & Chart Pr
The ADX Dashboard V11.03 is a professional MT4 indicator designed to provide traders with an intuitive visual overview of trend strength and market sentiment across multiple timeframes. It integrates ADX (Average Directional Index) and RSI (Relative Strength Index) indicators, presenting key data in a concise dashboard to help traders make quick and informed trading decisions without complex analysis of individual indicator charts. First, the installation process is straightforward. Copy the co
Fibopro
Guo Sheng Zhao
FiboPro 2.11 Indicator User Manual I. Overview FiboPro 2.11 is a dynamic Fibonacci support/resistance indicator for MT4. It calculates multiple Fibonacci levels via a dynamic central line and volatility, intuitively showing market trends (bullish/bearish/sideways) and identifying overbought/oversold signals. Suitable for forex, futures, stocks, etc., it’s recommended for M15+ timeframes to avoid short-term noise. II. Installation Guide Copy fiboz.mq4 to the "MQL4/Indicators" folder in your MT4
================================ ENGLISH MANUAL ================================ Product Name: One-Click Close Utility v9.4 Developer: Gemini Partner Version: 9.40 Platform: MetaTrader 4 Type: Expert Advisor I. PRODUCT OVERVIEW --------------- One-Click Close is a professional order management utility designed for  MetaTrader 4 platform. It provides rapid batch closing operations through  intuitive button interface, integrated with intelligent risk management  system. Suitable for both manual
Ultimate_Combined_System_V16.3_EN Indicator Introduction Ultimate_Combined_System_V16.3 (UCS V16.3) is a professional comprehensive trend-following indicator designed for MetaTrader 4 (MT4). It integrates five core technical analysis factors—MACD, ADX, EMA, Momentum, and Donchian Channel—to provide accurate trend identification and market state judgment, serving as an essential auxiliary tool for trend traders. At the core of the indicator lies a 4-factor voting scoring system , which evaluates
Gold Auction Price Action Dealer Indicator (UTC+0, NY Close). Combines volume profile (POC/VAH/VAL), liquidity sweep detection, naked price action (pinbar/engulfing), breakout-acceptance logic, and multi-timeframe key levels (prior day/week/month, Asian session, H1/H4 swings, round numbers). Includes a cognitive scoring filter based on auction location, session timing, and HTF trend bias to qualify signals. Displays levels, value area box, signal arrows, and an on-chart info panel with trade pla
Quiet Confluence is a multi-factor technical analysis indicator for MT4. It combines Bollinger Band trend context, breakout scoring, MACD divergence, volatility states, and support and resistance information in one chart workspace. It is designed for traders who want to review several aspects of market conditions without switching between multiple indicators. Key features: - Displays Bollinger upper and lower bands with a direction-sensitive middle band. - Calculates breakout scores from pric
Bollinger Insight is a tick-volume price distribution tool for MT4. It displays a volume profile, point of control, value area, and low-volume regions directly on the main chart, helping users examine where market activity was concentrated within the selected range. Key features: - Builds a Tick Volume Profile across configurable price rows. - Displays the point of control and supports a developing POC mode. - Calculates VAH and VAL with an adjustable value-area ratio. - Detects low-volume no
Market Structure Toolkit identifies and annotates price structure, structural breaks, character changes, swing points, and supply and demand regions on MT4 charts. It brings commonly used market-structure tools into one configurable indicator. Key features: - Supports external and internal structure modes. - Marks BoS and CHoCH, with optional CHoT and liquidity-sweep lines. - Detects bullish and bearish order blocks, supply zones, and demand zones. - Can remove invalidated zones or retain and
Squeeze Momentum compares Bollinger Bands with the Keltner Channel to identify volatility compression and release, while a color-coded histogram displays momentum direction and change. It is intended for reviewing low-volatility phases and subsequent volatility expansion. Key features: - Identifies no-squeeze, squeeze-on, and squeeze-released states. - Uses four histogram states for rising bullish, fading bullish, strengthening bearish, and fading bearish momentum. - Provides adjustable Bolli
CR7Structure
Guo Sheng Zhao
CR7 结构——市场结构解码。 价格波动并非随机,而是取决于决策。CR7 Structure旨在精准地向您展示这些决策的制定过程,以及其中一项决策失败的瞬间。 大多数结构分析工具会用几十条线淹没图表,让你自己去猜测哪些线才是关键。CR7 则恰恰相反。它的自适应过滤引擎会持续评估市场波动,只保留当前价格实际遵循的水平。其他所有信息在显示到你的屏幕之前就被舍弃了。 当这些价位之一真正被突破时,CR7 指标会标记突破点,反转趋势状态,并按照市场既定方向重新绘制K线图。你会在突破真正发生的那一刻就看到这种转变——而不是三根K线之后,也不是在一个原本就无关紧要的价位上。 图表上显示的内容 清晰的结构水平线,并以自适应发光效果突出显示当前最重要的两个水平线。活跃结构上实时显示价格标签。突破结构标记采用波动率感知间距,确保它们不会与K线重叠。趋势状态K线颜色有两种可选模式。实时仪表盘显示当前趋势、活跃结构价格、区间宽度、结构强度以及最近一次确认的突破。四款精心调校的专业主题——Aurum、Neon、Carbon和完全自定义。 专为真实交易环境而设计 已确认的K线结构不会改变。无需回溯调整,信号不会
C6MRApro
Guo Sheng Zhao
这个指标通过沉稳、清晰、专业的视野,为复杂多变的以太市场带来更多秩序的观察体验。 无论面对快速波动、方向反复还是节奏模糊的市场环境,该指标均会引发一个紧张、关注、易观察的决策波动。 视觉反馈有助于降低情绪干扰,避免因画面混杂而产生干扰,让用户更耐心等待值得关注的时刻。它既适合盘中快速浏览,也适合复盘时梳理市场状态,使每一次观察市场更有层次,每一次判断更容易,每一次等待更有目的。  在使用贸易中可以进一步发挥交易的机会以及潜在的食品风险。 指标只是交易的一部分,但是我希望你能借助它更好的解读市场,适应市场,紧随市场的趋势;让你在面对行情的时候可以更稳定,更从容,更自信。 z整个指标不追求夸张的颜色对比,也不做过度的解读,只是安静的解释市场发生的事情,提及市场可能存在的风险,让你感受到市场的节奏,从而理性的做出相应的判断。
WZY Whale Fall Structure Lines for MetaTrader 4 A clearer way to read the chart. WZY Whale Fall Structure Lines is a visual market-structure companion for traders who want important price areas to stay visible without covering the chart with manual drawings or extra indicator panels. It brings a calm, organized layer of support and resistance context to the main chart, so you can spend more time reading price and less time maintaining annotations. When the market moves quickly, attention bec
TradeAQ
Guo Sheng Zhao
LuoMo Volume & Price Structure 8.98 A multi-function chart indicator for   MetaTrader 4 and MetaTrader 5 , designed to display key volume, volatility, sentiment, and price-structure information directly on the main chart. Main Features Volume and price-based Support & Resistance Volume spike and exhaustion signals ATR volatility expansion alerts Volume Profile with HVN and LVN Bullish and bearish sentiment distribution Developing or fixed POC VAH and VAL levels Supply and Demand zones Volume-wei
WZY Whale Fall Structure Lines for MetaTrader 4 A clearer way to read the chart. WZY Whale Fall Structure Lines is a visual market-structure companion for traders who want important price areas to stay visible without covering the chart with manual drawings or extra indicator panels. It brings a calm, organized layer of support and resistance context to the main chart, so you can spend more time reading price and less time maintaining annotations. When the market moves quickly, attention bec
Filtro:
Nessuna recensione
Rispondi alla recensione