SMC Reversal Map
- Indicatori
-
Tshivhidzo Moss Mbedzi
 Important Security Notice – MPC Labs (mbedzimz1)
To all my buyers and followers,
For your safety, please read this carefully. - Versione: 1.0
- Attivazioni: 15
SMC Reversal Map is a Smart Money Concepts (SMC) indicator for MetaTrader 5 that marks change of character reversals - the moment market structure breaks and the trend in control loses it. It does something most SMC tools do not: before it shows you a signal, it looks up how the most similar setups in your chart's own history actually turned out, and tells you the result as a confidence score you can act on.
It works on any symbol - forex, indices, metals, crypto - on every timeframe, and it does not repaint. Every signal is confirmed on the close of the bar and never moves afterwards.
Smart Money Concepts, With Evidence Attached
Classic Smart Money Concepts trading watches for a change of character: price breaking a recent swing high or swing low against the prevailing direction. Every SMC indicator marks that moment. The difference here is what happens next.
But not every reversal is worth taking. So instead of simply drawing an arrow, the indicator measures three things about the break:
- Order flow - whether buyers or sellers dominated the bars leading into it.
- Displacement - how large the move was, measured in ATR units, so it is comparable across instruments and volatility regimes.
- Velocity - how quickly price covered that distance.
It then searches every past reversal on your chart, finds the handful that were most similar on those three measures, and checks what happened next in each case. If four of the five closest matches ran in the signal's direction, you see 80% confidence. The projected targets are built the same way - from how far those matching setups actually travelled, not from a fixed multiplier.
The learning is honest. A past setup is only added to the reference set once its outcome window has fully closed, so no signal is ever scored using information that was not available at the time.
How To Use It
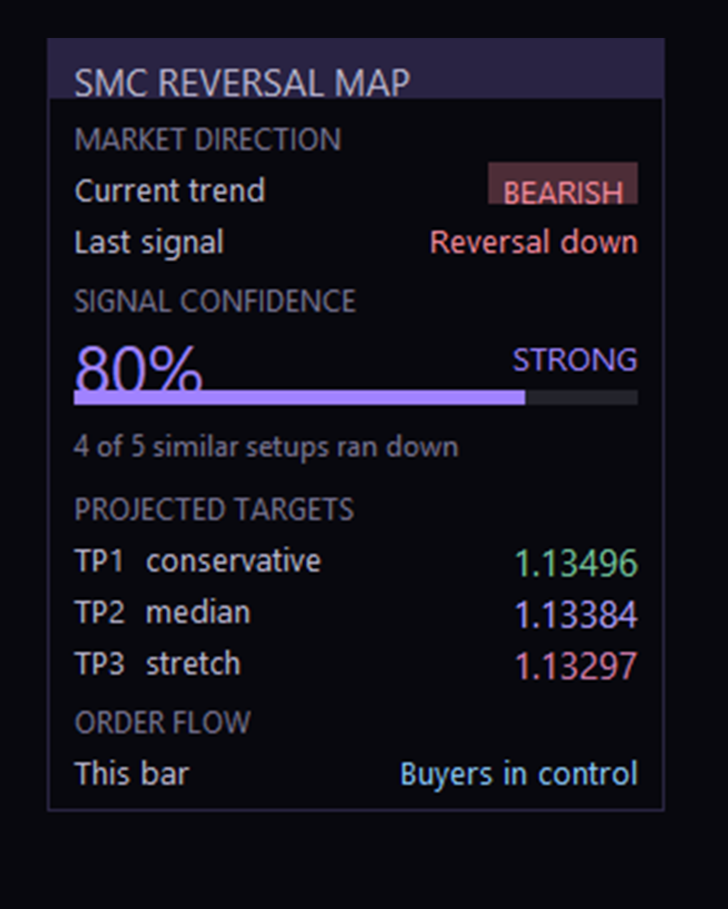
1. Read the panel first. It tells you the current trend direction, what the last signal was, and how much confidence sits behind it. The confidence bar fills and changes colour by tier: STRONG at 80% and above, MODERATE from your threshold up, WEAK below it.
2. Check the sample line. Under the confidence number you will see something like "4 of 5 similar setups ran up". That is the raw evidence behind the percentage. If it says the history is still building, the engine has not seen enough comparable setups yet on that chart - give it more bars, or drop to a lower timeframe where setups occur more often.
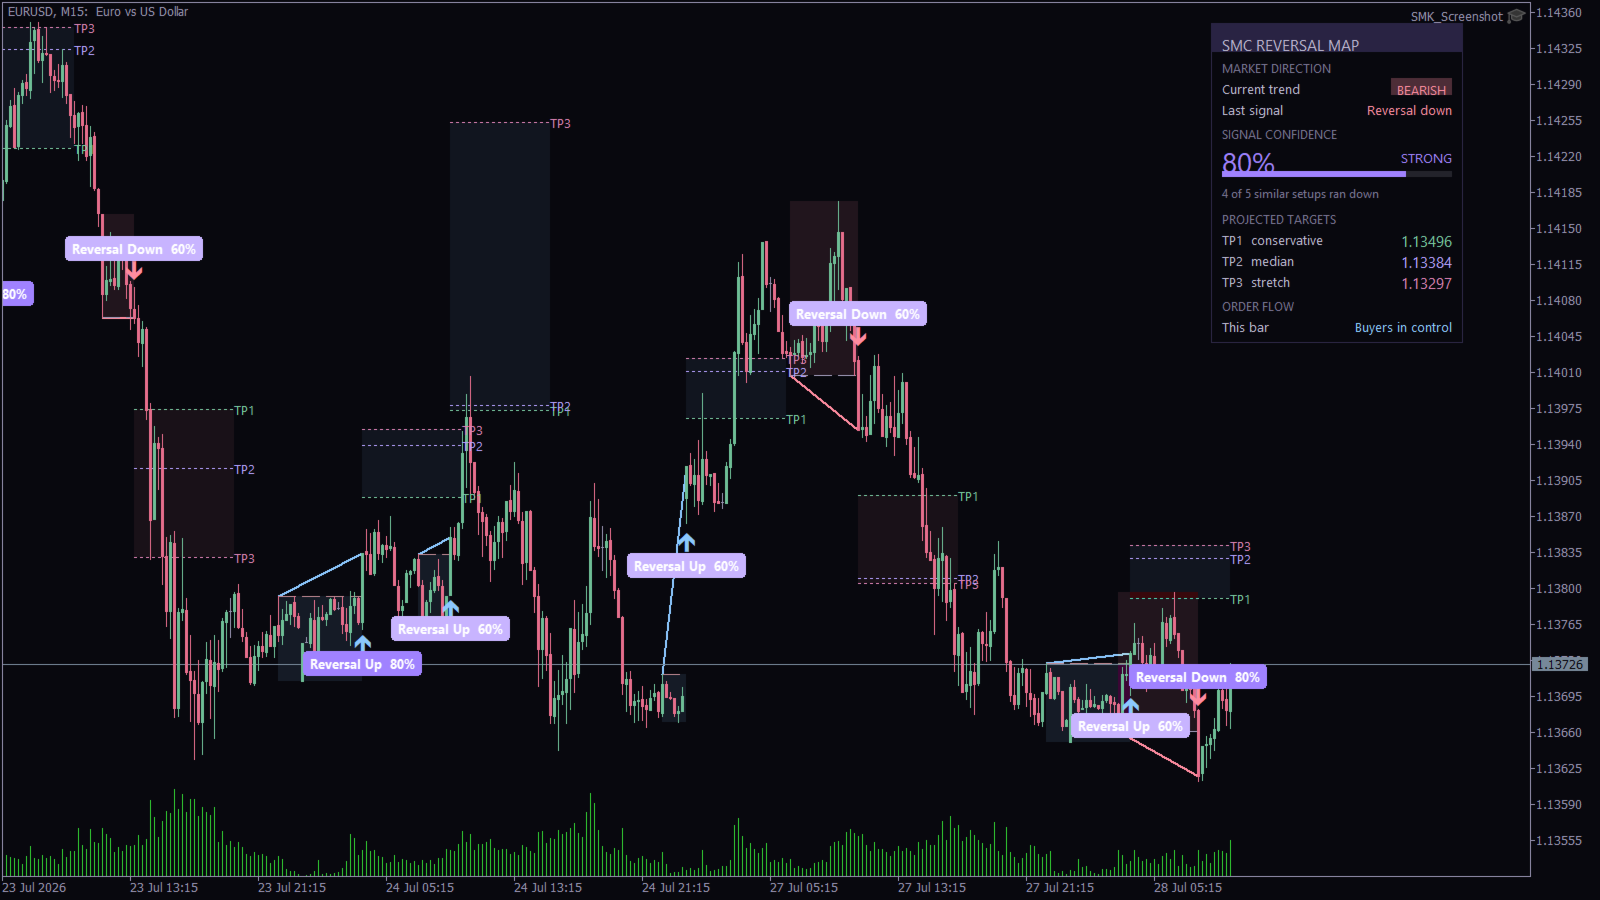
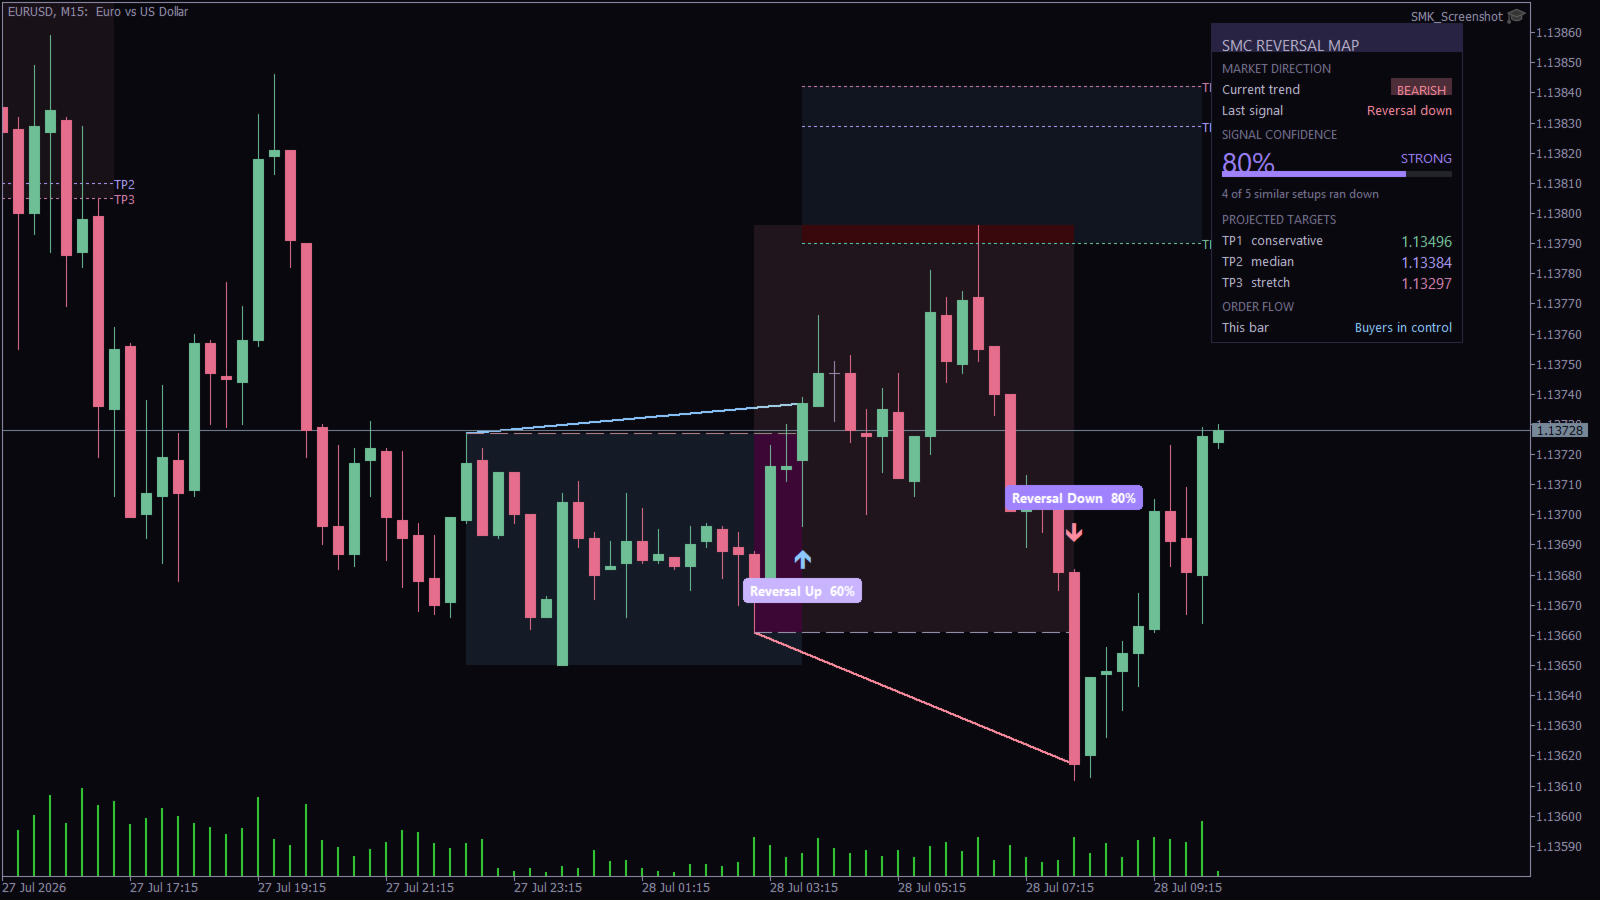
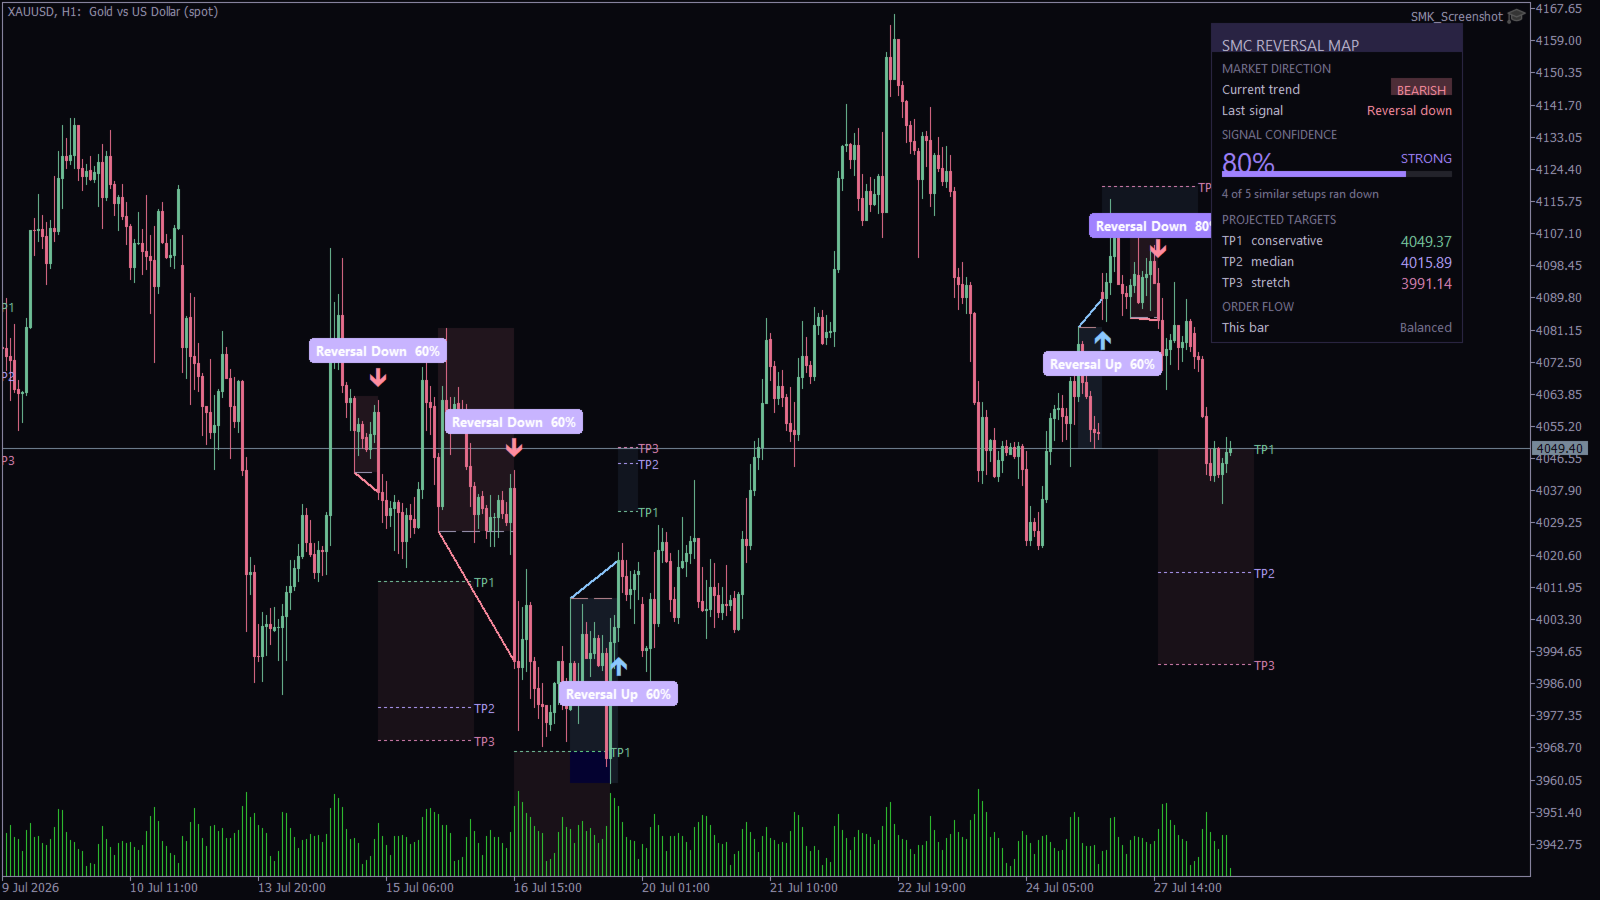
3. Take the arrow as the trigger. A blue arrow below a bar marks a bullish reversal; a pink arrow above a bar marks a bearish one. The badge beside it repeats the direction and confidence so you never have to guess which signal a zone belongs to.
4. Use the three targets as a plan, not a promise. TP1 conservative, TP2 median and TP3 stretch come from the distribution of past outcomes. A common approach is to take partial profit at TP1, move the stop to entry, and let the rest run toward TP2 and TP3. Your stop belongs beyond the swing level that was broken - the dashed line the indicator draws for you.
5. Tune one setting, not ten. "Minimum confidence to show a signal" is the master filter. Raise it to 80 and you will see only the strongest setups; lower it to 50 and you will see far more, most of them mediocre. Everything else can stay at its default.
What You See On The Chart
- Directional arrows at each confirmed reversal, below the bar for bullish and above it for bearish.
- A confidence badge stating the direction and score in plain words.
- The swing level that was broken, drawn as a dashed line - a natural place for a stop.
- A connector from the broken swing to the break itself, so the structure is obvious.
- A shaded zone covering the move into the reversal.
- A target zone with TP1, TP2 and TP3 marked and labelled.
- A dashboard summarising direction, confidence, evidence, targets and current order flow.
Honest Notes On The Confidence Score
The score is an empirical frequency, not a statistical guarantee. With the default of five neighbours compared, it can only ever read 0, 20, 40, 60, 80 or 100 percent - which is exactly why the panel also shows the underlying count. A reading of 80% means four of five similar past setups worked out on this chart. It does not mean the next one has an eighty percent chance of working.
Treat it as a relative filter for ranking setups against each other, and size your risk accordingly. The reference set is built from your chart, so different symbols and timeframes will behave differently - which is the point.
What It Does Not Do
This is an analysis tool, not a trading system. It places no orders and makes no claims about profitability. It marks where structure broke, how similar past breaks resolved, and where the resulting targets sit.
Requirements and Notes
- Any symbol, any timeframe. More history means a richer reference set.
- Works alongside other Smart Money Concepts tools - order blocks, fair value gaps, liquidity sweeps - as the structure and confidence layer.
- Signals are confirmed on bar close and do not repaint. The bar still forming never carries a signal.
- The reference set is rebuilt from the chart, so it starts empty on a fresh chart and fills as history is processed.
- One instance per chart.
Input Parameters
Quant Engine
- Bars used to grade each past setup - how far forward the engine looks when deciding whether a past reversal worked.
- How far back to look for similar setups - the memory window, in bars.
- How many similar setups to compare - the K in K-nearest-neighbours. Higher values give smoother, less jumpy confidence readings.
- Minimum confidence to show a signal - the master filter described above.
- ATR period - used to normalise displacement across instruments.
- Swing sensitivity - bars required either side of a swing before it counts. Higher values mean fewer, more significant structure points.
- Maximum past setups remembered - caps the reference set.
Target Zones
- Hide signals below the confidence threshold - on by default, so the chart shows only setups worth reading.
- Show projected target zone, and how many bars it extends.
- TP1 size as a share of the average run.
- Label TP1 / TP2 / TP3, and their colours.
Structure
- Draw reversal connector line.
- Draw the level that was broken, and optionally extend it.
- Shade the move into the reversal, with adjustable transparency.
- Trace the path into the reversal - off by default, with a segment cap.
Signals, Colours and Alerts
- Show confidence badges, badge font size and text colour.
- How many past signals stay on the chart.
- Bullish, bearish, high, medium and low confidence colours.
- Alert on bullish or bearish reversal, each with its own confidence threshold.
- Alert channels - terminal popup, push notification, email and sound.
Dashboard and Engine
- Show dashboard, corner, offsets, font and colours.
- Optional target ribbon and its smoothing length.
- Max bars processed.