Market Structure Leviathan
- Indicatori
- Versione: 1.0
- Attivazioni: 5

Market Structure Leviathan
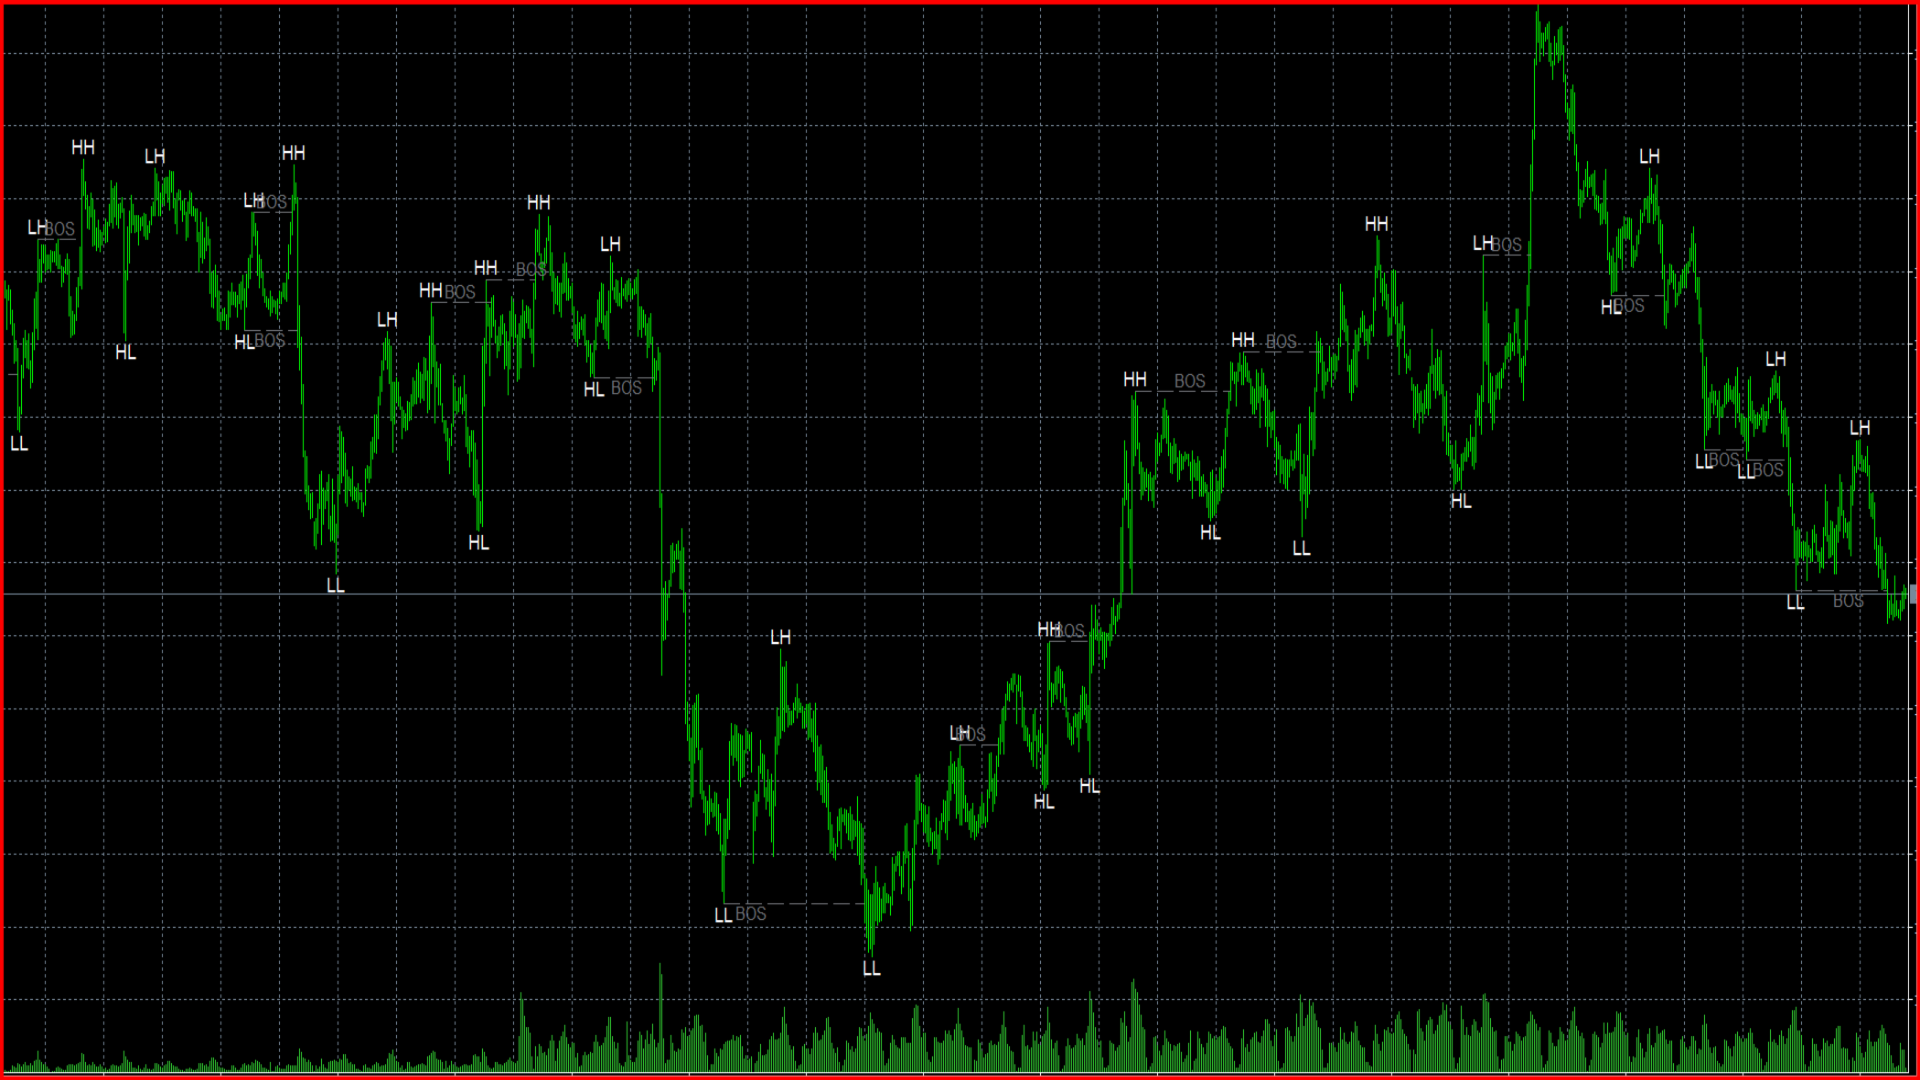
Market Structure Leviathan is a price-action indicator designed to present important structural movements directly on the trading chart. It automatically detects confirmed swing highs and swing lows, classifies market structure, identifies structural breakouts, and displays optional 50% retracement levels between significant price points.
The indicator helps traders understand whether the market is forming higher highs, higher lows, lower highs, or lower lows. This information can be used to evaluate trend direction, recognize possible continuation patterns, and observe early signs of a structural transition.
All calculations are based on confirmed swing formations. A swing point becomes available only after the required candles have formed on both sides of the potential high or low.
Main Features
-
Automatic detection of confirmed swing highs and swing lows
-
Higher High, Higher Low, Lower High, and Lower Low labels
-
Bullish and bearish Break of Structure detection
-
Optional Change of Character classification
-
Candle-close or wick-based breakout confirmation
-
Optional 50% retracement levels
-
Adjustable swing sensitivity
-
Clear market structure lines and labels
-
Suitable for different symbols and chart periods
-
Fully customizable visual settings
Swing Structure Classification
The indicator analyzes consecutive confirmed swing points and assigns one of four structural labels:
Higher High — HH
A Higher High is formed when a confirmed swing high is positioned above the previous relevant swing high. It may indicate that bullish momentum remains active.
Higher Low — HL
A Higher Low appears when a confirmed swing low remains above the previous relevant swing low. During an established bullish structure, this area may represent a corrective phase before another upward movement.
Lower High — LH
A Lower High is detected when a confirmed swing high forms below the previous relevant swing high. It may indicate weakening bullish pressure or continuation of a bearish structure.
Lower Low — LL
A Lower Low is formed when a confirmed swing low moves below the previous relevant swing low. This structure is commonly associated with continued bearish price development.
These labels allow traders to follow the progression of market structure without manually marking every significant high and low.
Break of Structure
A Break of Structure, or BOS, is displayed when price moves beyond an important previously confirmed swing level in the direction of the current market structure.
A bullish BOS may occur when price breaks above a relevant swing high. A bearish BOS may occur when price breaks below a relevant swing low.
BOS events can help identify:
-
Trend continuation
-
Expansion after consolidation
-
Development of a new structural high or low
-
Increasing directional momentum
-
Important breakout areas
A Break of Structure should not be considered an automatic entry signal. Market conditions, volatility, liquidity, and additional confirmation should also be evaluated.
Change of Character
The optional CHoCH setting changes the first structural break against the established market direction from BOS to CHoCH.
For example, when the market has been forming higher highs and higher lows, a break below a relevant structural low may be classified as a bearish CHoCH. During a bearish sequence, a break above an important structural high may be classified as a bullish CHoCH.
A Change of Character may indicate:
-
Weakening of the current trend
-
A possible transition into a new structure
-
The beginning of a consolidation phase
-
A potential reversal
-
A temporary counter-trend movement
CHoCH highlights a change in structural behavior, but it does not guarantee that a complete trend reversal will follow.
Swing Length
The Swing Length parameter controls how many candles are evaluated on the left and right sides of a potential swing point.
A lower value increases sensitivity and produces more swing points. This can provide a detailed view of short-term price movement, but it may also include smaller fluctuations and market noise.
A higher value requires a broader formation before confirming a swing. This reduces the number of displayed points and emphasizes larger structural movements.
General interpretation:
-
Lower Swing Length: more frequent signals and short-term structures
-
Higher Swing Length: fewer signals and broader market structures
The appropriate setting depends on the symbol, timeframe, volatility, and trading approach. Traders may need to adjust the parameter when moving between lower and higher chart periods.
BOS Confirmation Method
The indicator provides two methods for confirming structural breaks.
Candle Close
A BOS or CHoCH is confirmed only when a candle closes beyond the relevant swing level.
This method generally produces fewer structural breaks and may help filter temporary price spikes.
Wick
A structural break is confirmed when the candle’s high or low crosses the relevant swing level, even when the candle closes back inside the structure.
This method is more sensitive and can identify breakouts earlier, but it may also produce more signals during volatile market conditions.
The confirmation method should be selected according to the trader’s preferred balance between sensitivity and confirmation.
50% Retracement Level
The optional retracement feature displays the midpoint between two structural points of an expansion move.
The level is calculated as:
Retracement Level = (Swing High + Swing Low) / 2
During bullish market structure, the midpoint can be drawn between a Higher Low and the following Higher High.
During bearish market structure, the midpoint can be drawn between a Lower High and the following Lower Low.
The 50% level may be used as a visual reference for:
-
Monitoring possible pullback areas
-
Evaluating the depth of a correction
-
Identifying the midpoint of an impulsive move
-
Planning continuation setups
-
Comparing current price with the previous expansion range
The level represents a mathematical midpoint and should not be treated as guaranteed support, resistance, or an automatic trade entry.
Input Parameters
Swing Length
Defines the number of candles used on each side of a potential swing high or swing low.
BOS Confirmation
Selects the method used to confirm a structural break:
-
Candle Close
-
Wick
Show CHoCH
When enabled, the first break against the current structural direction is labeled as CHoCH instead of BOS.
Show Swing Points
Shows or hides HH, HL, LH, and LL labels on the chart.
Show 0.5 Retracement Level
Enables or disables the midpoint level between the relevant swing points of a structural expansion.
Visual Settings
Allows users to adjust the appearance of bullish structures, bearish structures, labels, lines, and retracement levels.
Suggested Applications
The indicator may assist traders with:
-
Determining the current structural direction
-
Following bullish and bearish swing sequences
-
Identifying trend continuation through BOS
-
Monitoring possible structural transitions through CHoCH
-
Locating previous swing breakout levels
-
Evaluating pullbacks around the 50% midpoint
-
Aligning lower-timeframe setups with higher-timeframe structure
-
Adding structural confirmation to an existing trading method
For multi-timeframe analysis, traders can use a higher timeframe to determine the primary market structure and a lower timeframe to study entries and short-term reactions.
Important Information
Swing points require confirmation from candles on both sides of the potential turning point. For this reason, structural labels appear only after the complete swing formation is available.
Signals may be delayed during fast market movements because confirmation requires additional closed candles. Lower swing settings may generate more frequent structures, while higher settings may respond more slowly.
BOS, CHoCH, swing labels, and retracement levels are analytical references only. They do not predict future price movement and cannot eliminate false breakouts, market noise, or unexpected volatility.
This indicator should be combined with appropriate risk management, position sizing, stop-loss planning, and independent market analysis.