Xcursion
- Utilità
- Versione: 1.43
- Aggiornato: 9 luglio 2026
- Attivazioni: 5

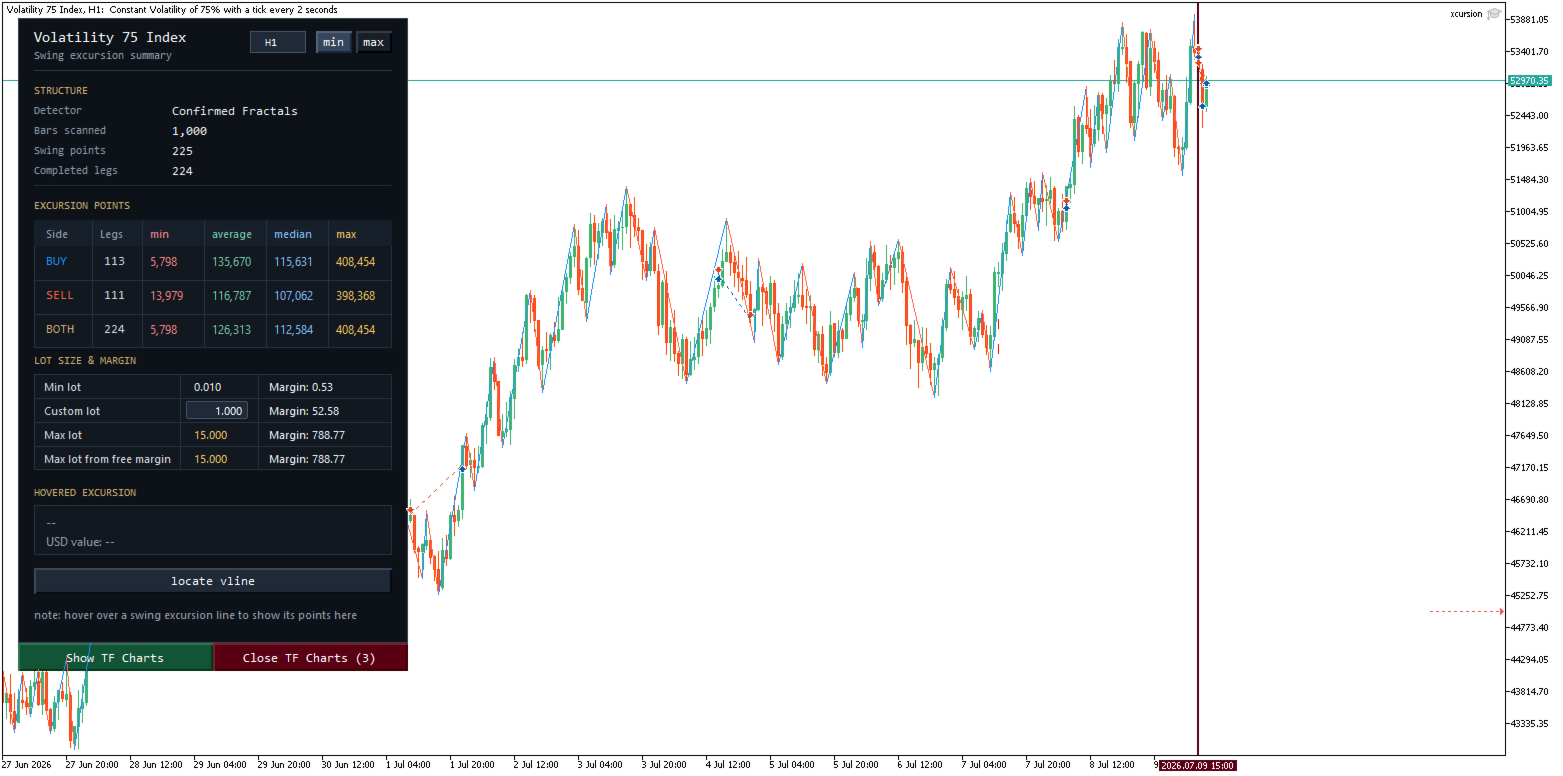
This MT5 chart synchronization and swing excursion analysis tool is designed to help traders study price movement across multiple time frames from a single, coordinated workspace. It synchronizes several MetaTrader 5 chart views using a shared, draggable vertical reference line, allowing the same historical moment to be examined simultaneously across different time-frame charts.
When the reference line is moved on one synchronized chart, the tool automatically updates its position on every connected chart. This makes it easier to compare market structure, price behaviour and swing development across time frames without manually scrolling through each chart or attempting to align dates and candle positions individually. A trader can therefore analyse how a movement visible on a lower time frame relates to the broader structure shown on higher time frames.
For example, the user may connect M1, M5, M15, H1 and H4 charts for the same trading instrument. Moving the vertical line to a specific candle on the M5 chart immediately identifies the corresponding time on all other connected charts. This provides a clear multi-time-frame view of the market conditions surrounding a particular price movement, entry, reversal, breakout or trading signal.
In addition to chart synchronization, the tool identifies fractal-based swing points and calculates excursion statistics for the price legs formed between those points. Fractals are used to locate significant local highs and lows, allowing the indicator to divide price movement into measurable bullish and bearish swing legs.
A buy leg represents an upward excursion from a confirmed swing low toward a subsequent swing high. A sell leg represents a downward excursion from a confirmed swing high toward a subsequent swing low. The tool measures the size of each identified leg in points, providing an objective representation of how far price travelled during the movement.
Swing statistics are separated into three analytical categories:
Buy excursion statistics measure bullish price legs and help the trader evaluate the typical size, range and behaviour of upward market movements.
Sell excursion statistics measure bearish price legs and provide comparable information about downward market movements.
Combined excursion statistics aggregate both bullish and bearish legs, giving the trader a broader view of the instrument’s overall swing characteristics.
Depending on the configured display and calculation options, the statistics may include values such as the number of detected swings, minimum excursion, maximum excursion, average excursion and other useful measurements derived from the available fractal legs. Because the calculations are expressed in points, the results can be used directly when evaluating price targets, stop-loss distances, trailing-stop parameters, volatility conditions and expected market movement.
The shared vertical line also allows the trader to inspect excursion data at specific historical locations. Instead of viewing only the most recent market conditions, the user can drag the line backwards through the chart and analyse how swings behaved during previous sessions, trends, consolidations, breakouts or periods of elevated volatility.
This makes the tool useful for discretionary analysis, strategy development, parameter selection and manual backtesting. Traders can compare whether bullish and bearish excursions are balanced, identify time frames that produce cleaner or larger swings, and determine whether an instrument’s current movement is relatively small, normal or unusually extended compared with previously detected legs.
The tool is particularly valuable for traders who use market structure, fractals, swing highs and lows, trend continuation, pullbacks, breakout systems or multi-time-frame confirmation. By combining synchronized chart navigation with quantitative swing measurements, it reduces repetitive chart work and transforms visible price movements into structured statistical information.
Overall, the tool provides a more efficient way to explore market behaviour across multiple time frames. It combines synchronized historical navigation, fractal-based swing detection and excursion measurement in one MT5 utility, helping traders understand not only where price moved, but also how far it moved and how that movement compares with other bullish, bearish and combined swing legs.