Bb stochastic dots indicator
- Indicatori
- Versione: 1.0
- Attivazioni: 5
BB Stochastic Dots Indicator V.1
What the Indicator Does
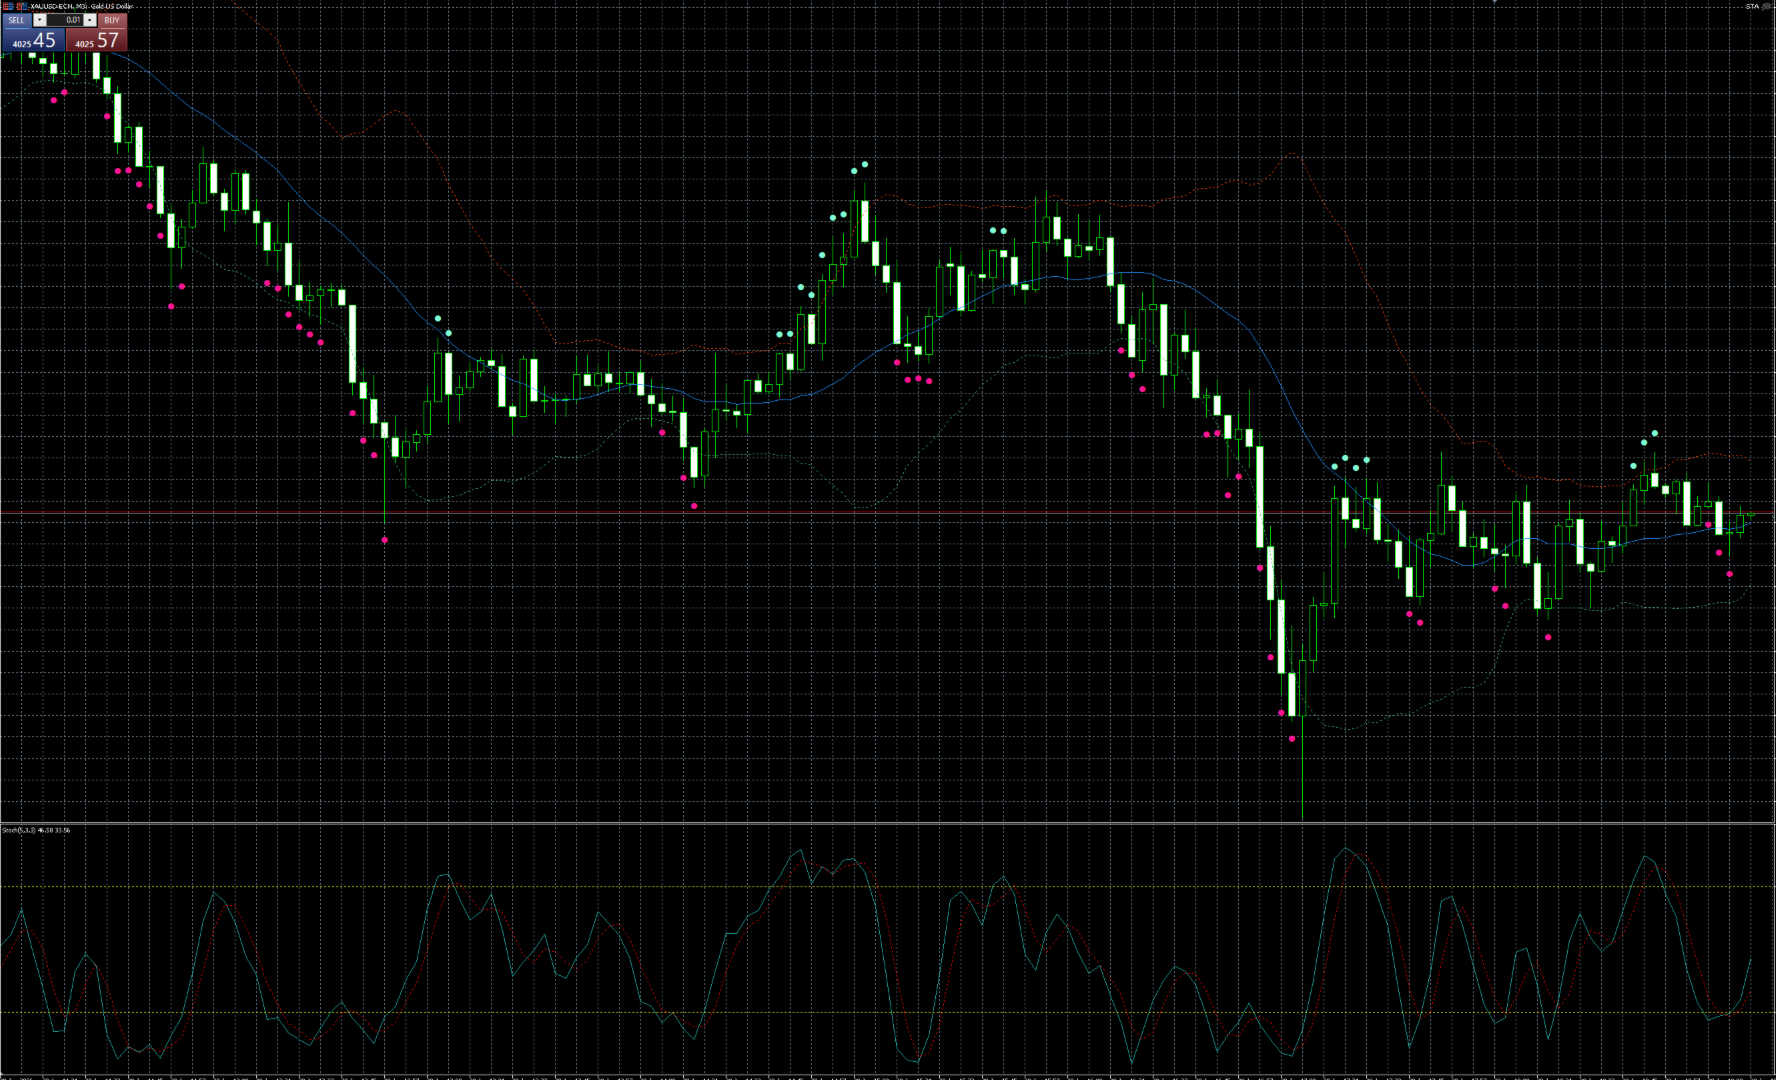
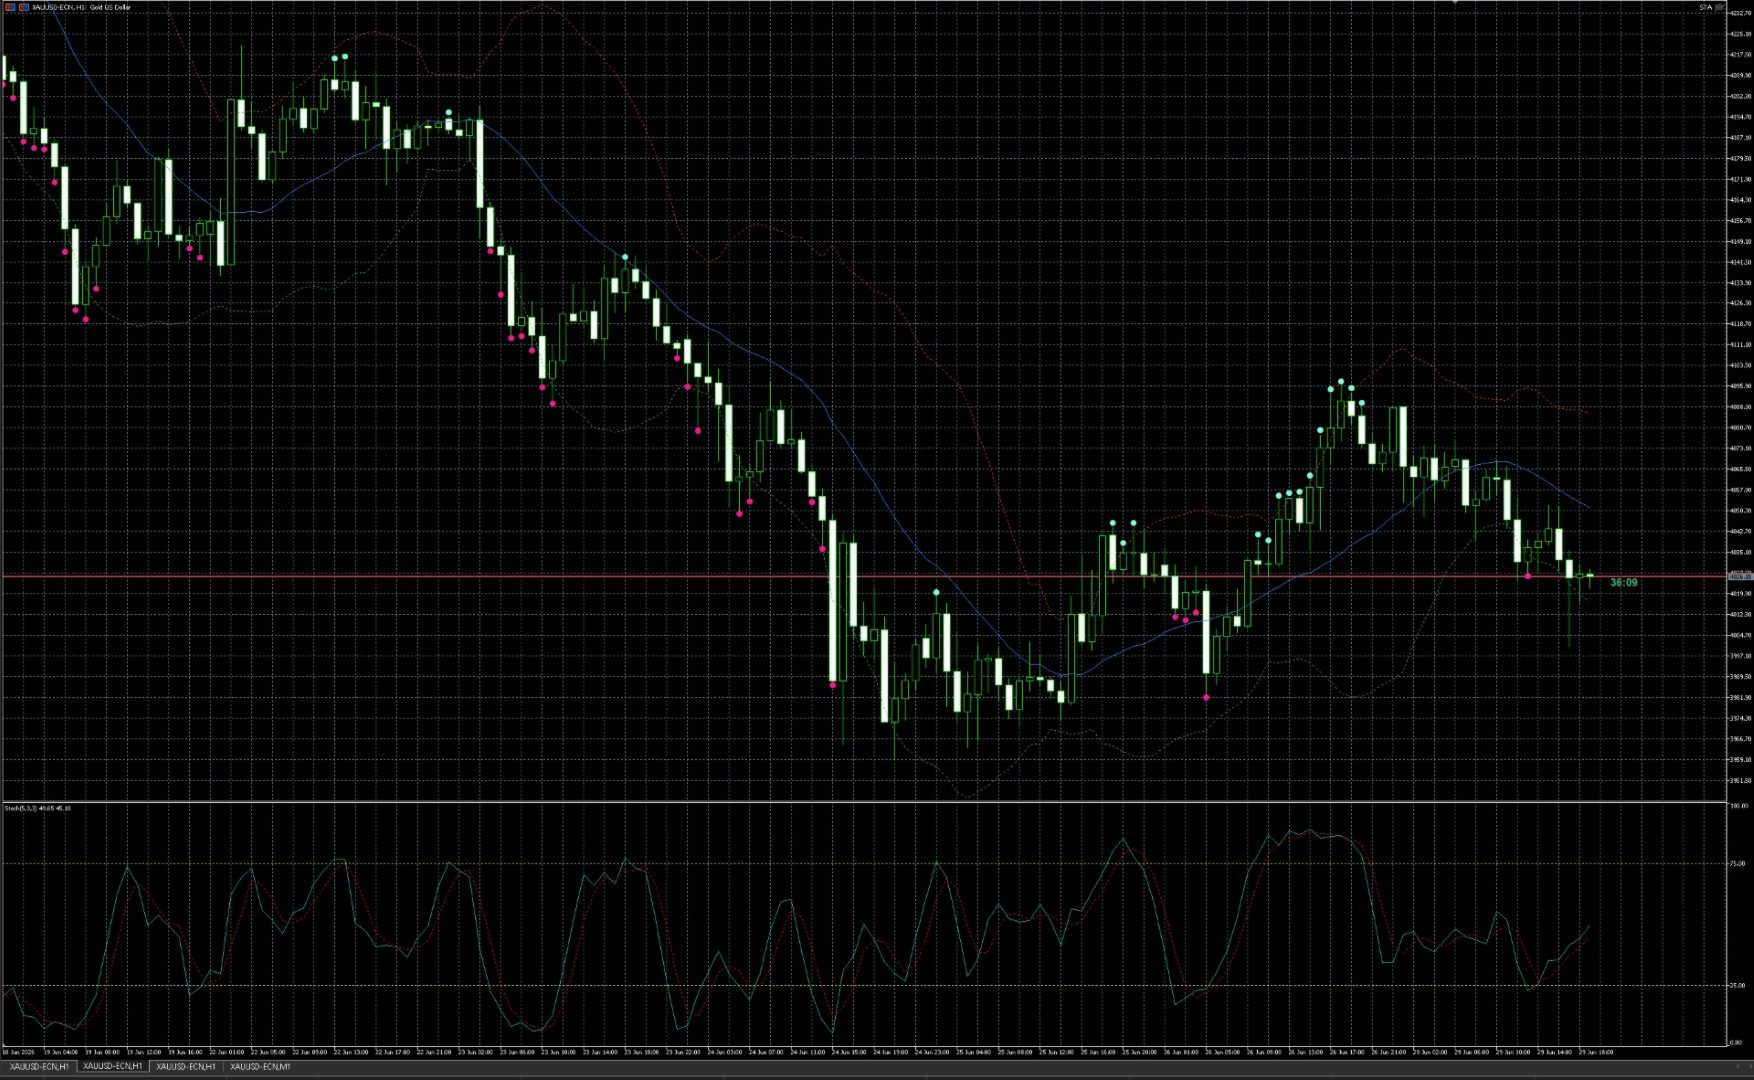
This indicator displays the following directly on the chart:
Bollinger Bands
- Upper Band
- Middle Band
- Lower Band
Stochastic Signal Dots
- Red Dot = Potential SELL signal
- Green Dot = Potential BUY signal
The indicator does not open trades automatically. It is designed solely to display visual trading signals on the chart.
The indicator continuously monitors the Stochastic Oscillator.
When the Stochastic value rises above the configured upper level (for example, 75), a red dot is plotted above the candle, indicating a potential SELL opportunity.
When the Stochastic value falls below the configured lower level (for example, 25), a green dot is plotted below the candle, indicating a potential BUY opportunity.
At the same time, the indicator plots the Bollinger Bands, allowing traders to see whether the current price is approaching the upper or lower band.
The user can customize:
- Indicator timeframe
- Bollinger Bands period
- Bollinger Bands deviation
- Stochastic parameters
- Upper signal level
- Lower signal level
- Distance of the signal dots from the candles
- Signal dot size
- Number of candles to analyze
✅ Simple and easy-to-read indicator
✅ Runs directly on MetaTrader 5
✅ Does not execute trades, making it safe for technical analysis
✅ Combines Bollinger Bands with the Stochastic Oscillator
✅ Helps identify potential overbought and oversold market conditions
✅ Configurable timeframe
✅ Suitable for Gold (XAUUSD), Forex, Indices, and Cryptocurrency CFDs
❌ Not an automated trading robot
❌ Does not provide alerts or notifications
❌ No built-in trend filter
❌ Signals alone do not guarantee profitable trades
❌ During strong market trends, false signals may occur more frequently
❌ Does not include Stop Loss, Take Profit, or money management
This indicator is ideal for:
- Scalpers
- Intraday traders
- MetaTrader 5 beginners
- Gold (XAUUSD) traders
- Traders who prefer visual trading signals without automated execution
BB Stochastic Dots Indicator V.1 is a simple and intuitive indicator for the MetaTrader 5 platform that combines Bollinger Bands with the Stochastic Oscillator. It helps traders quickly identify potential overbought and oversold market conditions using color-coded signal dots displayed directly on the chart.
A red dot indicates a potential SELL zone, while a green dot indicates a potential BUY zone. At the same time, the indicator plots the Bollinger Bands, allowing traders to clearly see the current price position relative to market volatility.
The indicator is designed as a supporting tool for manual trading, entry confirmation, and trade opportunity filtering. It does not execute trades automatically, giving traders full control over every trading decision.